NLRB Stats Archive › Annual Reports › FY1990 › Standard Federal Administrative Regional Distribution of Cases Received, Fiscal Year 1990
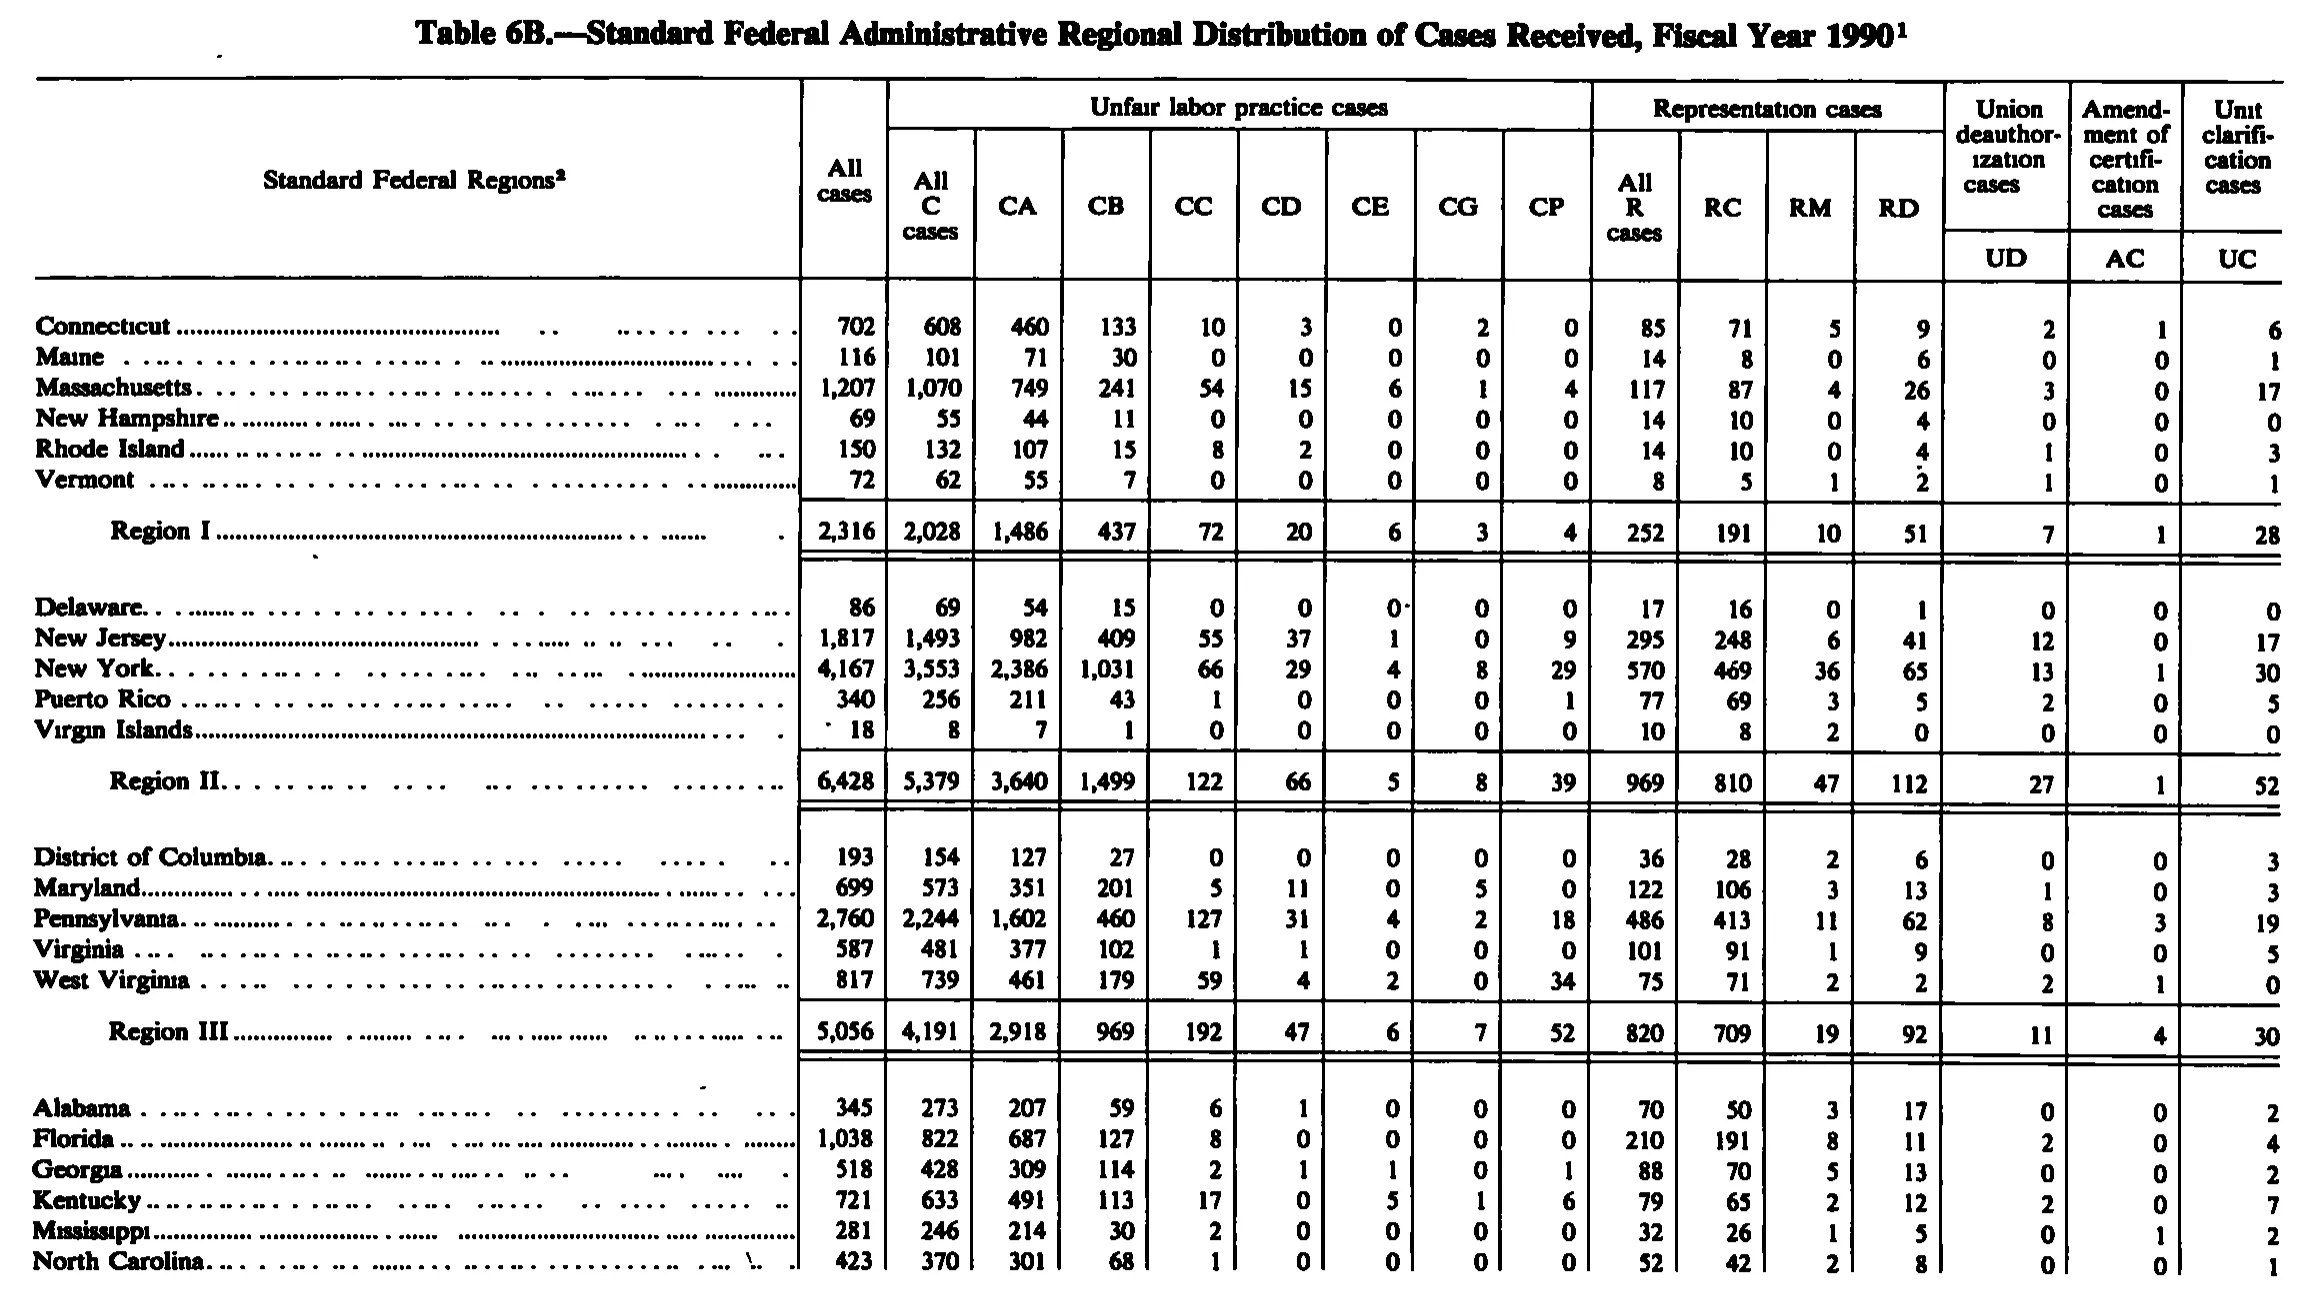
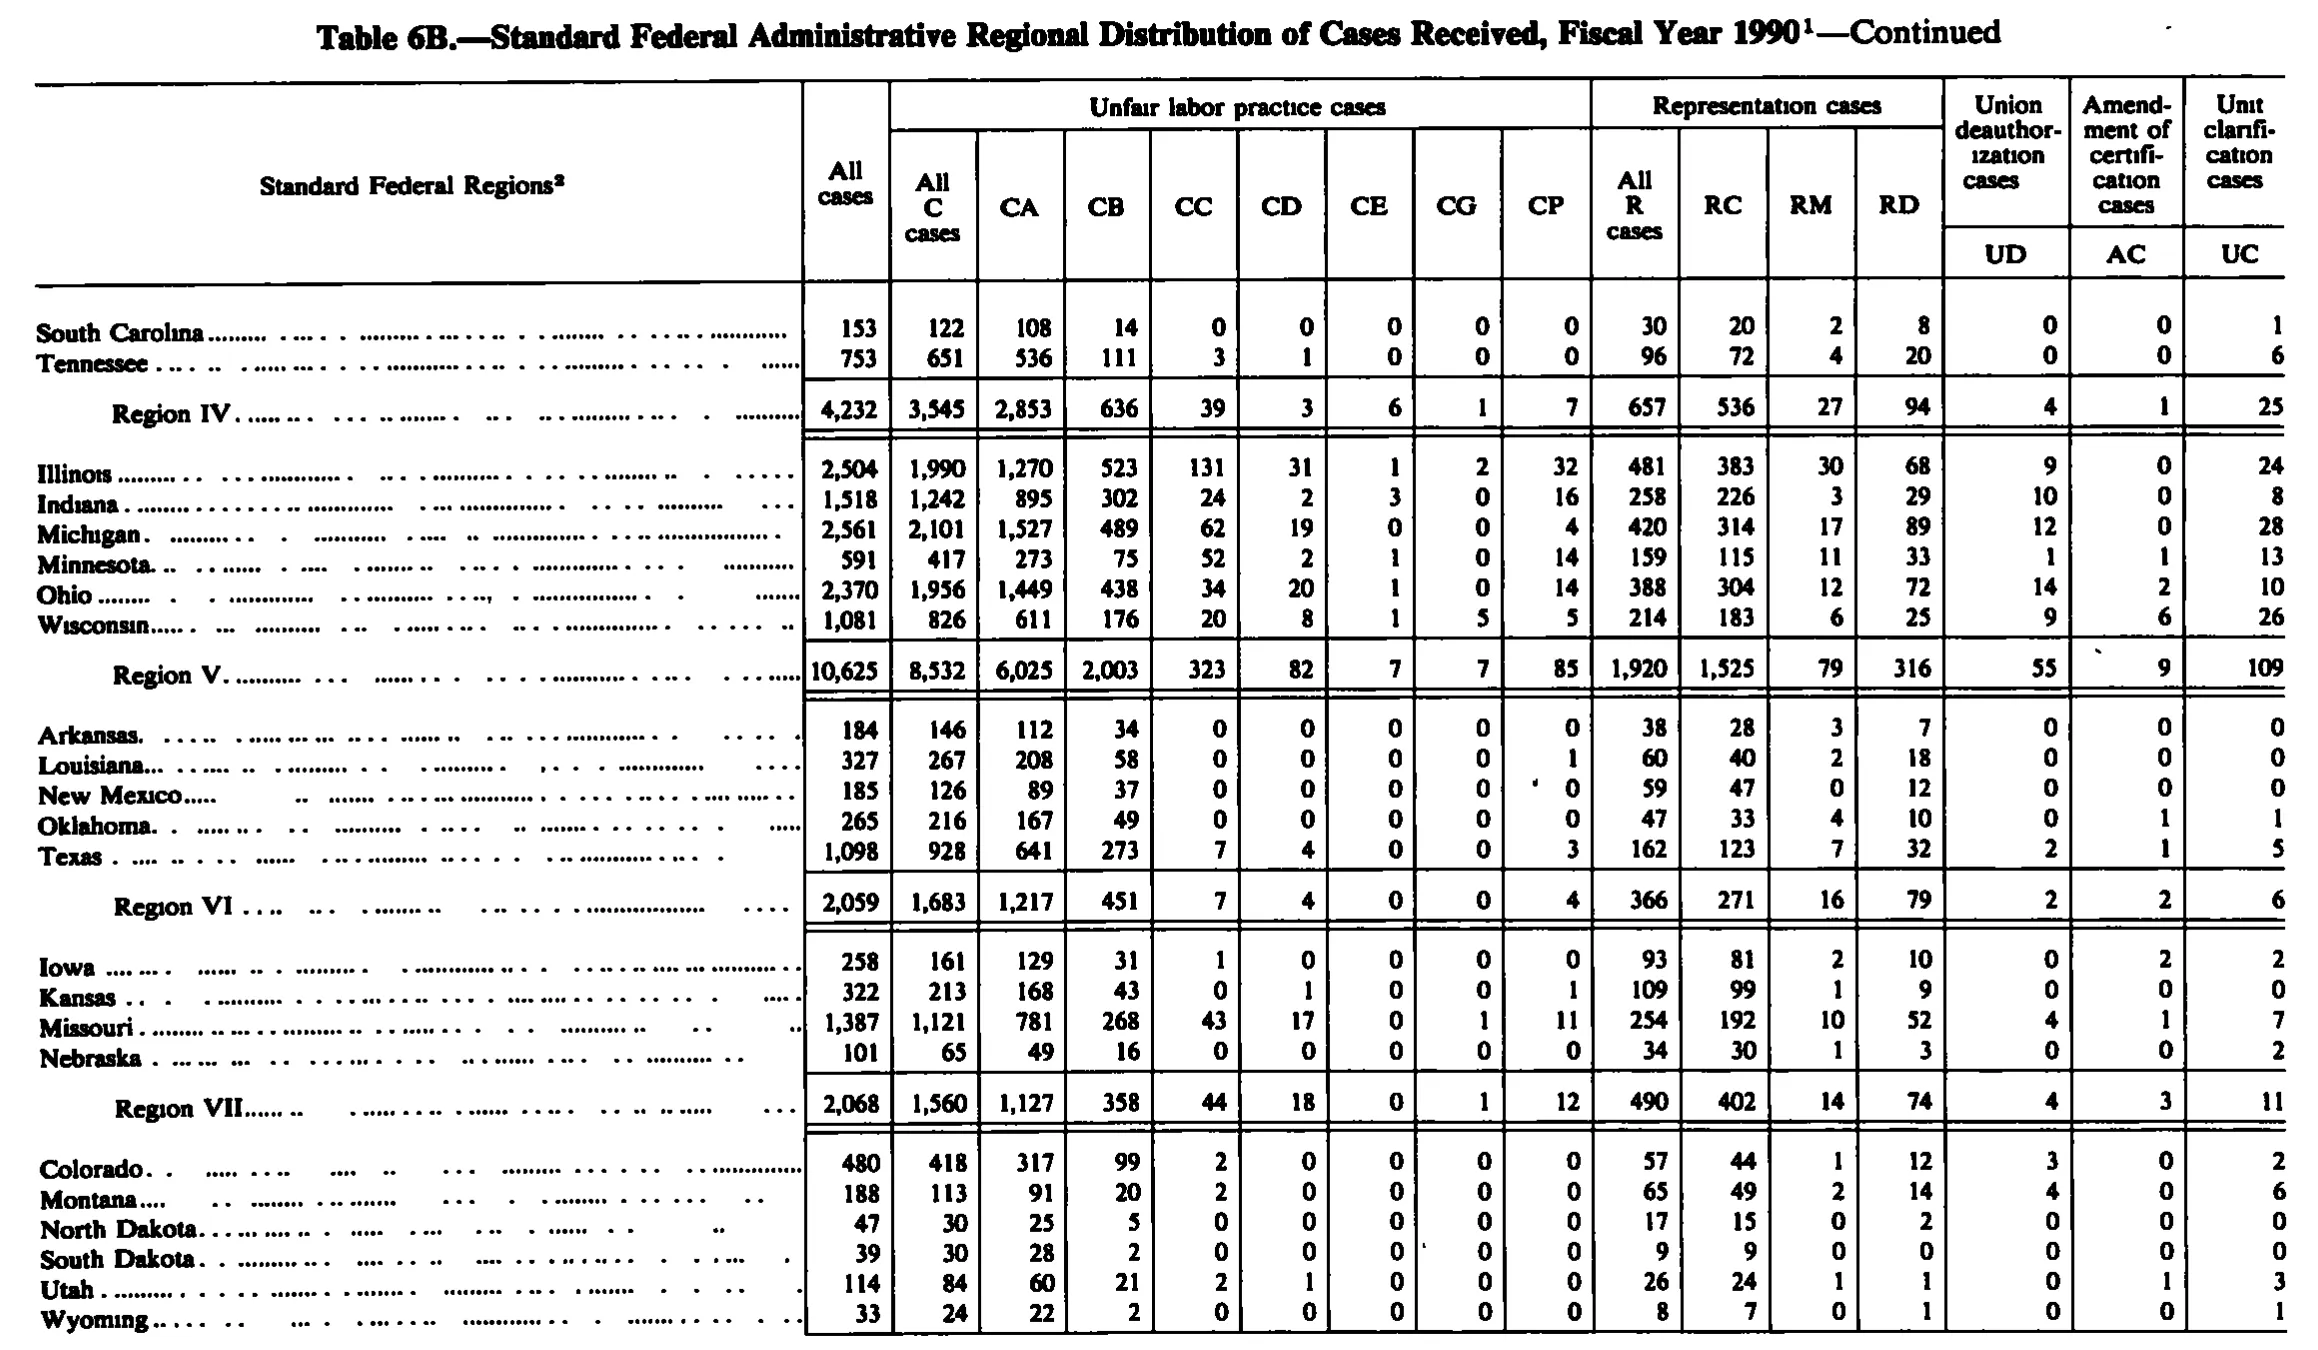
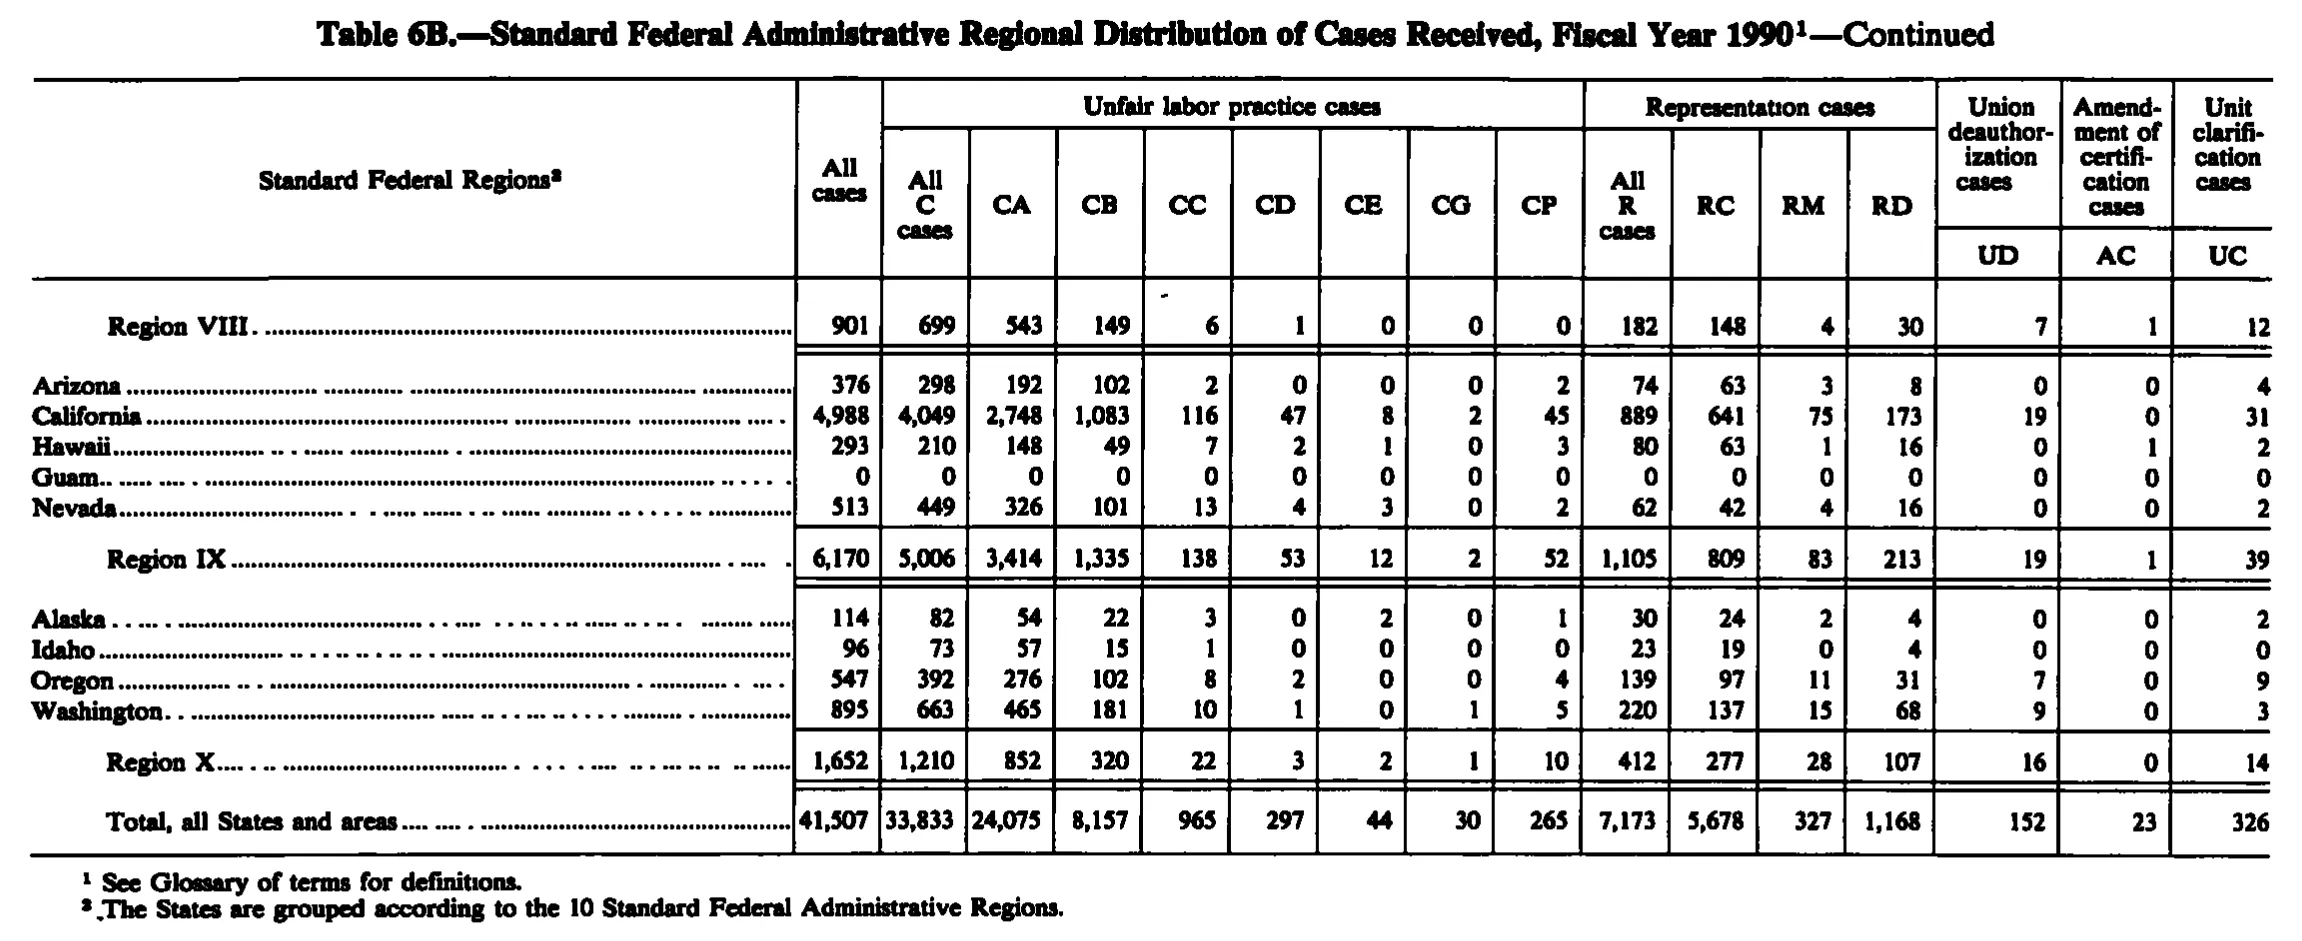
Standard Federal Administrative Regional Distribution of Cases Received, Fiscal Year 1990
Stitched from pp. 164–166.
| Standard Federal Regions | All cases | Unfair labor practice cases | Representation cases | Union deauthorization cases | Amendment of certification cases | Unit clarification cases | ||||||||||
|---|---|---|---|---|---|---|---|---|---|---|---|---|---|---|---|---|
| Standard Federal Regions | All cases | All C cases | CA | CB | CC | CD | CE | CG | CP | All R cases | RC | RM | RD | Union deauthorization cases | Amendment of certification cases | Unit clarification cases |
| Standard Federal Regions | All cases | All C cases | CA | CB | CC | CD | CE | CG | CP | All R cases | RC | RM | RD | UD | AC | UC |
| Connecticut | 702 | 608 | 460 | 133 | 10 | 3 | 0 | 2 | 0 | 85 | 71 | 5 | 9 | 2 | 1 | 6 |
| Maine | 116 | 101 | 71 | 30 | 0 | 0 | 0 | 0 | 0 | 14 | 8 | 0 | 6 | 0 | 0 | 1 |
| Massachusetts | 1,207 | 1,070 | 749 | 241 | 54 | 15 | 6 | 1 | 4 | 117 | 87 | 4 | 26 | 3 | 0 | 17 |
| New Hampshire | 69 | 55 | 44 | 11 | 0 | 0 | 0 | 0 | 0 | 14 | 10 | 0 | 4 | 0 | 0 | 0 |
| Rhode Island | 150 | 132 | 107 | 15 | 8 | 2 | 0 | 0 | 0 | 14 | 10 | 0 | 4 | 1 | 0 | 3 |
| Vermont | 72 | 62 | 55 | 7 | 0 | 0 | 0 | 0 | 0 | 8 | 5 | 1 | 2 | 1 | 0 | 1 |
| Region I | 2,316 | 2,028 | 1,486 | 437 | 72 | 20 | 6 | 3 | 4 | 252 | 191 | 10 | 51 | 7 | 1 | 28 |
| Delaware | 86 | 69 | 54 | 15 | 0 | 0 | 0 | 0 | 0 | 17 | 16 | 0 | 1 | 0 | 0 | 0 |
| New Jersey | 1,817 | 1,493 | 982 | 409 | 55 | 37 | 1 | 0 | 9 | 295 | 248 | 6 | 41 | 12 | 0 | 17 |
| New York | 4,167 | 3,553 | 2,386 | 1,031 | 66 | 29 | 4 | 8 | 29 | 570 | 469 | 36 | 65 | 13 | 1 | 30 |
| Puerto Rico | 340 | 256 | 211 | 43 | 1 | 0 | 0 | 0 | 1 | 77 | 69 | 3 | 5 | 2 | 0 | 5 |
| Virgin Islands | 18 | 8 | 7 | 1 | 0 | 0 | 0 | 0 | 0 | 10 | 8 | 2 | 0 | 0 | 0 | 0 |
| Region II | 6,428 | 5,379 | 3,640 | 1,499 | 122 | 66 | 5 | 8 | 39 | 969 | 810 | 47 | 112 | 27 | 1 | 52 |
| District of Columbia | 193 | 154 | 127 | 27 | 0 | 0 | 0 | 0 | 0 | 36 | 28 | 2 | 6 | 0 | 0 | 3 |
| Maryland | 699 | 573 | 351 | 201 | 5 | 11 | 0 | 5 | 0 | 122 | 106 | 3 | 13 | 1 | 0 | 3 |
| Pennsylvania | 2,760 | 2,244 | 1,602 | 460 | 127 | 31 | 4 | 2 | 18 | 486 | 413 | 11 | 62 | 8 | 3 | 19 |
| Virginia | 587 | 481 | 377 | 102 | 1 | 1 | 0 | 0 | 0 | 101 | 91 | 1 | 9 | 0 | 0 | 5 |
| West Virginia | 817 | 739 | 461 | 179 | 59 | 4 | 2 | 0 | 34 | 75 | 71 | 2 | 2 | 2 | 1 | 0 |
| Region III | 5,056 | 4,191 | 2,918 | 969 | 192 | 47 | 6 | 7 | 52 | 820 | 709 | 19 | 92 | 11 | 4 | 30 |
| Alabama | 345 | 273 | 207 | 59 | 6 | 1 | 0 | 0 | 0 | 70 | 50 | 3 | 17 | 0 | 0 | 2 |
| Florida | 1,038 | 822 | 687 | 127 | 8 | 0 | 0 | 0 | 0 | 210 | 191 | 8 | 11 | 2 | 0 | 4 |
| Georgia | 518 | 428 | 309 | 114 | 2 | 1 | 1 | 0 | 1 | 88 | 70 | 5 | 13 | 0 | 0 | 2 |
| Kentucky | 721 | 633 | 491 | 113 | 17 | 0 | 5 | 1 | 6 | 79 | 65 | 2 | 12 | 2 | 0 | 7 |
| Mississippi | 281 | 246 | 214 | 30 | 2 | 0 | 0 | 0 | 0 | 32 | 26 | 1 | 5 | 0 | 1 | 2 |
| North Carolina | 423 | 370 | 301 | 68 | 1 | 0 | 0 | 0 | 0 | 52 | 42 | 2 | 8 | 0 | 0 | 1 |
| South Carolina | 153 | 122 | 108 | 14 | 0 | 0 | 0 | 0 | 0 | 30 | 20 | 2 | 8 | 0 | 0 | 1 |
| Tennessee | 753 | 651 | 536 | 111 | 3 | 1 | 0 | 0 | 0 | 96 | 72 | 4 | 20 | 0 | 0 | 6 |
| Region IV | 4,232 | 3,545 | 2,853 | 636 | 39 | 3 | 6 | 1 | 7 | 657 | 536 | 27 | 94 | 4 | 1 | 25 |
| Illinois | 2,504 | 1,990 | 1,270 | 523 | 131 | 31 | 1 | 2 | 32 | 481 | 383 | 30 | 68 | 9 | 0 | 24 |
| Indiana | 1,518 | 1,242 | 895 | 302 | 24 | 2 | 3 | 0 | 16 | 258 | 226 | 3 | 29 | 10 | 0 | 8 |
| Michigan | 2,561 | 2,101 | 1,527 | 489 | 62 | 19 | 0 | 1 | 4 | 420 | 314 | 17 | 89 | 12 | 0 | 28 |
| Minnesota | 591 | 417 | 273 | 75 | 52 | 2 | 1 | 0 | 14 | 159 | 115 | 11 | 33 | 1 | 1 | 13 |
| Ohio | 2,370 | 1,956 | 1,449 | 438 | 34 | 20 | 1 | 0 | 14 | 388 | 304 | 12 | 72 | 14 | 2 | 10 |
| Wisconsin | 1,081 | 826 | 611 | 176 | 20 | 8 | 1 | 5 | 5 | 214 | 183 | 6 | 25 | 9 | 6 | 26 |
| Region V | 10,625 | 8,532 | 6,025 | 2,003 | 323 | 82 | 7 | 7 | 85 | 1,920 | 1,525 | 79 | 316 | 55 | 9 | 109 |
| Arkansas | 184 | 146 | 112 | 34 | 0 | 0 | 0 | 0 | 0 | 38 | 28 | 3 | 7 | 0 | 0 | 0 |
| Louisiana | 327 | 267 | 208 | 58 | 0 | 0 | 0 | 0 | 1 | 60 | 40 | 2 | 18 | 0 | 0 | 0 |
| New Mexico | 185 | 126 | 89 | 37 | 0 | 0 | 0 | 0 | 0 | 59 | 47 | 0 | 12 | 0 | 0 | 0 |
| Oklahoma | 265 | 216 | 167 | 49 | 0 | 0 | 0 | 0 | 0 | 47 | 33 | 4 | 10 | 0 | 1 | 1 |
| Texas | 1,098 | 928 | 641 | 273 | 7 | 4 | 0 | 0 | 3 | 162 | 123 | 7 | 32 | 2 | 1 | 5 |
| Region VI | 2,059 | 1,683 | 1,217 | 451 | 7 | 4 | 0 | 0 | 4 | 366 | 271 | 16 | 79 | 2 | 2 | 6 |
| Iowa | 258 | 161 | 129 | 31 | 1 | 0 | 0 | 0 | 0 | 93 | 81 | 2 | 10 | 0 | 2 | 2 |
| Kansas | 322 | 213 | 168 | 43 | 0 | 1 | 0 | 0 | 1 | 109 | 99 | 1 | 9 | 0 | 0 | 0 |
| Missouri | 1,387 | 1,121 | 781 | 268 | 43 | 17 | 0 | 1 | 11 | 254 | 192 | 10 | 52 | 4 | 1 | 7 |
| Nebraska | 101 | 65 | 49 | 16 | 0 | 0 | 0 | 0 | 0 | 34 | 30 | 1 | 3 | 0 | 0 | 2 |
| Region VII | 2,068 | 1,560 | 1,127 | 358 | 44 | 18 | 0 | 1 | 12 | 490 | 402 | 14 | 74 | 4 | 3 | 11 |
| Colorado | 480 | 418 | 317 | 99 | 2 | 0 | 0 | 0 | 0 | 57 | 44 | 1 | 12 | 3 | 0 | 2 |
| Montana | 188 | 113 | 91 | 20 | 2 | 0 | 0 | 0 | 0 | 65 | 49 | 2 | 14 | 4 | 0 | 6 |
| North Dakota | 47 | 30 | 25 | 5 | 0 | 0 | 0 | 0 | 0 | 17 | 15 | 0 | 2 | 0 | 0 | 0 |
| South Dakota | 39 | 30 | 28 | 2 | 0 | 0 | 0 | 0 | 0 | 9 | 9 | 0 | 0 | 0 | 0 | 0 |
| Utah | 114 | 84 | 60 | 21 | 2 | 1 | 0 | 0 | 0 | 26 | 24 | 1 | 1 | 0 | 1 | 3 |
| Wyoming | 33 | 24 | 22 | 2 | 0 | 0 | 0 | 0 | 0 | 8 | 7 | 0 | 1 | 0 | 0 | 1 |
| Region VIII | 901 | 699 | 543 | 149 | 6 | 1 | 0 | 0 | 0 | 182 | 148 | 4 | 30 | 7 | 1 | 12 |
| Arizona | 376 | 298 | 192 | 102 | 2 | 0 | 0 | 0 | 2 | 74 | 63 | 3 | 8 | 0 | 0 | 4 |
| California | 4,988 | 4,049 | 2,748 | 1,083 | 116 | 47 | 8 | 2 | 45 | 889 | 641 | 75 | 173 | 19 | 0 | 31 |
| Hawaii | 293 | 210 | 148 | 49 | 7 | 2 | 1 | 0 | 3 | 80 | 63 | 1 | 16 | 0 | 1 | 2 |
| Guam | 0 | 0 | 0 | 0 | 0 | 0 | 0 | 0 | 0 | 0 | 0 | 0 | 0 | 0 | 0 | 0 |
| Nevada | 513 | 449 | 326 | 101 | 13 | 4 | 3 | 0 | 2 | 62 | 42 | 4 | 16 | 0 | 0 | 2 |
| Region IX | 6,170 | 5,006 | 3,414 | 1,335 | 138 | 53 | 12 | 2 | 52 | 1,105 | 809 | 83 | 213 | 19 | 1 | 39 |
| Alaska | 114 | 82 | 54 | 22 | 3 | 0 | 2 | 0 | 1 | 30 | 24 | 2 | 4 | 0 | 0 | 2 |
| Idaho | 96 | 73 | 57 | 15 | 1 | 0 | 0 | 0 | 0 | 23 | 19 | 0 | 4 | 0 | 0 | 0 |
| Oregon | 547 | 392 | 276 | 102 | 8 | 2 | 0 | 0 | 4 | 139 | 97 | 11 | 31 | 7 | 0 | 9 |
| Washington | 895 | 663 | 465 | 181 | 10 | 1 | 0 | 1 | 5 | 220 | 137 | 15 | 68 | 9 | 0 | 3 |
| Region X | 1,652 | 1,210 | 852 | 320 | 22 | 3 | 2 | 1 | 10 | 412 | 277 | 28 | 107 | 16 | 0 | 14 |
| Total, all States and areas | 41,507 | 33,833 | 24,075 | 8,157 | 965 | 297 | 44 | 30 | 265 | 7,173 | 5,678 | 327 | 1,168 | 152 | 23 | 326 |
- 1 See Glossary of terms for definitions.
- 2 The States are grouped according to the 10 Standard Federal Administrative Regions.
779 of 780 figures sit in a row or column sum that works out. 2 cells break a sum: 'Michigan', column 3: prints 2,101, columns 4 to 10 add to 2,102; 'Region V', column 9: prints 7, rows 'Illinois' to 'Wisconsin' add to 8.
Reader’s notes
p. 164. The crop ends in the middle of the fourth regional block: the last printed row is North Carolina, and the remaining states of that block, its "Region IV" subtotal line, all later regions, the grand total, and the footnote texts (markers 1 on the caption and 2 on the stub heading are printed, but their texts fall below the crop) are cut off. No footnote text appears on this image, so `footnotes` is empty. Column structure: 17 columns. The three rightmost columns carry a tall two-level heading ("Union deauthorization cases" over "UD", "Amendment of certification cases" over "AC", "Unit clarification cases" over "UC"); the stub and the columns "All cases" through "RD" are single tall headings repeated down all three heading levels. Arithmetic verification: every row and every regional subtotal reconciles exactly (e.g. Region III column totals and all six Region I state rows check out), so no misprints were detected in the transcribed area. Minor scan artifacts, transcribed as the intended characters: a stray leader dot sits immediately left of the "All cases" value 18 for Virgin Islands (not part of the number); the Massachusetts CG value and the New Jersey CE value print as a slab-serif "1" that resembles a lowercase l; the Delaware CE cell shows "0" followed by a speck of dirt, read as 0.
p. 165. Crop is a continuation page: it begins mid-table (the first two rows, South Carolina and Tennessee, are the tail of Region IV, whose earlier states are on the preceding page) and it is cut off at the bottom after Wyoming — the Region VIII total line and any further regions are not on this image. No footnote texts are printed on this crop, so `footnotes` is empty even though two markers appear: the superscript 1 on the caption (caption excluded per instructions) and the superscript 2 on the stub heading "Standard Federal Regions". Header structure: 17 columns. "Unfair labor practice cases" spans the 8 columns All C cases through CP; "Representation cases" spans All R cases through RD; the last three columns carry a two-part heading, the spelled-out name ("Union deauthorization cases", "Amendment of certification cases", "Unit clarification cases") above a rule, with the code (UD, AC, UC) below it, so those are given as a third heading level. "Standard Federal Regions^2" and "All cases" span all three levels. Doubtful cell: Michigan, CG column, transcribed as printed as 1. Two separate readings of the scan show a 1, but both cross-checks imply 0: Michigan's components 1,527+489+62+19+0+1+4 give 2,102 against the printed "All C cases" of 2,101, and the Region V CG column sums to 8 (2+0+1+0+0+5) against the printed Region V CG total of 7. Every other cell in the table reconciles exactly — each state's C components sum to its All C cases, each state's RC+RM+RD sum to All R cases, All C + All R + UD + AC + UC sum to All cases, and all four region total rows (IV is partial here, V, VI, VII) agree column by column with their member states. So either the source misprints the Michigan CG entry or the Region V CG total, or the glyph is a damaged 0; I have left it as the printed 1 and not adjusted the totals. Scan specks, not footnote markers and not transcribed: a small apostrophe-like mark just left of the 0 in the CP column on the New Mexico row, a similar mark above the 9 in the AC column on the Region V line, and a faint dot between the CE and CG columns on the South Dakota row. Row labels are given in standard spelling; the 1-bit scan renders several dotless i's (e.g. "Illinoıs", "Michıgan", "Wısconsin", "Regıon") which are typeface/scan artifacts, not variant spellings.
p. 166. 17 columns. The stub heading and the second footnote carry a superscript marker that the scan renders ambiguously (it could be read as 2, 3 or 8); since footnote 1 is the only other marker on the page, I transcribed it as 2 in both places, but the glyph itself is not crisp. This is a continuation page: the body opens with the "Region VIII" summary line whose constituent States appear on the preceding page, so no column headings were reconstructed beyond what is printed here (they are printed in full on this crop). "All cases", and the three right-hand headings "Union deauthorization cases", "Amendment of certification cases" and "Unit clarification cases", are tall headings spanning several heading levels and are repeated down the levels they span; the UD / AC / UC code line is printed only in the three right-hand columns. A faint stray speck sits just above the Region VIII value in the CC column; it is printer dirt, not a digit or a footnote marker, and I did not transcribe it. All arithmetic cross-checks pass as printed: each region line equals the sum of its States, "All C cases" equals CA+CB+CC+CD+CE+CG+CP, "All R cases" equals RC+RM+RD, "All cases" equals All C + All R + UD + AC + UC, and the "Total, all States and areas" line is consistent column by column with the three region subtotals on this page plus the regions carried over from the preceding page. Nothing was computed or corrected. Guam's row is printed as all zeros; those are printed zeros, not blanks.
Source image
Source data: U.S. NLRB Annual Reports (public domain). Reconstruction by NLRB Stats Archive. Read by claude-opus-5 (effort max, prompt extract_v1) from the 300-dpi scan; stitched by page. Updated October 2026.