NLRB Stats Archive › Annual Reports › FY1990 › Geographic Distribution of Cases Received, Fiscal Year 1990
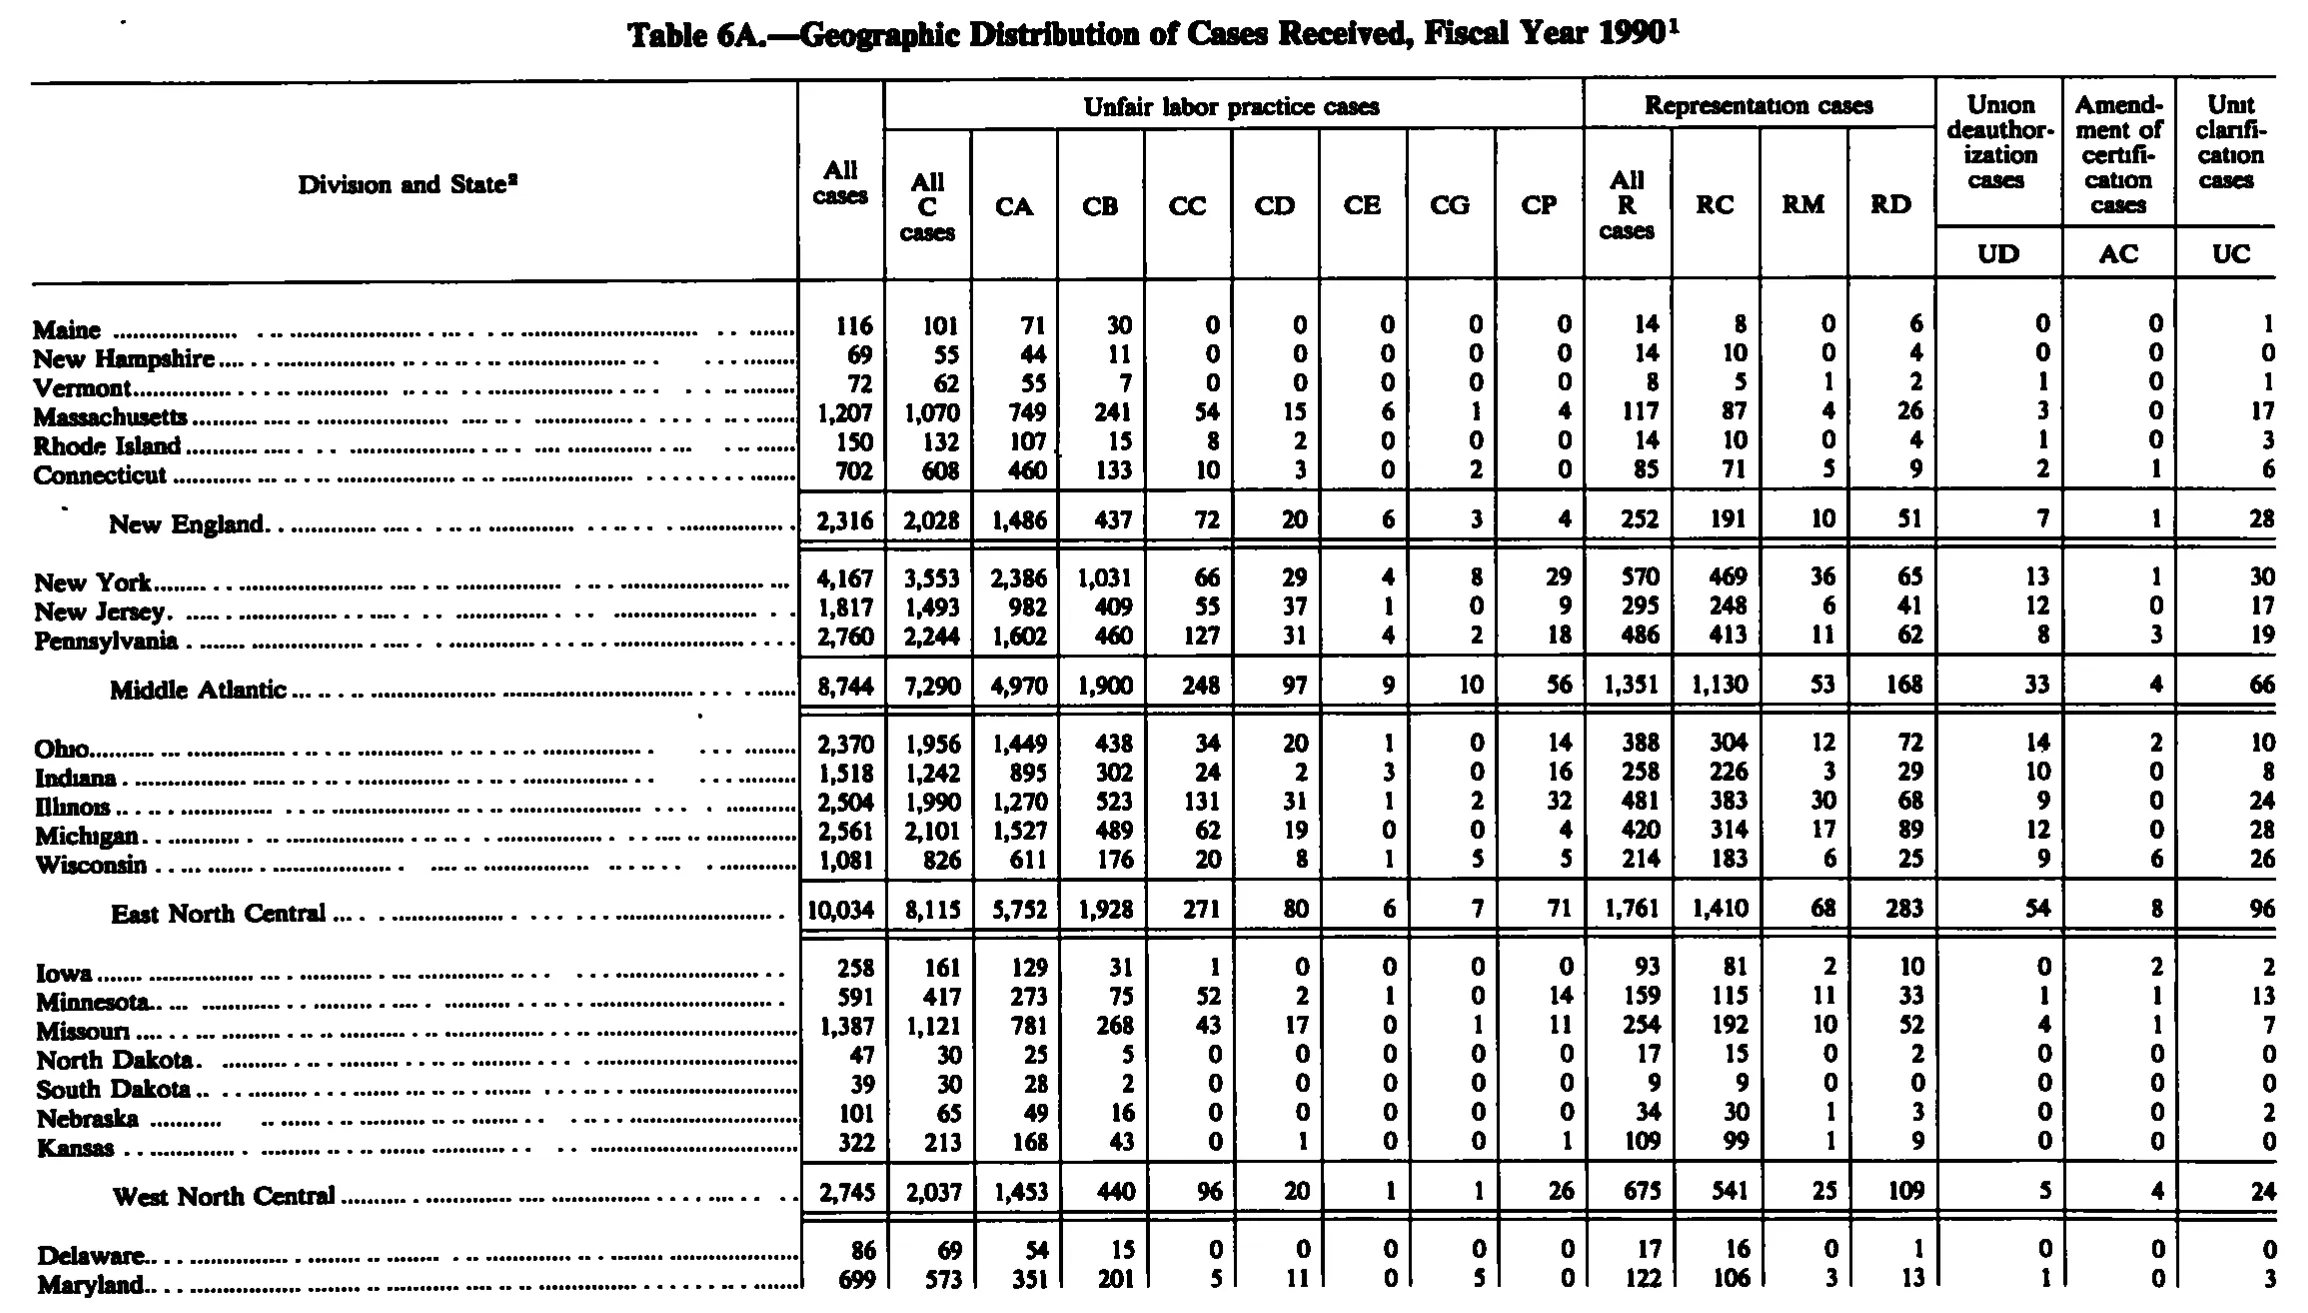
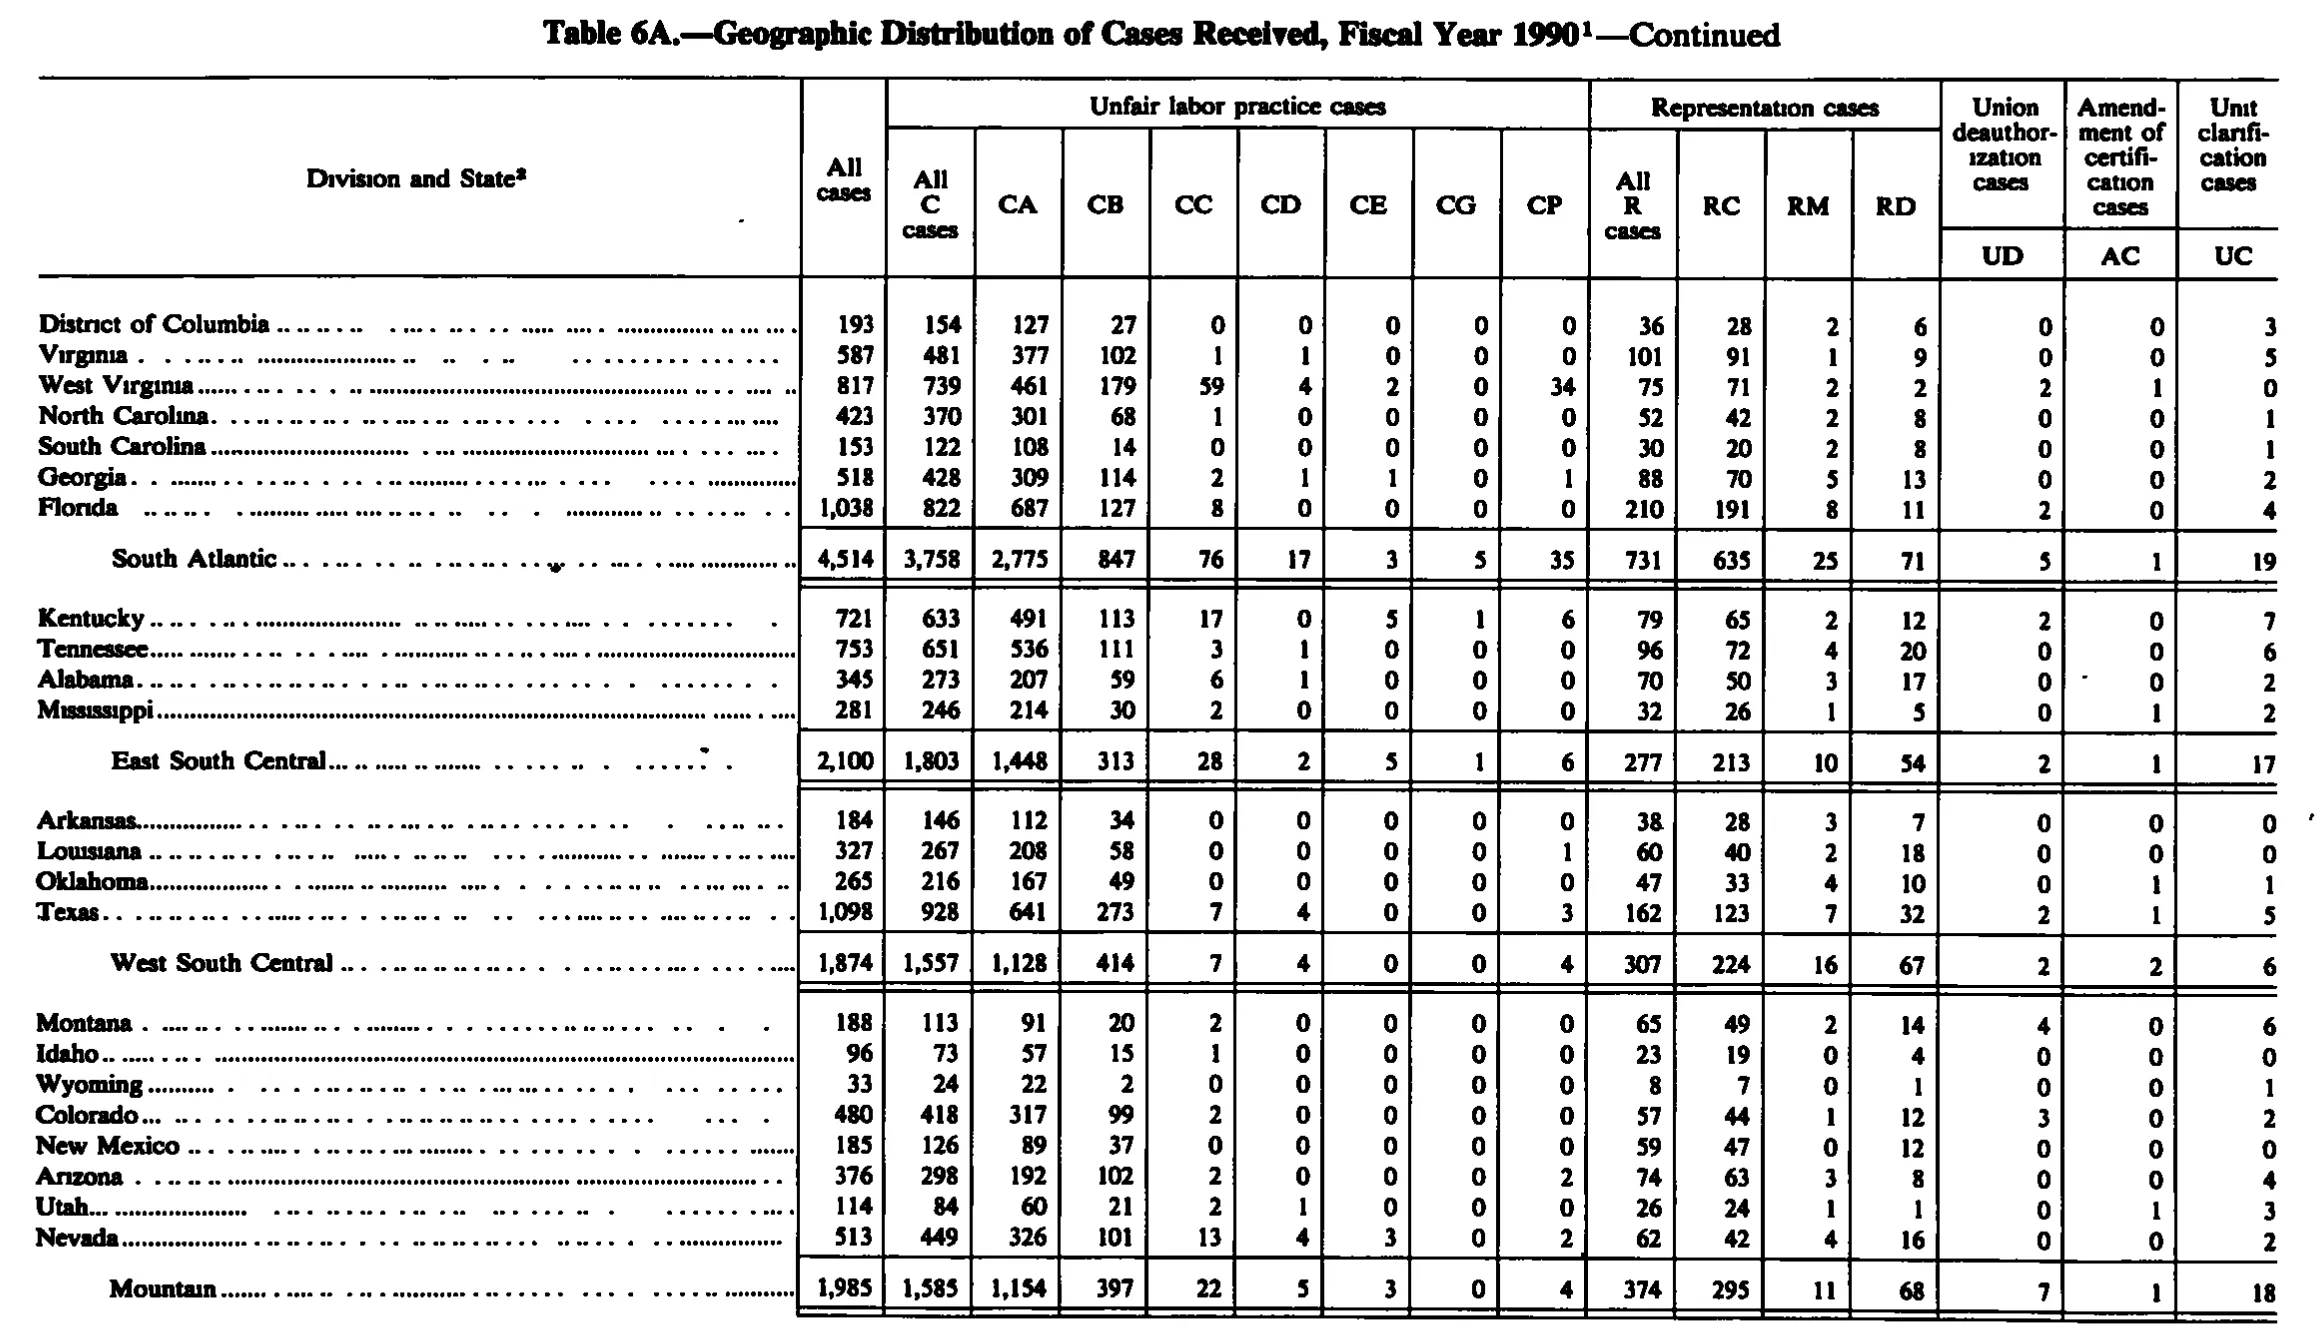
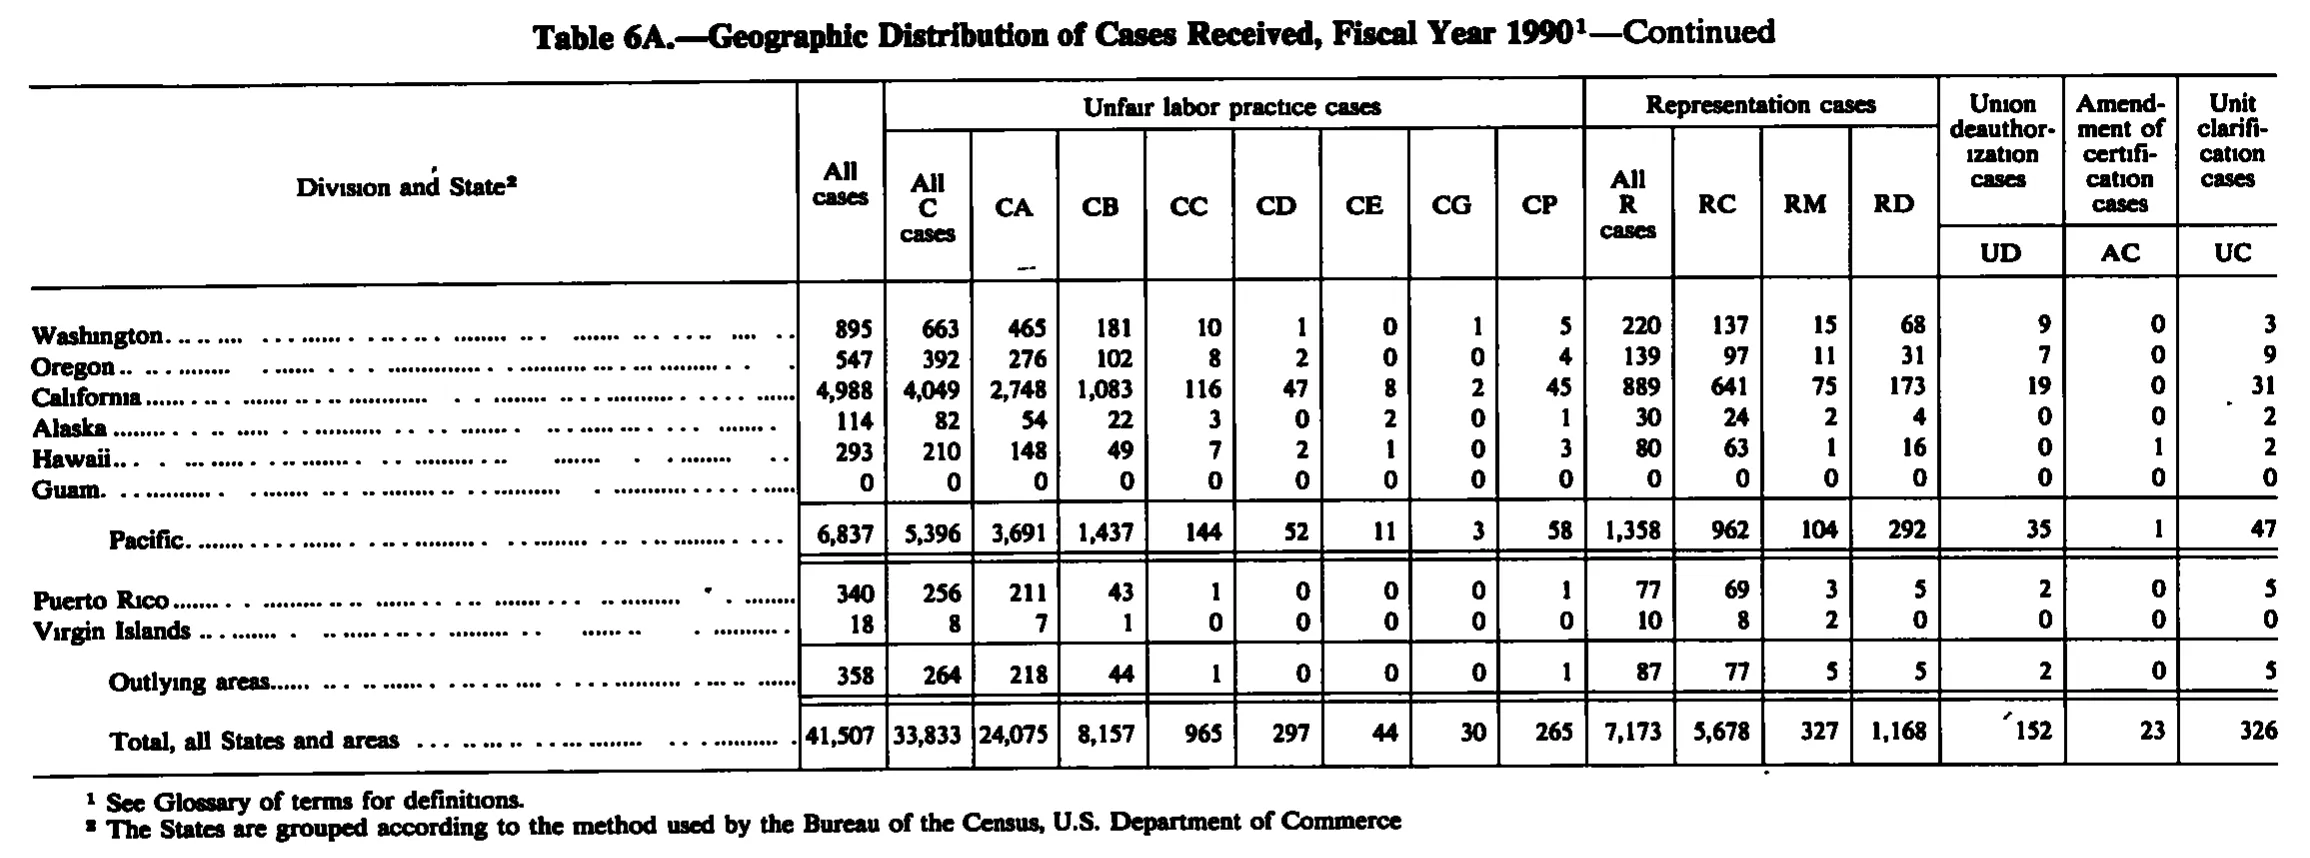
Geographic Distribution of Cases Received, Fiscal Year 1990
Stitched from pp. 161–163.
| Division and State | All cases | Unfair labor practice cases | Representation cases | Union deauthorization cases | Amendment of certification cases | Unit clarification cases | ||||||||||
|---|---|---|---|---|---|---|---|---|---|---|---|---|---|---|---|---|
| Division and State | All cases | All C cases | CA | CB | CC | CD | CE | CG | CP | All R cases | RC | RM | RD | Union deauthorization cases | Amendment of certification cases | Unit clarification cases |
| Division and State | All cases | All C cases | CA | CB | CC | CD | CE | CG | CP | All R cases | RC | RM | RD | UD | AC | UC |
| Maine | 116 | 101 | 71 | 30 | 0 | 0 | 0 | 0 | 0 | 14 | 8 | 0 | 6 | 0 | 0 | 1 |
| New Hampshire | 69 | 55 | 44 | 11 | 0 | 0 | 0 | 0 | 0 | 14 | 10 | 0 | 4 | 0 | 0 | 0 |
| Vermont | 72 | 62 | 55 | 7 | 0 | 0 | 0 | 0 | 0 | 8 | 5 | 1 | 2 | 1 | 0 | 1 |
| Massachusetts | 1,207 | 1,070 | 749 | 241 | 54 | 15 | 6 | 1 | 4 | 117 | 87 | 4 | 26 | 3 | 0 | 17 |
| Rhode Island | 150 | 132 | 107 | 15 | 8 | 2 | 0 | 0 | 0 | 14 | 10 | 0 | 4 | 1 | 0 | 3 |
| Connecticut | 702 | 608 | 460 | 133 | 10 | 3 | 0 | 2 | 0 | 85 | 71 | 5 | 9 | 2 | 1 | 6 |
| New England | 2,316 | 2,028 | 1,486 | 437 | 72 | 20 | 6 | 3 | 4 | 252 | 191 | 10 | 51 | 7 | 1 | 28 |
| New York | 4,167 | 3,553 | 2,386 | 1,031 | 66 | 29 | 4 | 8 | 29 | 570 | 469 | 36 | 65 | 13 | 1 | 30 |
| New Jersey | 1,817 | 1,493 | 982 | 409 | 55 | 37 | 1 | 0 | 9 | 295 | 248 | 6 | 41 | 12 | 0 | 17 |
| Pennsylvania | 2,760 | 2,244 | 1,602 | 460 | 127 | 31 | 4 | 2 | 18 | 486 | 413 | 11 | 62 | 8 | 3 | 19 |
| Middle Atlantic | 8,744 | 7,290 | 4,970 | 1,900 | 248 | 97 | 9 | 10 | 56 | 1,351 | 1,130 | 53 | 168 | 33 | 4 | 66 |
| Ohio | 2,370 | 1,956 | 1,449 | 438 | 34 | 20 | 1 | 0 | 14 | 388 | 304 | 12 | 72 | 14 | 2 | 10 |
| Indiana | 1,518 | 1,242 | 895 | 302 | 24 | 2 | 3 | 0 | 16 | 258 | 226 | 3 | 29 | 10 | 0 | 8 |
| Illinois | 2,504 | 1,990 | 1,270 | 523 | 131 | 31 | 1 | 2 | 32 | 481 | 383 | 30 | 68 | 9 | 0 | 24 |
| Michigan | 2,561 | 2,101 | 1,527 | 489 | 62 | 19 | 0 | 0 | 4 | 420 | 314 | 17 | 89 | 12 | 0 | 28 |
| Wisconsin | 1,081 | 826 | 611 | 176 | 20 | 8 | 1 | 5 | 5 | 214 | 183 | 6 | 25 | 9 | 6 | 26 |
| East North Central | 10,034 | 8,115 | 5,752 | 1,928 | 271 | 80 | 6 | 7 | 71 | 1,761 | 1,410 | 68 | 283 | 54 | 8 | 96 |
| Iowa | 258 | 161 | 129 | 31 | 1 | 0 | 0 | 0 | 0 | 93 | 81 | 2 | 10 | 0 | 2 | 2 |
| Minnesota | 591 | 417 | 273 | 75 | 52 | 2 | 1 | 0 | 14 | 159 | 115 | 11 | 33 | 1 | 1 | 13 |
| Missouri | 1,387 | 1,121 | 781 | 268 | 43 | 17 | 0 | 1 | 11 | 254 | 192 | 10 | 52 | 4 | 1 | 7 |
| North Dakota | 47 | 30 | 25 | 5 | 0 | 0 | 0 | 0 | 0 | 17 | 15 | 0 | 2 | 0 | 0 | 0 |
| South Dakota | 39 | 30 | 28 | 2 | 0 | 0 | 0 | 0 | 0 | 9 | 9 | 0 | 0 | 0 | 0 | 0 |
| Nebraska | 101 | 65 | 49 | 16 | 0 | 0 | 0 | 0 | 0 | 34 | 30 | 1 | 3 | 0 | 0 | 0 |
| Kansas | 322 | 213 | 168 | 43 | 0 | 1 | 0 | 0 | 1 | 109 | 99 | 1 | 9 | 0 | 0 | 0 |
| West North Central | 2,745 | 2,037 | 1,453 | 440 | 96 | 20 | 1 | 1 | 26 | 675 | 541 | 25 | 109 | 5 | 4 | 24 |
| Delaware | 86 | 69 | 54 | 15 | 0 | 0 | 0 | 0 | 0 | 17 | 16 | 0 | 1 | 0 | 0 | 0 |
| Maryland | 699 | 573 | 351 | 201 | 5 | 11 | 0 | 5 | 0 | 122 | 106 | 3 | 13 | 1 | 0 | 3 |
| District of Columbia | 193 | 154 | 127 | 27 | 0 | 0 | 0 | 0 | 0 | 36 | 28 | 2 | 6 | 0 | 0 | 3 |
| Virginia | 587 | 481 | 377 | 102 | 1 | 1 | 0 | 0 | 0 | 101 | 91 | 1 | 9 | 0 | 0 | 5 |
| West Virginia | 817 | 739 | 461 | 179 | 59 | 4 | 2 | 0 | 34 | 75 | 71 | 2 | 2 | 2 | 1 | 0 |
| North Carolina | 423 | 370 | 301 | 68 | 1 | 0 | 0 | 0 | 0 | 52 | 42 | 2 | 8 | 0 | 0 | 1 |
| South Carolina | 153 | 122 | 108 | 14 | 0 | 0 | 0 | 0 | 0 | 30 | 20 | 2 | 8 | 0 | 0 | 1 |
| Georgia | 518 | 428 | 309 | 114 | 2 | 1 | 1 | 0 | 1 | 88 | 70 | 5 | 13 | 0 | 0 | 2 |
| Florida | 1,038 | 822 | 687 | 127 | 8 | 0 | 0 | 0 | 0 | 210 | 191 | 8 | 11 | 2 | 0 | 4 |
| South Atlantic | 4,514 | 3,758 | 2,775 | 847 | 76 | 17 | 3 | 5 | 35 | 731 | 635 | 25 | 71 | 5 | 1 | 19 |
| Kentucky | 721 | 633 | 491 | 113 | 17 | 0 | 5 | 1 | 6 | 79 | 65 | 2 | 12 | 2 | 0 | 7 |
| Tennessee | 753 | 651 | 536 | 111 | 3 | 1 | 0 | 0 | 0 | 96 | 72 | 4 | 20 | 0 | 0 | 6 |
| Alabama | 345 | 273 | 207 | 59 | 6 | 1 | 0 | 0 | 0 | 70 | 50 | 3 | 17 | 0 | 0 | 2 |
| Mississippi | 281 | 246 | 214 | 30 | 2 | 0 | 0 | 0 | 0 | 32 | 26 | 1 | 5 | 0 | 1 | 2 |
| East South Central | 2,100 | 1,803 | 1,448 | 313 | 28 | 2 | 5 | 1 | 6 | 277 | 213 | 10 | 54 | 2 | 1 | 17 |
| Arkansas | 184 | 146 | 112 | 34 | 0 | 0 | 0 | 0 | 0 | 38 | 28 | 3 | 7 | 0 | 0 | 0 |
| Louisiana | 327 | 267 | 208 | 58 | 0 | 0 | 0 | 0 | 1 | 60 | 40 | 2 | 18 | 0 | 0 | 0 |
| Oklahoma | 265 | 216 | 167 | 49 | 0 | 0 | 0 | 0 | 0 | 47 | 33 | 4 | 10 | 0 | 1 | 1 |
| Texas | 1,098 | 928 | 641 | 273 | 7 | 4 | 0 | 0 | 3 | 162 | 123 | 7 | 32 | 2 | 1 | 5 |
| West South Central | 1,874 | 1,557 | 1,128 | 414 | 7 | 4 | 0 | 0 | 4 | 307 | 224 | 16 | 67 | 2 | 2 | 6 |
| Montana | 188 | 113 | 91 | 20 | 2 | 0 | 0 | 0 | 0 | 65 | 49 | 2 | 14 | 4 | 0 | 6 |
| Idaho | 96 | 73 | 57 | 15 | 1 | 0 | 0 | 0 | 0 | 23 | 19 | 0 | 4 | 0 | 0 | 0 |
| Wyoming | 33 | 24 | 22 | 2 | 0 | 0 | 0 | 0 | 0 | 8 | 7 | 0 | 1 | 0 | 0 | 1 |
| Colorado | 480 | 418 | 317 | 99 | 2 | 0 | 0 | 0 | 0 | 57 | 44 | 1 | 12 | 3 | 0 | 2 |
| New Mexico | 185 | 126 | 89 | 37 | 0 | 0 | 0 | 0 | 0 | 59 | 47 | 0 | 12 | 0 | 0 | 0 |
| Arizona | 376 | 298 | 192 | 102 | 2 | 0 | 0 | 0 | 2 | 74 | 63 | 3 | 8 | 0 | 0 | 4 |
| Utah | 114 | 84 | 60 | 21 | 2 | 1 | 0 | 0 | 0 | 26 | 24 | 1 | 1 | 0 | 1 | 3 |
| Nevada | 513 | 449 | 326 | 101 | 13 | 4 | 3 | 0 | 2 | 62 | 42 | 4 | 16 | 0 | 0 | 2 |
| Mountain | 1,985 | 1,585 | 1,154 | 397 | 22 | 5 | 3 | 0 | 4 | 374 | 295 | 11 | 68 | 7 | 1 | 18 |
| Washington | 895 | 663 | 465 | 181 | 10 | 1 | 0 | 1 | 5 | 220 | 137 | 15 | 68 | 9 | 0 | 3 |
| Oregon | 547 | 392 | 276 | 102 | 8 | 2 | 0 | 0 | 4 | 139 | 97 | 11 | 31 | 7 | 0 | 9 |
| California | 4,988 | 4,049 | 2,748 | 1,083 | 116 | 47 | 8 | 2 | 45 | 889 | 641 | 75 | 173 | 19 | 0 | 31 |
| Alaska | 114 | 82 | 54 | 22 | 3 | 0 | 2 | 0 | 1 | 30 | 24 | 2 | 4 | 0 | 0 | 2 |
| Hawaii | 293 | 210 | 148 | 49 | 7 | 2 | 1 | 0 | 3 | 80 | 63 | 1 | 16 | 0 | 1 | 2 |
| Guam | 0 | 0 | 0 | 0 | 0 | 0 | 0 | 0 | 0 | 0 | 0 | 0 | 0 | 0 | 0 | 0 |
| Pacific | 6,837 | 5,396 | 3,691 | 1,437 | 144 | 52 | 11 | 3 | 58 | 1,358 | 962 | 104 | 292 | 35 | 1 | 47 |
| Puerto Rico | 340 | 256 | 211 | 43 | 1 | 0 | 0 | 0 | 1 | 77 | 69 | 3 | 5 | 2 | 0 | 5 |
| Virgin Islands | 18 | 8 | 7 | 1 | 0 | 0 | 0 | 0 | 0 | 10 | 8 | 2 | 0 | 0 | 0 | 0 |
| Outlying areas | 358 | 264 | 218 | 44 | 1 | 0 | 0 | 0 | 1 | 87 | 77 | 5 | 5 | 2 | 0 | 5 |
| Total, all States and areas | 41,507 | 33,833 | 24,075 | 8,157 | 965 | 297 | 44 | 30 | 265 | 7,173 | 5,678 | 327 | 1,168 | 152 | 23 | 326 |
- 1 See Glossary of terms for definitions.
- 2 The States are grouped according to the method used by the Bureau of the Census, U.S. Department of Commerce
778 of 778 figures sit in a row or column sum that works out. 2 cells break a sum: 'Nebraska', column 2: prints 101, the subtotals in columns 3 to 17 add to 99; 'West North Central', column 17: prints 24, rows 'Iowa' to 'Kansas' add to 22.
Reader’s notes
p. 161. 17 columns: stub, "All cases", 8 unfair-labor-practice columns (All C cases, CA, CB, CC, CD, CE, CG, CP), 4 representation columns (All R cases, RC, RM, RD), and UD, AC, UC. The stub heading carries a raised "2" ("Division and State^2"); the caption's footnote marker and any footnotes are outside this crop, so `footnotes` is empty. The crop is cut off at the bottom: the table continues past the Maryland row (the South Atlantic division and the remaining divisions are on the rest of the page/next page), and the Delaware/Maryland rows are the start of an unlabeled division block whose subtotal is not shown. Doubtful cell: Nebraska, UC column. It reads as a printed 0, and that is what is transcribed, but two arithmetic checks suggest the printed digit may be 2: (a) Nebraska's components sum to 99 (65 C + 34 R + 0 UD + 0 AC + 0 UC) against a printed "All cases" of 101; (b) the UC column for the seven West North Central states sums to 22 against the printed division total of 24. Every other row and every other division subtotal on this crop adds up exactly, so this single cell is the only inconsistency. Division subtotal rows (New England, Middle Atlantic, East North Central, West North Central) are transcribed in place as ordinary rows with their values.
p. 162. This is a continuation page of Table 6A; the table runs on from the previous page and continues past the bottom of the crop (the Mountain division subtotal is the last printed row, and the body is cut off below it). No footnote texts are printed on this crop, so `footnotes` is empty, even though footnote markers 1 (in the excluded caption) and 2 (on the stub heading "Division and State") appear. The "South Atlantic" subtotal does not equal the sum of the seven states shown here (e.g. All cases 4,514 vs. 3,729 for DC through Florida; All C cases 3,758 vs. 3,116). This is expected rather than a misprint: the South Atlantic division also includes Delaware and Maryland, which are printed on the preceding page. Every other subtotal on this crop (East South Central, West South Central, Mountain) adds up exactly across all 16 numeric columns, and each state's row is internally consistent (CA+CB+CC+CD+CE+CG+CP = All C; All C + All R + UD + AC + UC = All cases). Header structure: three heading levels. The spanner level carries "Unfair labor practice cases" over the eight C columns and "Representation cases" over the four R columns; the stub, "All cases", and the three right-hand headings are tall and repeated down the levels, with the two-letter codes UD, AC and UC printed on the bottom level only. The left-hand C and R column headings ("All C cases", "CA" ... "RD") occupy the middle level and are repeated into the bottom level because they span it. Print quality is good and all digits are legible; the dotted leaders after state names and the stray leader marks in the stub column (e.g. after "East South Central") were dropped.
p. 163. 17 columns: stub plus 16 numeric columns. The three heading levels are: a top band ("Unfair labor practice cases" over All C cases/CA/CB/CC/CD/CE/CG/CP; "Representation cases" over All R cases/RC/RM/RD; and the tall headings "Union deauthorization cases", "Amendment of certification cases", "Unit clarification cases"), a middle level with the code headings, and a bottom level holding only UD/AC/UC; "Division and State" and "All cases" are tall headings repeated in all three levels. This crop is the final page of Table 6A, continued from the preceding pages; it begins mid-table with the Pacific division states and ends with the grand total. Scan artifacts, none affecting the reading: a small stray dash under the "CA" heading in the header band; a stray apostrophe-like speck immediately left of "152" in the UD column of the "Total, all States and areas" row (the value is 152); a speck between the "California" and "Alaska" rows in the UC column; and a stray dot below the table near the RM column. All printed figures are internally consistent: each state row's components sum to its "All cases" value, and the Pacific, Outlying areas and grand-total rows agree with their constituent rows in every column. No apparent misprints.
Source image
Source data: U.S. NLRB Annual Reports (public domain). Reconstruction by NLRB Stats Archive. Read by claude-opus-5 (effort max, prompt extract_v1) from the 300-dpi scan; stitched by page. Updated October 2026.