NLRB Stats Archive › Annual Reports › FY1989 › Proceedings Decided by Circuit Courts of Appeals on Petitions for Enforcement and/or Review of Board Orders, Fiscal Year 1989, Compared With 5-Year Cumulative Totals, Fiscal Years 1984 Through 1988
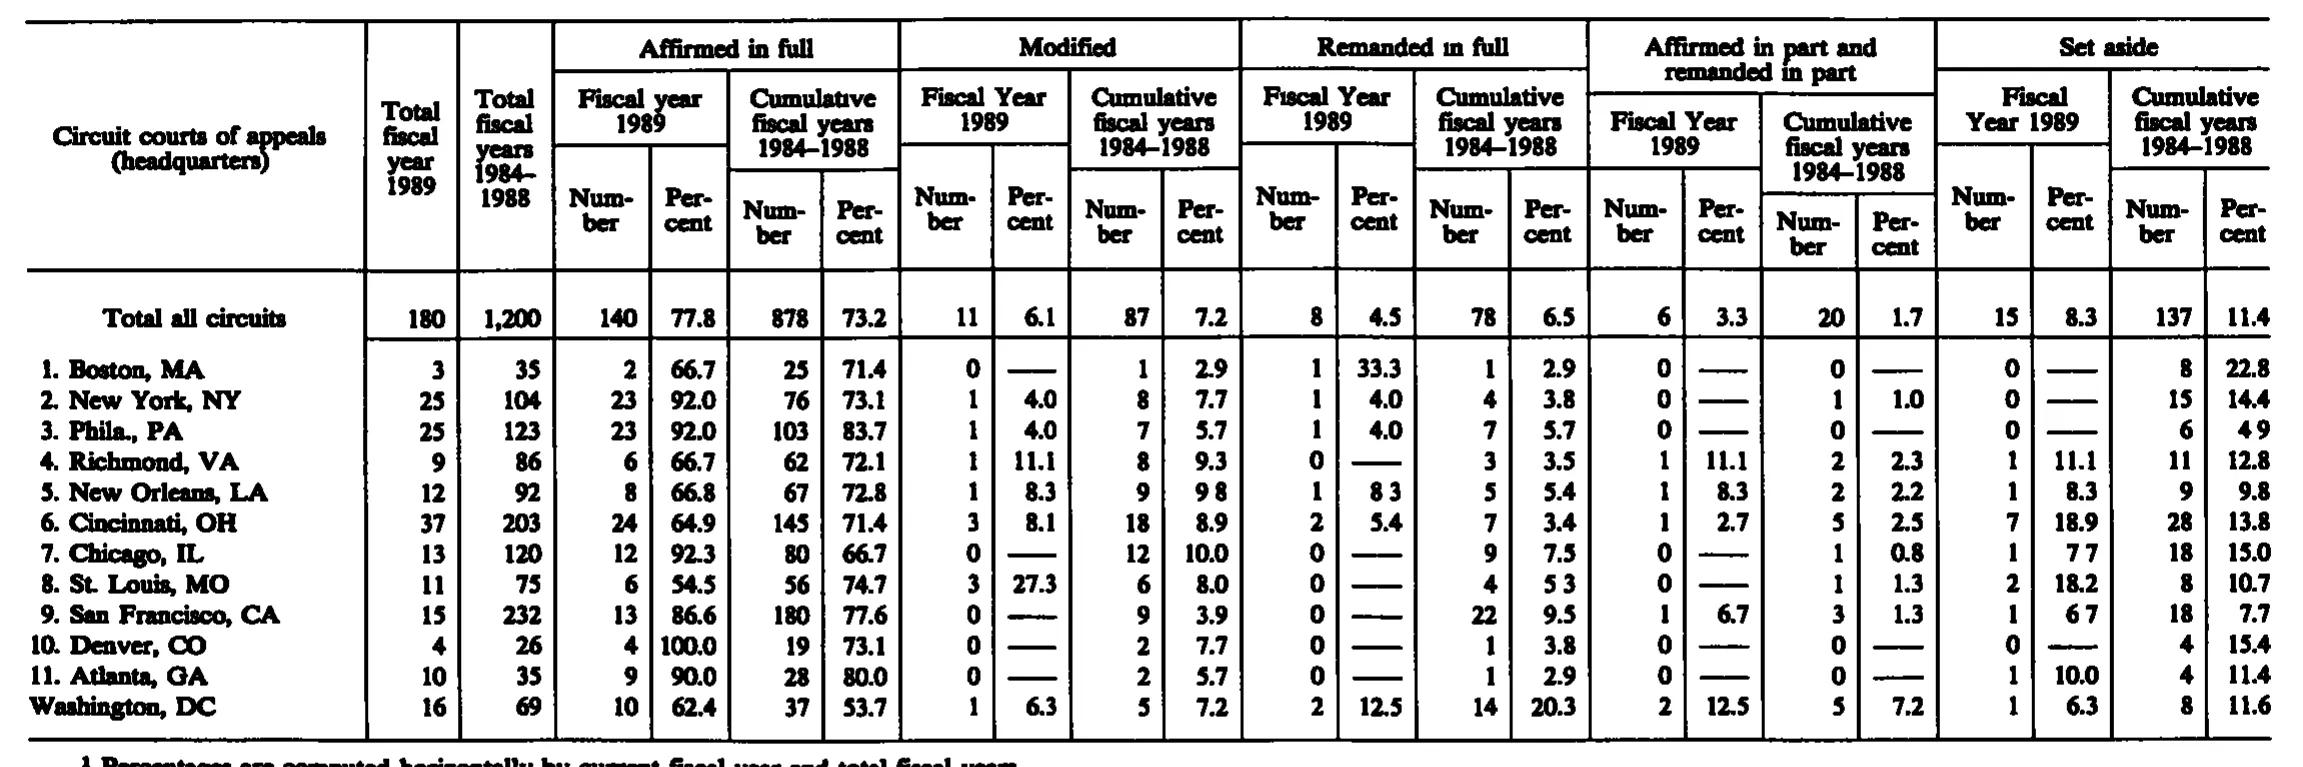
Proceedings Decided by Circuit Courts of Appeals on Petitions for Enforcement and/or Review of Board Orders, Fiscal Year 1989, Compared With 5-Year Cumulative Totals, Fiscal Years 1984 Through 1988
| Circuit courts of appeals (headquarters) | Total fiscal year 1989 | Total fiscal years 1984-1988 | Affirmed in full | Modified | Remanded in full | Affirmed in part and remanded in part | Set aside | |||||||||||||||
|---|---|---|---|---|---|---|---|---|---|---|---|---|---|---|---|---|---|---|---|---|---|---|
| Circuit courts of appeals (headquarters) | Total fiscal year 1989 | Total fiscal years 1984-1988 | Fiscal year 1989 | Cumulative fiscal years 1984-1988 | Fiscal Year 1989 | Cumulative fiscal years 1984-1988 | Fiscal Year 1989 | Cumulative fiscal years 1984-1988 | Fiscal Year 1989 | Cumulative fiscal years 1984-1988 | Fiscal Year 1989 | Cumulative fiscal years 1984-1988 | ||||||||||
| Circuit courts of appeals (headquarters) | Total fiscal year 1989 | Total fiscal years 1984-1988 | Number | Percent | Number | Percent | Number | Percent | Number | Percent | Number | Percent | Number | Percent | Number | Percent | Number | Percent | Number | Percent | Number | Percent |
| Total all circuits | 180 | 1,200 | 140 | 77.8 | 878 | 73.2 | 11 | 6.1 | 87 | 7.2 | 8 | 4.5 | 78 | 6.5 | 6 | 3.3 | 20 | 1.7 | 15 | 8.3 | 137 | 11.4 |
| 1. Boston, MA | 3 | 35 | 2 | 66.7 | 25 | 71.4 | 0 | 1 | 2.9 | 1 | 33.3 | 1 | 2.9 | 0 | 0 | 0 | 8 | 22.8 | ||||
| 2. New York, NY | 25 | 104 | 23 | 92.0 | 76 | 73.1 | 1 | 4.0 | 8 | 7.7 | 1 | 4.0 | 4 | 3.8 | 0 | 1 | 1.0 | 0 | 15 | 14.4 | ||
| 3. Phila., PA | 25 | 123 | 23 | 92.0 | 103 | 83.7 | 1 | 4.0 | 7 | 5.7 | 1 | 4.0 | 7 | 5.7 | 0 | 0 | 0 | 6 | 4.9 | |||
| 4. Richmond, VA | 9 | 86 | 6 | 66.7 | 62 | 72.1 | 1 | 11.1 | 8 | 9.3 | 0 | 3 | 3.5 | 1 | 11.1 | 2 | 2.3 | 1 | 11.1 | 11 | 12.8 | |
| 5. New Orleans, LA | 12 | 92 | 8 | 66.8 | 67 | 72.8 | 1 | 8.3 | 9 | 9.8 | 1 | 8.3 | 5 | 5.4 | 1 | 8.3 | 2 | 2.2 | 1 | 8.3 | 9 | 9.8 |
| 6. Cincinnati, OH | 37 | 203 | 24 | 64.9 | 145 | 71.4 | 3 | 8.1 | 18 | 8.9 | 2 | 5.4 | 7 | 3.4 | 1 | 2.7 | 5 | 2.5 | 7 | 18.9 | 28 | 13.8 |
| 7. Chicago, IL | 13 | 120 | 12 | 92.3 | 80 | 66.7 | 0 | 12 | 10.0 | 0 | 9 | 7.5 | 0 | 1 | 0.8 | 1 | 7.7 | 18 | 15.0 | |||
| 8. St. Louis, MO | 11 | 75 | 6 | 54.5 | 56 | 74.7 | 3 | 27.3 | 6 | 8.0 | 0 | 4 | 5.3 | 0 | 1 | 1.3 | 2 | 18.2 | 8 | 10.7 | ||
| 9. San Francisco, CA | 15 | 232 | 13 | 86.6 | 180 | 77.6 | 0 | 9 | 3.9 | 0 | 22 | 9.5 | 1 | 6.7 | 3 | 1.3 | 1 | 6.7 | 18 | 7.7 | ||
| 10. Denver, CO | 4 | 26 | 4 | 100.0 | 19 | 73.1 | 0 | 2 | 7.7 | 0 | 1 | 3.8 | 0 | 0 | 0 | 4 | 15.4 | |||||
| 11. Atlanta, GA | 10 | 35 | 9 | 90.0 | 28 | 80.0 | 0 | 2 | 5.7 | 0 | 1 | 2.9 | 0 | 0 | 1 | 10.0 | 4 | 11.4 | ||||
| Washington, DC | 16 | 69 | 10 | 62.4 | 37 | 53.7 | 1 | 6.3 | 5 | 7.2 | 2 | 12.5 | 14 | 20.3 | 2 | 12.5 | 5 | 7.2 | 1 | 6.3 | 8 | 11.6 |
- 1 Percentages are computed horizontally by current fiscal year and total fiscal years.
130 of 130 figures sit in a row or column sum that works out.
Reader’s notes
p. 257. 23 columns: stub, two "Total" columns, then five outcome blocks (Affirmed in full; Modified; Remanded in full; Affirmed in part and remanded in part; Set aside), each with a fiscal year 1989 Number/Percent pair and a cumulative fiscal years 1984-1988 Number/Percent pair. Many percent cells are printed as an em-dash rule (meaning none); per instruction these are transcribed as "". The footnote line is clipped by the bottom edge of the crop — only the upper half of the letters is visible, so its wording is reconstructed from the visible letter tops and should be checked against the page; its reference marker (superscript 1) is not visible anywhere inside the crop, so it presumably sits in the caption, which is outside the crop. All counts cross-foot exactly (each circuit column sums to the "Total all circuits" row; the five fiscal-1989 outcome counts sum to 180 and the five cumulative counts to 1,200), which gives high confidence in the integer cells and their column placement. Doubtful percent cells, transcribed exactly as read but inconsistent with the printed counts (scan is 1-bit and the final digit is where the ambiguity lies): "5. New Orleans, LA" / Affirmed in full Fiscal year 1989 Percent reads 66.8 though 8 of 12 is 66.7; "9. San Francisco, CA" / Affirmed in full Fiscal year 1989 Percent reads 86.6 though 13 of 15 is 86.7; "Washington, DC" / Affirmed in full Fiscal year 1989 Percent reads 62.4 though 10 of 16 is 62.5; "Washington, DC" / Affirmed in full Cumulative Percent reads 53.7 though 37 of 69 is 53.6; "1. Boston, MA" / Set aside Cumulative Percent reads 22.8 though 8 of 35 is 22.9; "Total all circuits" / Remanded in full Fiscal Year 1989 Percent reads 4.5 though 8 of 180 is 4.4. Several of these percent values are printed with a faint or broken decimal point (e.g. "4 9" for Phila. Set aside cumulative, "9 8" and "8 3" in the New Orleans row, "7 7" in Chicago, "5 3" in St. Louis, "6 7" in San Francisco); the decimal point has been restored in each. Heading capitalisation is kept as printed: "Fiscal year 1989" (lowercase y) under "Affirmed in full", but "Fiscal Year 1989" under the other four blocks. The scan renders "Remanded in full" with a dotless i; it is transcribed as "in". Year ranges are printed with an en dash and are written here with a plain hyphen. The last row is printed without a circuit number (the D.C. Circuit).
Source image
Source data: U.S. NLRB Annual Reports (public domain). Reconstruction by NLRB Stats Archive. Read by claude-opus-5 (effort max, prompt extract_v1) from the 300-dpi scan; stitched by page. Updated October 2026.