NLRB Stats Archive › Annual Reports › FY1989 › Distribution of Unfair Labor Practice Situations Received, by Number of Employees in Establishments, Fiscal Year 1989
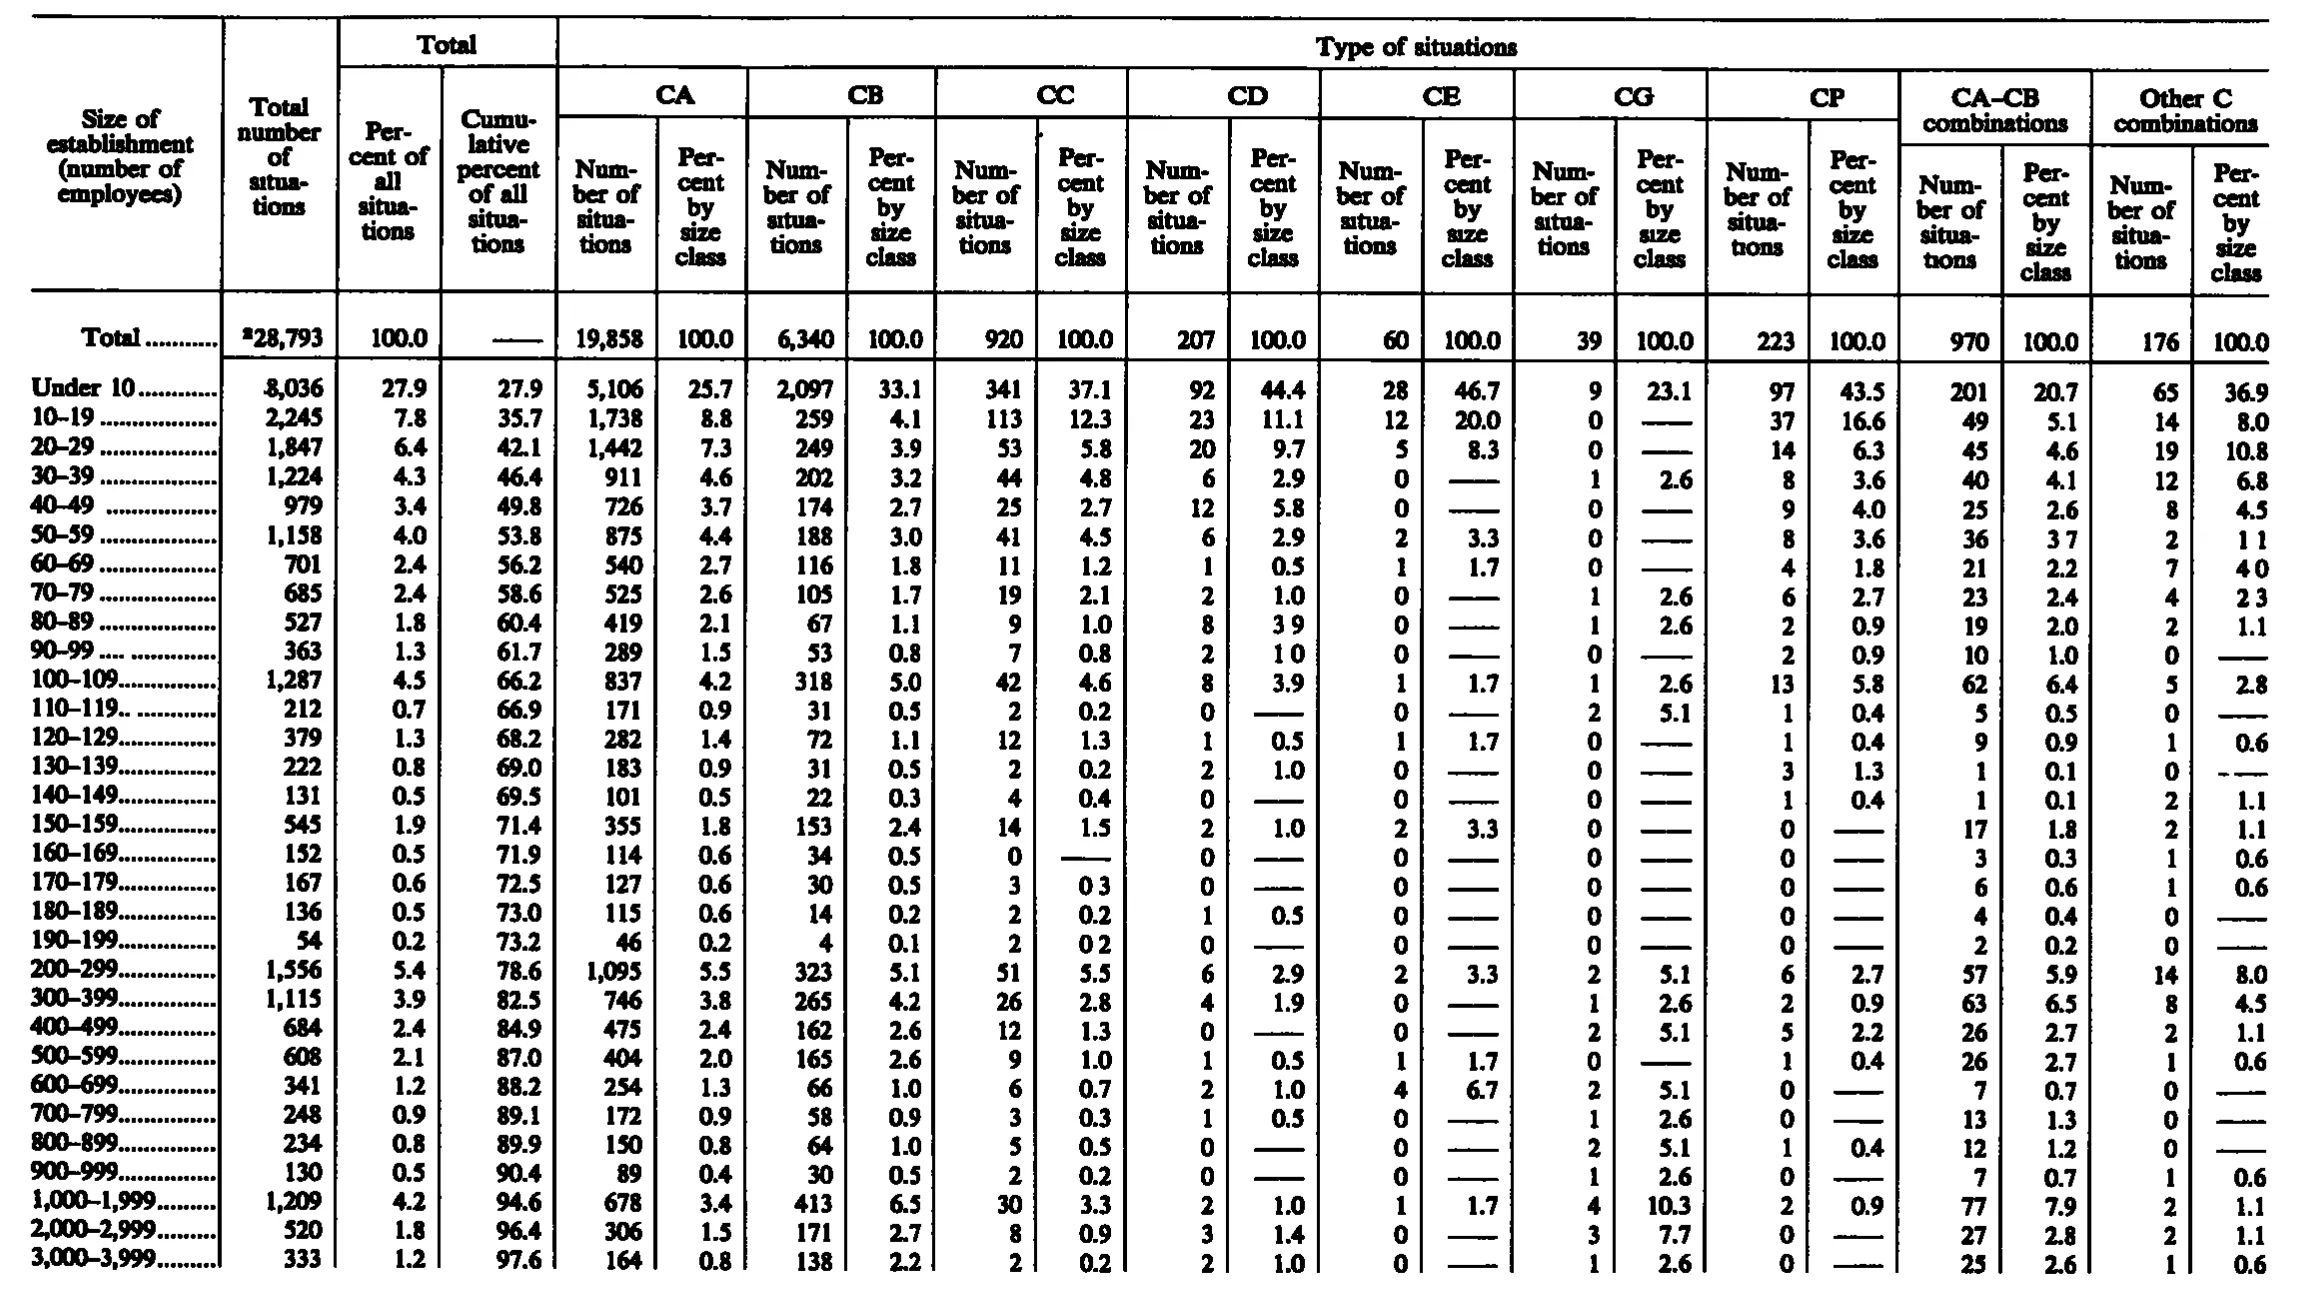
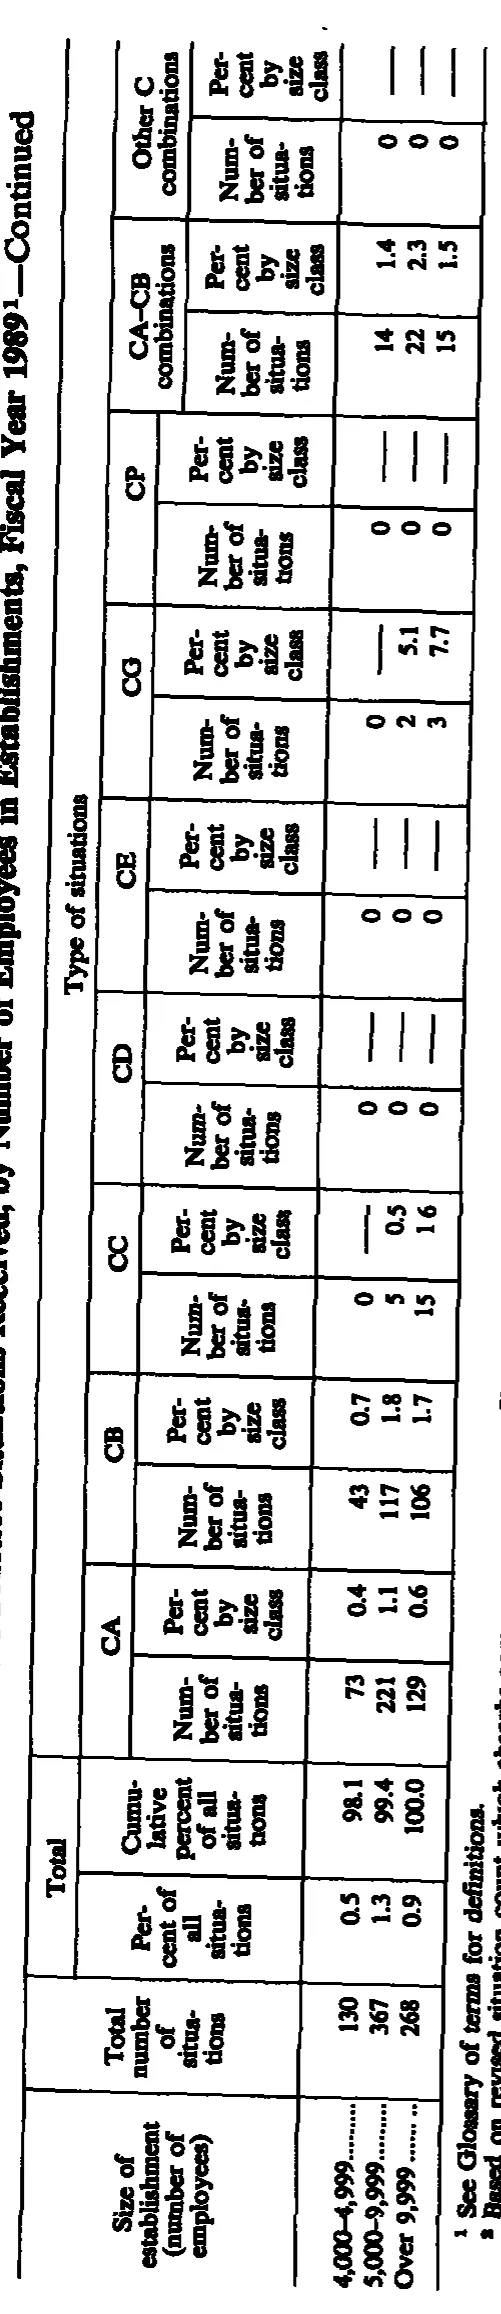
Distribution of Unfair Labor Practice Situations Received, by Number of Employees in Establishments, Fiscal Year 1989
Stitched from pp. 254–255.
| Size of establishment (number of employees) | Total number of situations | Total | Type of situations | ||||||||||||||||||
|---|---|---|---|---|---|---|---|---|---|---|---|---|---|---|---|---|---|---|---|---|---|
| Size of establishment (number of employees) | Total number of situations | Percent of all situations | Cumulative percent of all situations | CA | CB | CC | CD | CE | CG | CP | CA–CB combinations | Other C combinations | |||||||||
| Size of establishment (number of employees) | Total number of situations | Percent of all situations | Cumulative percent of all situations | Number of situations | Percent by size class | Number of situations | Percent by size class | Number of situations | Percent by size class | Number of situations | Percent by size class | Number of situations | Percent by size class | Number of situations | Percent by size class | Number of situations | Percent by size class | Number of situations | Percent by size class | Number of situations | Percent by size class |
| Total | 28,793 | 100.0 | 19,858 | 100.0 | 6,340 | 100.0 | 920 | 100.0 | 207 | 100.0 | 60 | 100.0 | 39 | 100.0 | 223 | 100.0 | 970 | 100.0 | 176 | 100.0 | |
| Under 10 | 8,036 | 27.9 | 27.9 | 5,106 | 25.7 | 2,097 | 33.1 | 341 | 37.1 | 92 | 44.4 | 28 | 46.7 | 9 | 23.1 | 97 | 43.5 | 201 | 20.7 | 65 | 36.9 |
| 10–19 | 2,245 | 7.8 | 35.7 | 1,738 | 8.8 | 259 | 4.1 | 113 | 12.3 | 23 | 11.1 | 12 | 20.0 | 0 | 37 | 16.6 | 49 | 5.1 | 14 | 8.0 | |
| 20–29 | 1,847 | 6.4 | 42.1 | 1,442 | 7.3 | 249 | 3.9 | 53 | 5.8 | 20 | 9.7 | 5 | 8.3 | 0 | 14 | 6.3 | 45 | 4.6 | 19 | 10.8 | |
| 30–39 | 1,224 | 4.3 | 46.4 | 911 | 4.6 | 202 | 3.2 | 44 | 4.8 | 6 | 2.9 | 0 | 1 | 2.6 | 8 | 3.6 | 40 | 4.1 | 12 | 6.8 | |
| 40–49 | 979 | 3.4 | 49.8 | 726 | 3.7 | 174 | 2.7 | 25 | 2.7 | 12 | 5.8 | 0 | 0 | 9 | 4.0 | 25 | 2.6 | 8 | 4.5 | ||
| 50–59 | 1,158 | 4.0 | 53.8 | 875 | 4.4 | 188 | 3.0 | 41 | 4.5 | 6 | 2.9 | 2 | 3.3 | 0 | 8 | 3.6 | 36 | 3.7 | 2 | 1.1 | |
| 60–69 | 701 | 2.4 | 56.2 | 540 | 2.7 | 116 | 1.8 | 11 | 1.2 | 1 | 0.5 | 1 | 1.7 | 0 | 4 | 1.8 | 21 | 2.2 | 7 | 4.0 | |
| 70–79 | 685 | 2.4 | 58.6 | 525 | 2.6 | 105 | 1.7 | 19 | 2.1 | 2 | 1.0 | 0 | 1 | 2.6 | 6 | 2.7 | 23 | 2.4 | 4 | 2.3 | |
| 80–89 | 527 | 1.8 | 60.4 | 419 | 2.1 | 67 | 1.1 | 9 | 1.0 | 8 | 3.9 | 0 | 1 | 2.6 | 2 | 0.9 | 19 | 2.0 | 2 | 1.1 | |
| 90–99 | 363 | 1.3 | 61.7 | 289 | 1.5 | 53 | 0.8 | 7 | 0.8 | 2 | 1.0 | 0 | 0 | 2 | 0.9 | 10 | 1.0 | 0 | |||
| 100–109 | 1,287 | 4.5 | 66.2 | 837 | 4.2 | 318 | 5.0 | 42 | 4.6 | 8 | 3.9 | 1 | 1.7 | 1 | 2.6 | 13 | 5.8 | 62 | 6.4 | 5 | 2.8 |
| 110–119 | 212 | 0.7 | 66.9 | 171 | 0.9 | 31 | 0.5 | 2 | 0.2 | 0 | 0 | 2 | 5.1 | 1 | 0.4 | 5 | 0.5 | 0 | |||
| 120–129 | 379 | 1.3 | 68.2 | 282 | 1.4 | 72 | 1.1 | 12 | 1.3 | 1 | 0.5 | 1 | 1.7 | 0 | 1 | 0.4 | 9 | 0.9 | 1 | 0.6 | |
| 130–139 | 222 | 0.8 | 69.0 | 183 | 0.9 | 31 | 0.5 | 2 | 0.2 | 2 | 1.0 | 0 | 0 | 3 | 1.3 | 1 | 0.1 | 0 | |||
| 140–149 | 131 | 0.5 | 69.5 | 101 | 0.5 | 22 | 0.3 | 4 | 0.4 | 0 | 0 | 0 | 1 | 0.4 | 1 | 0.1 | 2 | 1.1 | |||
| 150–159 | 545 | 1.9 | 71.4 | 355 | 1.8 | 153 | 2.4 | 14 | 1.5 | 2 | 1.0 | 2 | 3.3 | 0 | 0 | 17 | 1.8 | 2 | 1.1 | ||
| 160–169 | 152 | 0.5 | 71.9 | 114 | 0.6 | 34 | 0.5 | 0 | 0 | 0 | 0 | 0 | 3 | 0.3 | 1 | 0.6 | |||||
| 170–179 | 167 | 0.6 | 72.5 | 127 | 0.6 | 30 | 0.5 | 3 | 0.3 | 0 | 0 | 0 | 0 | 6 | 0.6 | 1 | 0.6 | ||||
| 180–189 | 136 | 0.5 | 73.0 | 115 | 0.6 | 14 | 0.2 | 2 | 0.2 | 1 | 0.5 | 0 | 0 | 0 | 4 | 0.4 | 0 | ||||
| 190–199 | 54 | 0.2 | 73.2 | 46 | 0.2 | 4 | 0.1 | 2 | 0.2 | 0 | 0 | 0 | 0 | 2 | 0.2 | 0 | |||||
| 200–299 | 1,556 | 5.4 | 78.6 | 1,095 | 5.5 | 323 | 5.1 | 51 | 5.5 | 6 | 2.9 | 2 | 3.3 | 2 | 5.1 | 6 | 2.7 | 57 | 5.9 | 14 | 8.0 |
| 300–399 | 1,115 | 3.9 | 82.5 | 746 | 3.8 | 265 | 4.2 | 26 | 2.8 | 4 | 1.9 | 0 | 1 | 2.6 | 2 | 0.9 | 63 | 6.5 | 8 | 4.5 | |
| 400–499 | 684 | 2.4 | 84.9 | 475 | 2.4 | 162 | 2.6 | 12 | 1.3 | 0 | 0 | 2 | 5.1 | 5 | 2.2 | 26 | 2.7 | 2 | 1.1 | ||
| 500–599 | 608 | 2.1 | 87.0 | 404 | 2.0 | 165 | 2.6 | 9 | 1.0 | 1 | 0.5 | 1 | 1.7 | 0 | 1 | 0.4 | 26 | 2.7 | 1 | 0.6 | |
| 600–699 | 341 | 1.2 | 88.2 | 254 | 1.3 | 66 | 1.0 | 6 | 0.7 | 2 | 1.0 | 4 | 6.7 | 2 | 5.1 | 0 | 7 | 0.7 | 0 | ||
| 700–799 | 248 | 0.9 | 89.1 | 172 | 0.9 | 58 | 0.9 | 3 | 0.3 | 1 | 0.5 | 0 | 1 | 2.6 | 0 | 13 | 1.3 | 0 | |||
| 800–899 | 234 | 0.8 | 89.9 | 150 | 0.8 | 64 | 1.0 | 5 | 0.5 | 0 | 0 | 2 | 5.1 | 1 | 0.4 | 12 | 1.2 | 0 | |||
| 900–999 | 130 | 0.5 | 90.4 | 89 | 0.4 | 30 | 0.5 | 2 | 0.2 | 0 | 0 | 1 | 2.6 | 0 | 7 | 0.7 | 1 | 0.6 | |||
| 1,000–1,999 | 1,209 | 4.2 | 94.6 | 678 | 3.4 | 413 | 6.5 | 30 | 3.3 | 2 | 1.0 | 1 | 1.7 | 4 | 10.3 | 2 | 0.9 | 77 | 7.9 | 2 | 1.1 |
| 2,000–2,999 | 520 | 1.8 | 96.4 | 306 | 1.5 | 171 | 2.7 | 8 | 0.9 | 3 | 1.4 | 0 | 3 | 7.7 | 0 | 27 | 2.8 | 2 | 1.1 | ||
| 3,000–3,999 | 333 | 1.2 | 97.6 | 164 | 0.8 | 138 | 2.2 | 2 | 0.2 | 2 | 1.0 | 0 | 1 | 2.6 | 0 | 25 | 2.6 | 1 | 0.6 | ||
| 4,000-4,999 | 130 | 0.5 | 98.1 | 73 | 0.4 | 43 | 0.7 | 0 | 0 | 0 | 0 | 0 | 14 | 1.4 | 0 | ||||||
| 5,000-9,999 | 367 | 1.3 | 99.4 | 221 | 1.1 | 117 | 1.8 | 5 | 0.5 | 0 | 0 | 2 | 5.1 | 0 | 22 | 2.3 | 0 | ||||
| Over 9,999 | 268 | 0.9 | 100.0 | 129 | 0.6 | 106 | 1.7 | 15 | 1.6 | 0 | 0 | 3 | 7.7 | 0 | 15 | 1.5 | 0 | ||||
- 1 See Glossary of terms for definitions.
- 2 Based on revised situation count which absorbs
275 of 275 figures sit in a row or column sum that works out.
Reader’s notes
p. 254. 22 columns: stub, "Total number of situations", two "Total" percent columns, then nine paired Number/Percent column groups (CA, CB, CC, CD, CE, CG, CP, CA–CB combinations, Other C combinations). The crop is cut off at the bottom: the body ends mid-table at "3,000–3,999" (cumulative percent only 97.6), so further size classes and any footnotes printed below the table are not on this image. The superscript 2 on the Total row's "28,793" refers to a footnote that falls outside the crop; `footnotes` is therefore empty. Faint/dropped decimal points in the scan: in several percent cells the decimal point did not survive the scan and the digits read as separated pairs. I transcribed the decimal point in each, since every cell in those columns is printed to one decimal place. Affected cells: 50–59 / "CA–CB combinations – Percent by size class" (3.7) and / "Other C combinations – Percent by size class" (1.1); 60–69 / "Other C – Percent" (4.0); 70–79 / "Other C – Percent" (2.3); 80–89 / "CD – Percent" (3.9); 90–99 / "CD – Percent" (1.0); 170–179 / "CC – Percent" (0.3); 190–199 / "CC – Percent" (0.2). Column headings: at the small type size the scan shows broken letters in a few of the repeated stacked headings ("sttua-tions" under CB, "aze class" under CE, "situa-tons" under CP and CA–CB). These are plainly the same "Number of situations" / "Percent by size class" headings repeated across the groups, so I transcribed the intended wording. Cells holding only a dash rule ("——") are rendered as "". Printed zeros are kept as 0; note that many rows pair a printed "0" count with a dash-rule percent cell. The Total row's "Cumulative percent of all situations" cell is a dash rule, hence "".
p. 255. The crop is the tail of a continued table (the caption ends \"...Fiscal Year 1989 1 —Continued\"), so only the last three size classes are present; the earlier size-class rows and any total row are on the preceding page. Footnote 2 is cut off by the bottom edge of the crop: only \"Based on revised situation count which absorbs\" plus the start of one more word (unreadable, possibly \"charges\" or \"cases\") is visible. It is transcribed only as far as it is legible; the remainder of the sentence is not on this image. No footnote marker 2 appears on any heading, label or value within this crop, so its referent is presumably on the part of the table printed earlier. All \"Percent by size class\" cells that are printed as an em-dash rule have been written as \"\" per the dash rule: CC for 4,000-4,999; CD, CE, CP and Other C combinations for all three rows; CG for 4,000-4,999. The CG percentages (5.1 for 5,000-9,999 on a count of 2, and 7.7 for Over 9,999 on a count of 3) are far larger than the neighbouring columns' percentages, but they are consistent with a very small CG base and are transcribed exactly as printed. The scan is a low-contrast 1-bit image rotated upright; the decimal points in the one-decimal percentages are faint. The cells I am least certain of are CC / Percent by size class for \"Over 9,999\" (read as 1.6) and CA-CB combinations / Percent by size class for \"Over 9,999\" (read as 1.5); the digits themselves are clear, the decimal points are inferred from the uniform one-decimal format of the column. The hyphens in the row labels \"4,000-4,999\" and \"5,000-9,999\" and in the heading \"CA-CB combinations\" are printed as short dashes and are transcribed as plain hyphens.
Source image
Source data: U.S. NLRB Annual Reports (public domain). Reconstruction by NLRB Stats Archive. Read by claude-opus-5 (effort max, prompt extract_v1) from the 300-dpi scan; stitched by page. Updated October 2026.