NLRB Stats Archive › Annual Reports › FY1989 › Size of Units in Representation Elections in Cases Closed, Fiscal Year 1989
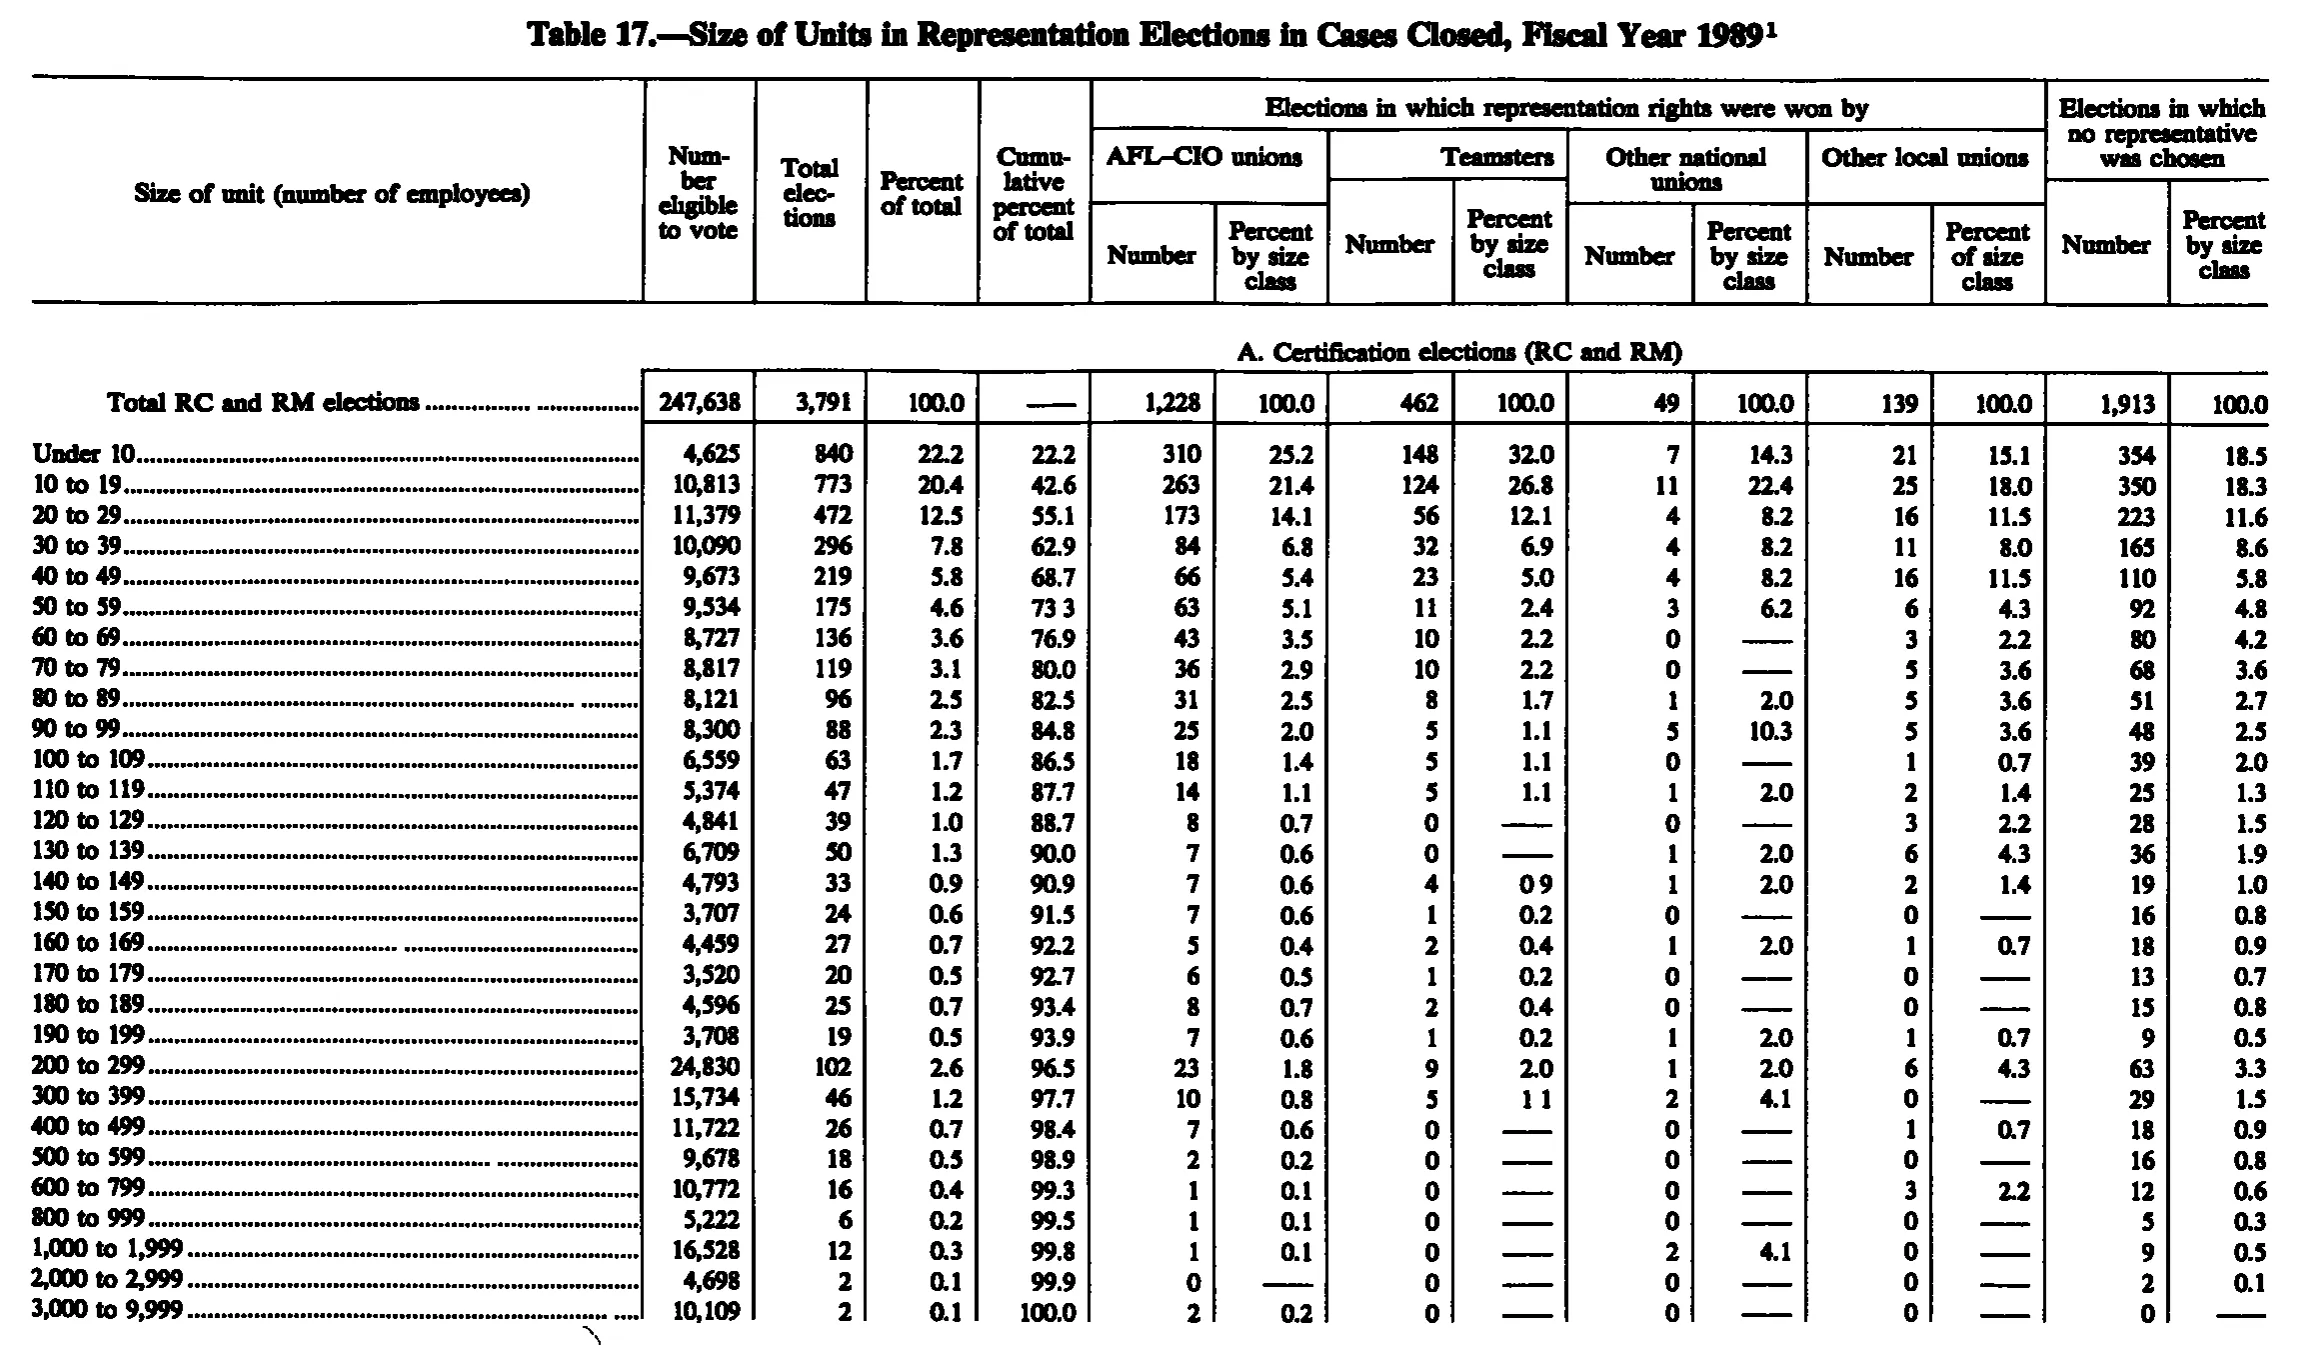
Size of Units in Representation Elections in Cases Closed, Fiscal Year 1989
Stitched from pp. 252–253.
| Size of unit (number of employees) | Number eligible to vote | Total elections | Percent of total | Cumulative percent of total | Elections in which representation rights were won by | Elections in which no representative was chosen | ||||||||
|---|---|---|---|---|---|---|---|---|---|---|---|---|---|---|
| Size of unit (number of employees) | Number eligible to vote | Total elections | Percent of total | Cumulative percent of total | AFL-CIO unions | Teamsters | Other national unions | Other local unions | Elections in which no representative was chosen | |||||
| Size of unit (number of employees) | Number eligible to vote | Total elections | Percent of total | Cumulative percent of total | Number | Percent by size class | Number | Percent by size class | Number | Percent by size class | Number | Percent of size class | Number | Percent by size class |
| A. Certification elections (RC and RM) | ||||||||||||||
| Total RC and RM elections | 247,638 | 3,791 | 100.0 | 1,228 | 100.0 | 462 | 100.0 | 49 | 100.0 | 139 | 100.0 | 1,913 | 100.0 | |
| Under 10 | 4,625 | 840 | 22.2 | 22.2 | 310 | 25.2 | 148 | 32.0 | 7 | 14.3 | 21 | 15.1 | 354 | 18.5 |
| 10 to 19 | 10,813 | 773 | 20.4 | 42.6 | 263 | 21.4 | 124 | 26.8 | 11 | 22.4 | 25 | 18.0 | 350 | 18.3 |
| 20 to 29 | 11,379 | 472 | 12.5 | 55.1 | 173 | 14.1 | 56 | 12.1 | 4 | 8.2 | 16 | 11.5 | 223 | 11.6 |
| 30 to 39 | 10,090 | 296 | 7.8 | 62.9 | 84 | 6.8 | 32 | 6.9 | 4 | 8.2 | 11 | 8.0 | 165 | 8.6 |
| 40 to 49 | 9,673 | 219 | 5.8 | 68.7 | 66 | 5.4 | 23 | 5.0 | 4 | 8.2 | 16 | 11.5 | 110 | 5.8 |
| 50 to 59 | 9,534 | 175 | 4.6 | 73.3 | 63 | 5.1 | 11 | 2.4 | 3 | 6.2 | 6 | 4.3 | 92 | 4.8 |
| 60 to 69 | 8,727 | 136 | 3.6 | 76.9 | 43 | 3.5 | 10 | 2.2 | 0 | 3 | 2.2 | 80 | 4.2 | |
| 70 to 79 | 8,817 | 119 | 3.1 | 80.0 | 36 | 2.9 | 10 | 2.2 | 0 | 5 | 3.6 | 68 | 3.6 | |
| 80 to 89 | 8,121 | 96 | 2.5 | 82.5 | 31 | 2.5 | 8 | 1.7 | 1 | 2.0 | 5 | 3.6 | 51 | 2.7 |
| 90 to 99 | 8,300 | 88 | 2.3 | 84.8 | 25 | 2.0 | 5 | 1.1 | 5 | 10.3 | 5 | 3.6 | 48 | 2.5 |
| 100 to 109 | 6,559 | 63 | 1.7 | 86.5 | 18 | 1.4 | 5 | 1.1 | 0 | 1 | 0.7 | 39 | 2.0 | |
| 110 to 119 | 5,374 | 47 | 1.2 | 87.7 | 14 | 1.1 | 5 | 1.1 | 1 | 2.0 | 2 | 1.4 | 25 | 1.3 |
| 120 to 129 | 4,841 | 39 | 1.0 | 88.7 | 8 | 0.7 | 0 | 0 | 3 | 2.2 | 28 | 1.5 | ||
| 130 to 139 | 6,709 | 50 | 1.3 | 90.0 | 7 | 0.6 | 0 | 1 | 2.0 | 6 | 4.3 | 36 | 1.9 | |
| 140 to 149 | 4,793 | 33 | 0.9 | 90.9 | 7 | 0.6 | 4 | 0.9 | 1 | 2.0 | 2 | 1.4 | 19 | 1.0 |
| 150 to 159 | 3,707 | 24 | 0.6 | 91.5 | 7 | 0.6 | 1 | 0.2 | 0 | 0 | 16 | 0.8 | ||
| 160 to 169 | 4,459 | 27 | 0.7 | 92.2 | 5 | 0.4 | 2 | 0.4 | 1 | 2.0 | 1 | 0.7 | 18 | 0.9 |
| 170 to 179 | 3,520 | 20 | 0.5 | 92.7 | 6 | 0.5 | 1 | 0.2 | 0 | 0 | 13 | 0.7 | ||
| 180 to 189 | 4,596 | 25 | 0.7 | 93.4 | 8 | 0.7 | 2 | 0.4 | 0 | 0 | 15 | 0.8 | ||
| 190 to 199 | 3,708 | 19 | 0.5 | 93.9 | 7 | 0.6 | 1 | 0.2 | 1 | 2.0 | 1 | 0.7 | 9 | 0.5 |
| 200 to 299 | 24,830 | 102 | 2.6 | 96.5 | 23 | 1.8 | 9 | 2.0 | 1 | 2.0 | 6 | 4.3 | 63 | 3.3 |
| 300 to 399 | 15,734 | 46 | 1.2 | 97.7 | 10 | 0.8 | 5 | 1.1 | 2 | 4.1 | 0 | 29 | 1.5 | |
| 400 to 499 | 11,722 | 26 | 0.7 | 98.4 | 7 | 0.6 | 0 | 0 | 1 | 0.7 | 18 | 0.9 | ||
| 500 to 599 | 9,678 | 18 | 0.5 | 98.9 | 2 | 0.2 | 0 | 0 | 0 | 16 | 0.8 | |||
| 600 to 799 | 10,772 | 16 | 0.4 | 99.3 | 1 | 0.1 | 0 | 0 | 3 | 2.2 | 12 | 0.6 | ||
| 800 to 999 | 5,222 | 6 | 0.2 | 99.5 | 1 | 0.1 | 0 | 0 | 0 | 5 | 0.3 | |||
| 1,000 to 1,999 | 16,528 | 12 | 0.3 | 99.8 | 1 | 0.1 | 0 | 2 | 4.1 | 0 | 9 | 0.5 | ||
| 2,000 to 2,999 | 4,698 | 2 | 0.1 | 99.9 | 0 | 0 | 0 | 0 | 2 | 0.1 | ||||
| 3,000 to 9,999 | 10,109 | 2 | 0.1 | 100.0 | 2 | 0.2 | 0 | 0 | 0 | 0 | ||||
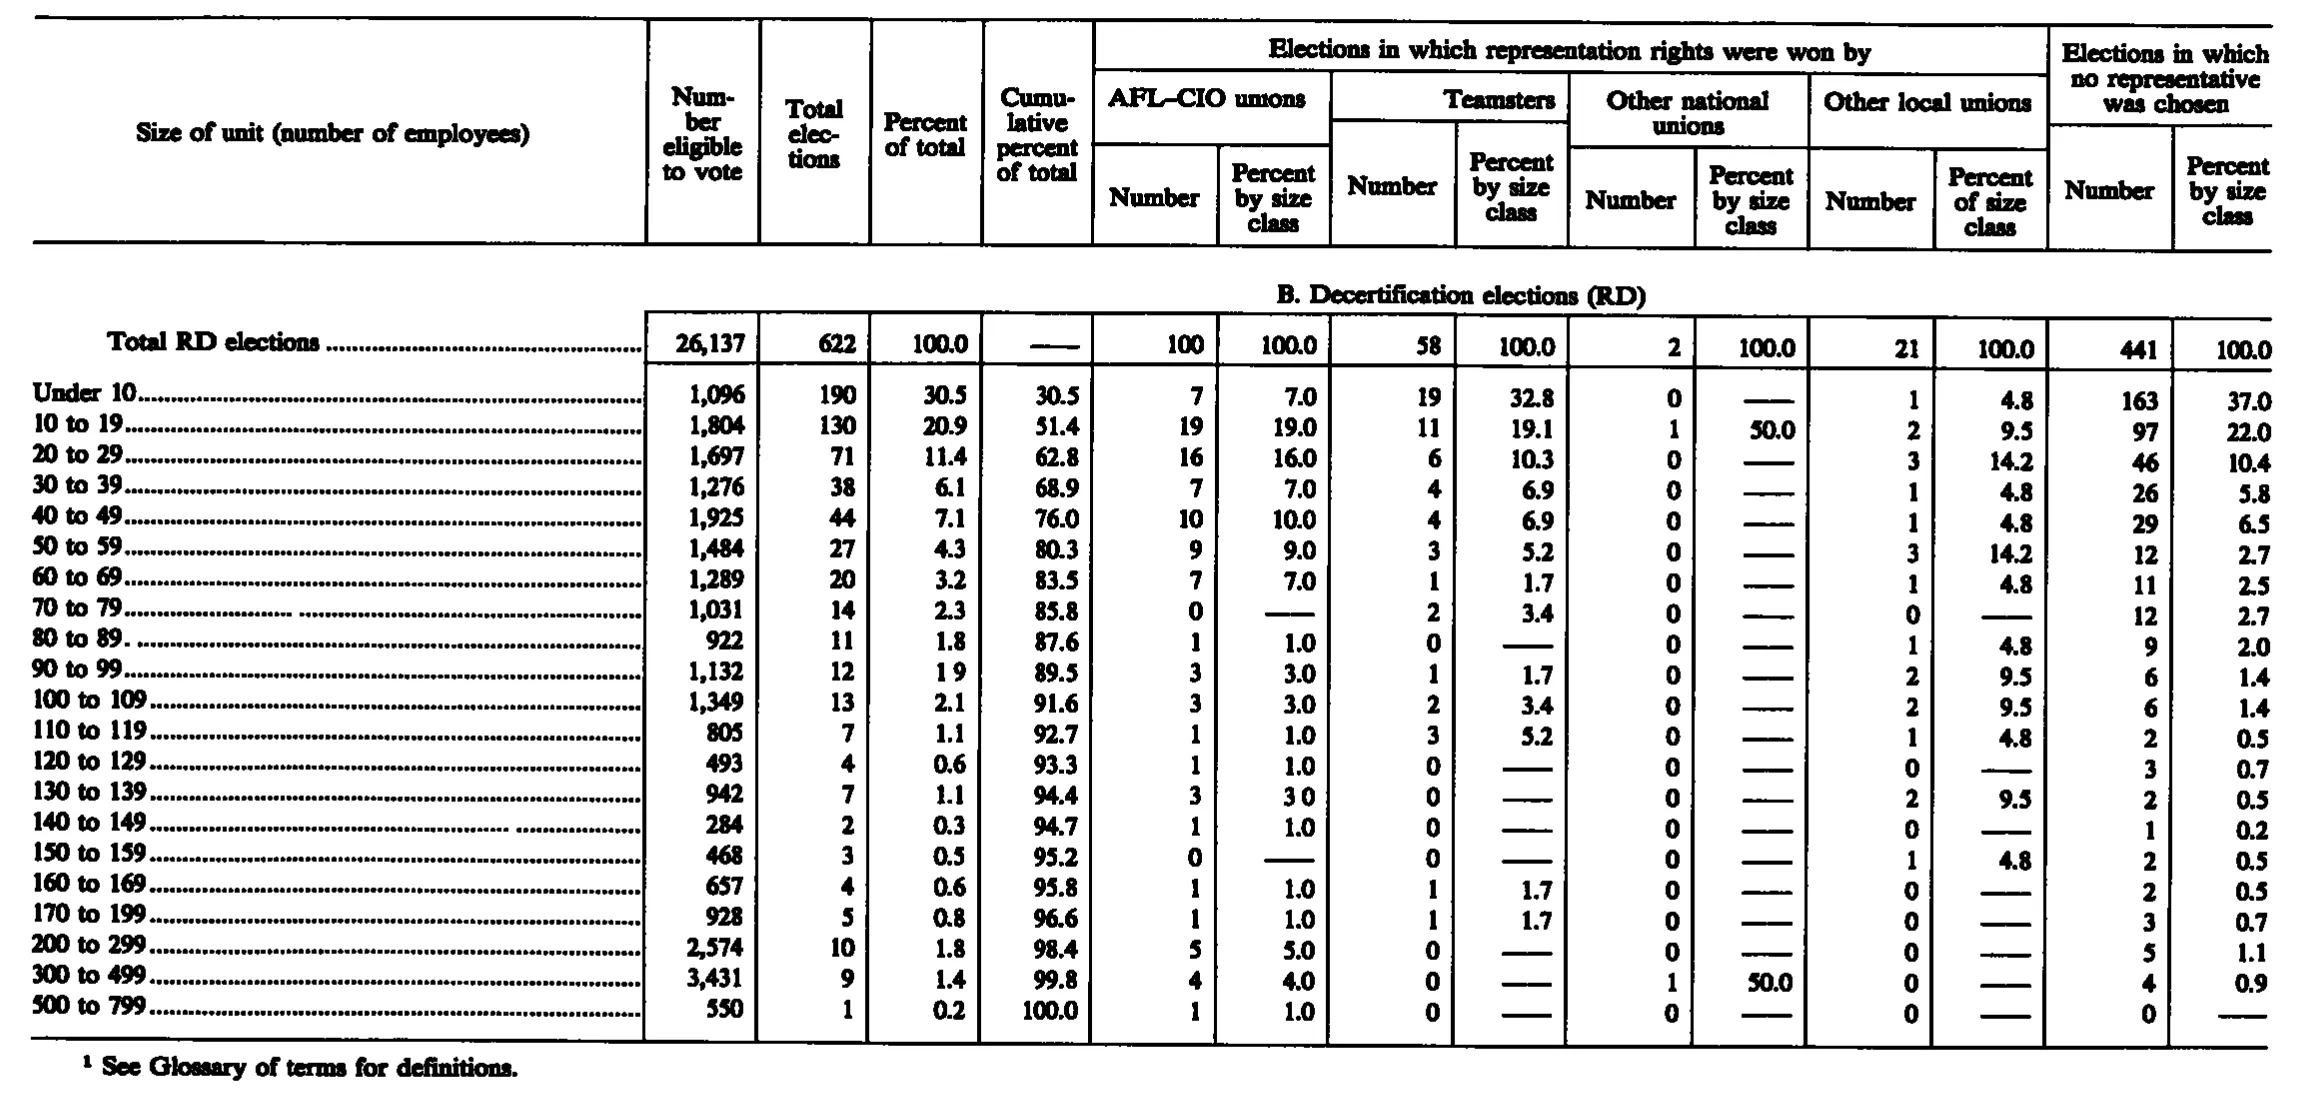
| B. Decertification elections (RD) | ||||||||||||||
| Total RD elections | 26,137 | 622 | 100.0 | 100 | 100.0 | 58 | 100.0 | 2 | 100.0 | 21 | 100.0 | 441 | 100.0 | |
| Under 10 | 1,096 | 190 | 30.5 | 30.5 | 7 | 7.0 | 19 | 32.8 | 0 | 1 | 4.8 | 163 | 37.0 | |
| 10 to 19 | 1,804 | 130 | 20.9 | 51.4 | 19 | 19.0 | 11 | 19.1 | 1 | 50.0 | 2 | 9.5 | 97 | 22.0 |
| 20 to 29 | 1,697 | 71 | 11.4 | 62.8 | 16 | 16.0 | 6 | 10.3 | 0 | 3 | 14.2 | 46 | 10.4 | |
| 30 to 39 | 1,276 | 38 | 6.1 | 68.9 | 7 | 7.0 | 4 | 6.9 | 0 | 1 | 4.8 | 26 | 5.8 | |
| 40 to 49 | 1,925 | 44 | 7.1 | 76.0 | 10 | 10.0 | 4 | 6.9 | 0 | 1 | 4.8 | 29 | 6.5 | |
| 50 to 59 | 1,484 | 27 | 4.3 | 80.3 | 9 | 9.0 | 3 | 5.2 | 0 | 3 | 14.2 | 12 | 2.7 | |
| 60 to 69 | 1,289 | 20 | 3.2 | 83.5 | 7 | 7.0 | 1 | 1.7 | 0 | 1 | 4.8 | 11 | 2.5 | |
| 70 to 79 | 1,031 | 14 | 2.3 | 85.8 | 0 | 2 | 3.4 | 0 | 0 | 12 | 2.7 | |||
| 80 to 89 | 922 | 11 | 1.8 | 87.6 | 1 | 1.0 | 0 | 0 | 1 | 4.8 | 9 | 2.0 | ||
| 90 to 99 | 1,132 | 12 | 19 | 89.5 | 3 | 3.0 | 1 | 1.7 | 0 | 2 | 9.5 | 6 | 1.4 | |
| 100 to 109 | 1,349 | 13 | 2.1 | 91.6 | 3 | 3.0 | 2 | 3.4 | 0 | 2 | 9.5 | 6 | 1.4 | |
| 110 to 119 | 805 | 7 | 1.1 | 92.7 | 1 | 1.0 | 3 | 5.2 | 0 | 1 | 4.8 | 2 | 0.5 | |
| 120 to 129 | 493 | 4 | 0.6 | 93.3 | 1 | 1.0 | 0 | 0 | 0 | 3 | 0.7 | |||
| 130 to 139 | 942 | 7 | 1.1 | 94.4 | 3 | 30 | 0 | 0 | 2 | 9.5 | 2 | 0.5 | ||
| 140 to 149 | 284 | 2 | 0.3 | 94.7 | 1 | 1.0 | 0 | 0 | 0 | 1 | 0.2 | |||
| 150 to 159 | 468 | 3 | 0.5 | 95.2 | 0 | 0 | 0 | 1 | 4.8 | 2 | 0.5 | |||
| 160 to 169 | 657 | 4 | 0.6 | 95.8 | 1 | 1.0 | 1 | 1.7 | 0 | 0 | 2 | 0.5 | ||
| 170 to 199 | 928 | 5 | 0.8 | 96.6 | 1 | 1.0 | 1 | 1.7 | 0 | 0 | 3 | 0.7 | ||
| 200 to 299 | 2,574 | 10 | 1.8 | 98.4 | 5 | 5.0 | 0 | 0 | 0 | 5 | 1.1 | |||
| 300 to 499 | 3,431 | 9 | 1.4 | 99.8 | 4 | 4.0 | 0 | 1 | 50.0 | 0 | 4 | 0.9 | ||
| 500 to 799 | 550 | 1 | 0.2 | 100.0 | 1 | 1.0 | 0 | 0 | 0 | 0 | ||||
- 1 See Glossary of terms for definitions.
293 of 293 figures sit in a row or column sum that works out.
Reader’s notes
p. 252. CROP: The image shows only panel A ("A. Certification elections (RC and RM)") and ends after the "3,000 to 9,999" row; the table continues beyond this crop (a further section and the text of footnote 1, which is called out by the superscript 1 in the caption, are not on this image), so `footnotes` is empty. DASH RULES: Every "------" dash rule (the Cumulative-percent cell of the "Total RC and RM elections" row and the many zero-percent cells) is transcribed as "". DROPPED DECIMAL POINTS (scan artefact, not a misprint in the figure): three cells print with a gap where the decimal point has faded out. "50 to 59" / Cumulative percent of total reads "73 3" — transcribed 73.3, confirmed because the cumulative series requires 68.7 + 4.6 = 73.3. "140 to 149" / Teamsters Percent by size class reads "0 9" — transcribed 0.9 (4/462 = 0.87). "300 to 399" / Teamsters Percent by size class reads "1 1" — transcribed 1.1 (5/462 = 1.08). DOUBTFUL CELLS (transcribed exactly as read; the final digit is small and the recomputed value differs by 0.1, so either the original rounds oddly or I have misread the last digit): "90 to 99" / Other national unions Percent by size class = 10.3 (5/49 = 10.2); "50 to 59" / Other national unions Percent by size class = 6.2 (3/49 = 6.1); "30 to 39" / Other local unions Percent of size class = 8.0 (11/139 = 7.9). All other percent cells reproduce exactly from the printed counts. HEADING AS PRINTED: the third-level heading under "Other local unions" reads "Percent of size class", while the AFL-CIO, Teamsters, Other national and no-representative blocks all read "Percent by size class". Transcribed as printed. "AFL-CIO" is set with an en dash in the original and is written here with a hyphen. VERIFICATION: all 29 data rows satisfy AFL-CIO + Teamsters + Other national + Other local + no-representative = Total elections; the Total-elections column sums to the printed 3,791 and the Number-eligible-to-vote column sums to the printed 247,638; the five "Number" totals (1,228 + 462 + 49 + 139 + 1,913) also sum to 3,791. No internal inconsistency was found in the integer columns.
p. 253. The crop shows only panel B of the table; the caption and panel A are on an earlier page, so the printed heading band at the top of this image is the one transcribed here. Column structure: 15 columns (stub + 4 single columns + four two-column winner groups + a two-column "no representative was chosen" group). "Elections in which no representative was chosen" spans heading levels 1-2; the stub and the four single columns span all three levels. Dash rules ("——") in the cumulative-percent and percent-by-size-class cells are transcribed as empty cells, per instruction. Apparent misprints, transcribed exactly as printed: - "90 to 99", Percent of total: printed "19" with no decimal point. The cumulative column (87.6 -> 89.5) and 12/622 = 1.93 both imply 1.9; the decimal point is missing or did not reproduce in the scan. - "130 to 139", AFL-CIO unions / Percent by size class: printed "30" with no decimal point. 3/100 implies 3.0; the decimal point is missing in the scan. - "200 to 299", Percent of total: printed 1.8, but 10/622 = 1.6. The printed cumulative column is internally consistent with 1.8 (96.6 + 1.8 = 98.4), so the source itself is inconsistent here; transcribed as printed. Doubtful small-type cells (reading is my best judgment at this resolution; all are in the two-decimal percent columns): - "10 to 19", Teamsters / Percent by size class: read as 19.1; 11/58 = 19.0, so this may be 19.0 in the original. - "30 to 39", no representative chosen / Percent by size class: read as 5.8; 26/441 = 5.9. - "40 to 49", no representative chosen / Percent by size class: read as 6.5; 29/441 = 6.6. - "60 to 69", no representative chosen / Percent by size class: read as 2.5; 11/441 = 2.49. Verification performed: all five count columns sum exactly to their printed totals (eligible to vote 26,137; total elections 622; AFL-CIO 100; Teamsters 58; other national 2; other local 21; no representative 441), and the cumulative-percent column reproduces the running sum of the percent-of-total column at every row. This confirms the row-to-column alignment. The row label printed as "80 to 89." carries a period before the leader dots; transcribed as "80 to 89".
Source image
Source data: U.S. NLRB Annual Reports (public domain). Reconstruction by NLRB Stats Archive. Read by claude-opus-5 (effort max, prompt extract_v1) from the 300-dpi scan; stitched by page. Updated October 2026.