NLRB Stats Archive › Annual Reports › FY1989 › Final outcomes of representation elections in cases closed
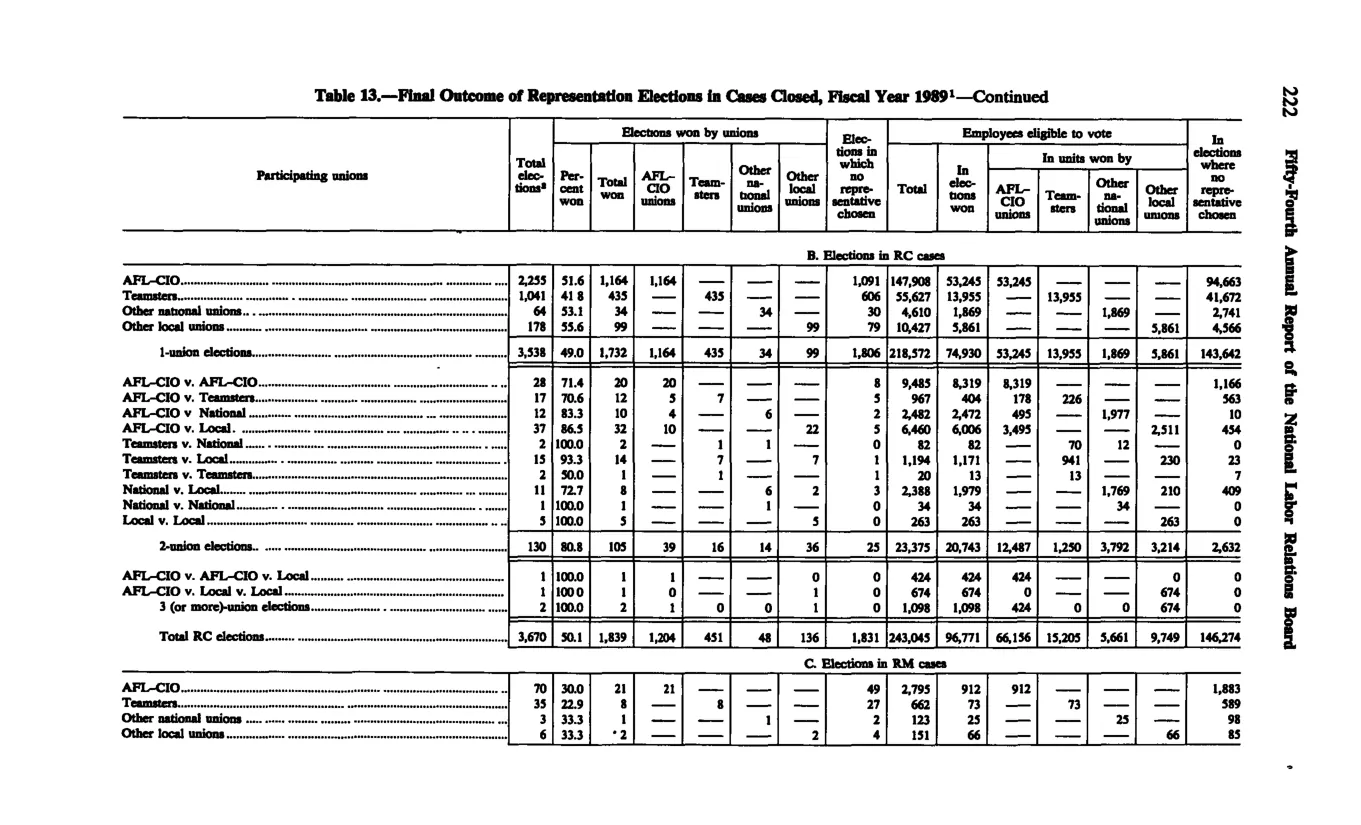
Final outcomes of representation elections in cases closed
| Participating unions | Total elections | Percent won | Elections won by unions — Total won | Elections won by unions — AFL-CIO unions | Elections won by unions — Teamsters | Elections won by unions — Other national unions | Elections won by unions — Other local unions | Elections in which no representative chosen | Employees eligible to vote | Employees eligible — In units won by AFL-CIO unions | Employees eligible — In units won by Teamsters | Employees eligible — In units won by Other national unions | Employees eligible — In units won by Other local unions | In elections — no representative chosen (count) |
|---|---|---|---|---|---|---|---|---|---|---|---|---|---|---|
| AFL-CIO unions (RC, 1-union) | 2,255 | 50.7 | 1,164 | 1,164 | 1,091 | 147,508 | 53,245 | 94,663 | ||||||
| Teamsters (RC, 1-union) | 1,041 | 41.8 | 435 | 435 | 606 | 35,627 | 13,955 | 41,672 | ||||||
| Other national unions (RC, 1-union) | 64 | 53.1 | 34 | 34 | 30 | 4,610 | 1,869 | 2,741 | ||||||
| Other local unions (RC, 1-union) | 178 | 55.6 | 99 | 99 | 79 | 10,427 | 5,861 | 4,566 | ||||||
| 1-union elections (RC, sub-total) | 3,538 | 49.4 | 1,732 | 1,164 | 435 | 34 | 99 | 1,806 | 218,172 | 74,930 | 53,245 | 13,955 | 1,869 | 5,861 |
| 130 | 80.8 | 105 | 39 | 16 | 14 | 36 | 25 | 23,375 | 20,743 | 4,487 | 1,250 | 3,792 | ||
| 1 | 100 | 1 | 0 | 434 | ||||||||||
| Total RC elections | 3,670 | 50.1 | 1,839 | 1,206 | 451 | 48 | 135 | 1,831 | 243,045 | 96,776 | 66,156 | 5,089 | 5,861 | 9,749 |
| AFL-CIO unions (RM) | 70 | 30 | 21 | 21 | 7,295 | 912 | 1,883 |
Source image
Source data: U.S. NLRB Annual Reports (public domain). Reconstruction by NLRB Stats Archive. Updated June 2026.