NLRB Stats Archive › Annual Reports › FY1989 › Standard Federal Administrative Regional Distribution of Cases Received, Fiscal Year 1989
Standard Federal Administrative Regional Distribution of Cases Received, Fiscal Year 1989
Stitched from pp. 218–220; a later page prints different headings, kept as rows.
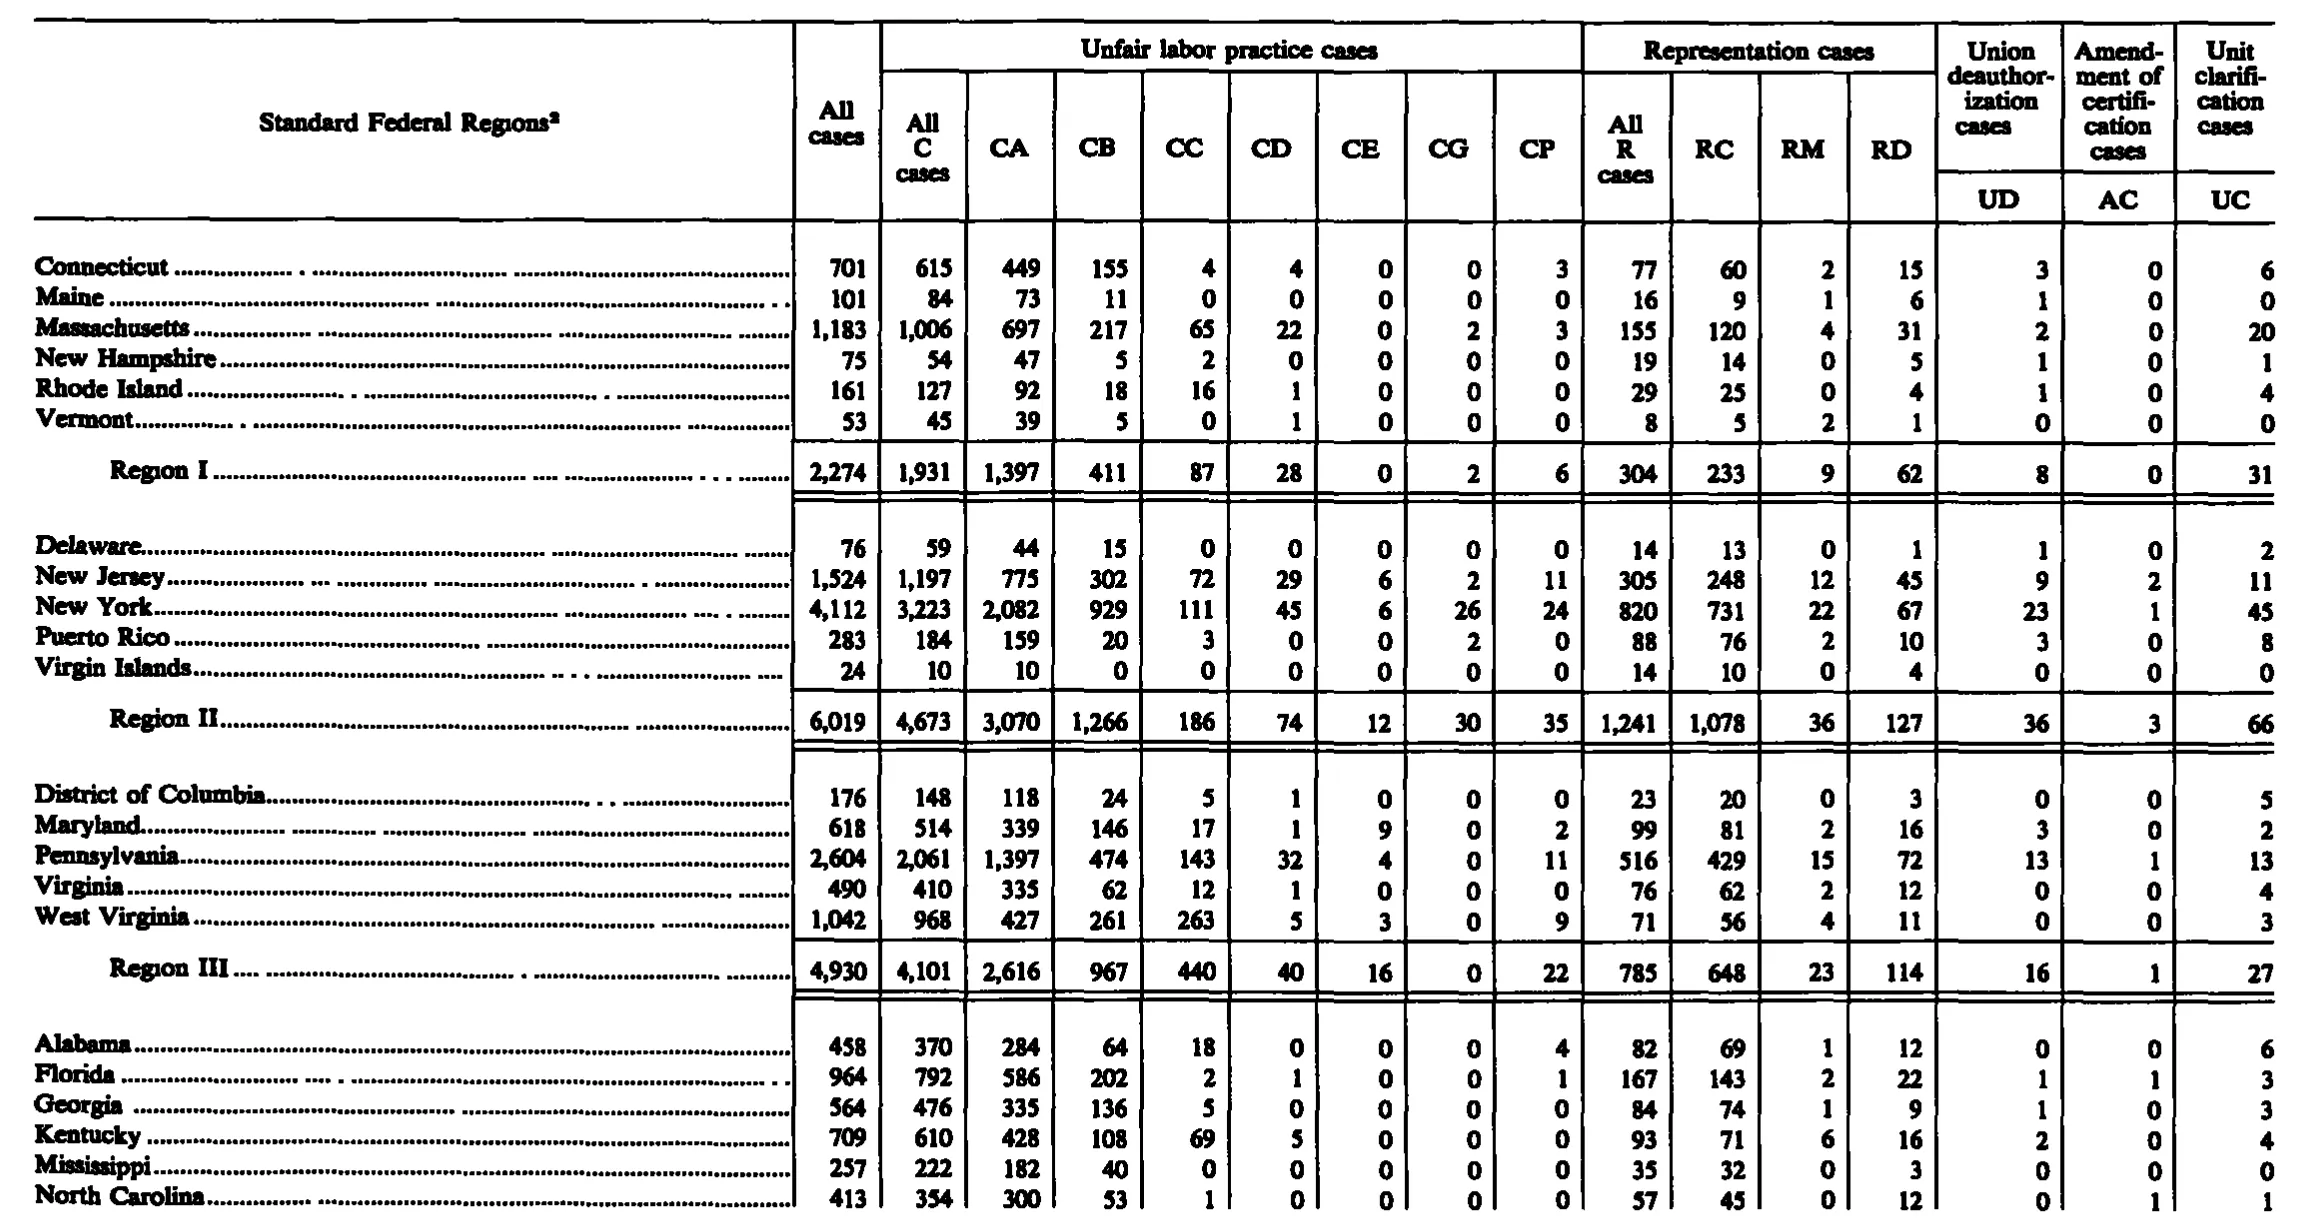
| Standard Federal Regions | All cases | Unfair labor practice cases | Representation cases | Union deauthorization cases | Amendment of certification cases | Unit clarification cases | ||||||||||
|---|---|---|---|---|---|---|---|---|---|---|---|---|---|---|---|---|
| Standard Federal Regions | All cases | All C cases | CA | CB | CC | CD | CE | CG | CP | All R cases | RC | RM | RD | Union deauthorization cases | Amendment of certification cases | Unit clarification cases |
| Standard Federal Regions | All cases | All C cases | CA | CB | CC | CD | CE | CG | CP | All R cases | RC | RM | RD | UD | AC | UC |
| Connecticut | 701 | 615 | 449 | 155 | 4 | 4 | 0 | 0 | 3 | 77 | 60 | 2 | 15 | 3 | 0 | 6 |
| Maine | 101 | 84 | 73 | 11 | 0 | 0 | 0 | 0 | 0 | 16 | 9 | 1 | 6 | 1 | 0 | 0 |
| Massachusetts | 1,183 | 1,006 | 697 | 217 | 65 | 22 | 0 | 2 | 3 | 155 | 120 | 4 | 31 | 2 | 0 | 20 |
| New Hampshire | 75 | 54 | 47 | 5 | 2 | 0 | 0 | 0 | 0 | 19 | 14 | 0 | 5 | 1 | 0 | 1 |
| Rhode Island | 161 | 127 | 92 | 18 | 16 | 1 | 0 | 0 | 0 | 29 | 25 | 0 | 4 | 1 | 0 | 4 |
| Vermont | 53 | 45 | 39 | 5 | 0 | 1 | 0 | 0 | 0 | 8 | 5 | 2 | 1 | 0 | 0 | 0 |
| Region I | 2,274 | 1,931 | 1,397 | 411 | 87 | 28 | 0 | 2 | 6 | 304 | 233 | 9 | 62 | 8 | 0 | 31 |
| Delaware | 76 | 59 | 44 | 15 | 0 | 0 | 0 | 0 | 0 | 14 | 13 | 0 | 1 | 1 | 0 | 2 |
| New Jersey | 1,524 | 1,197 | 775 | 302 | 72 | 29 | 6 | 2 | 11 | 305 | 248 | 12 | 45 | 9 | 2 | 11 |
| New York | 4,112 | 3,223 | 2,082 | 929 | 111 | 45 | 6 | 26 | 24 | 820 | 731 | 22 | 67 | 23 | 1 | 45 |
| Puerto Rico | 283 | 184 | 159 | 20 | 3 | 0 | 0 | 2 | 0 | 88 | 76 | 2 | 10 | 3 | 0 | 8 |
| Virgin Islands | 24 | 10 | 10 | 0 | 0 | 0 | 0 | 0 | 0 | 14 | 10 | 0 | 4 | 0 | 0 | 0 |
| Region II | 6,019 | 4,673 | 3,070 | 1,266 | 186 | 74 | 12 | 30 | 35 | 1,241 | 1,078 | 36 | 127 | 36 | 3 | 66 |
| District of Columbia | 176 | 148 | 118 | 24 | 5 | 1 | 0 | 0 | 0 | 23 | 20 | 0 | 3 | 0 | 0 | 5 |
| Maryland | 618 | 514 | 339 | 146 | 17 | 1 | 9 | 0 | 2 | 99 | 81 | 2 | 16 | 3 | 0 | 2 |
| Pennsylvania | 2,604 | 2,061 | 1,397 | 474 | 143 | 32 | 4 | 0 | 11 | 516 | 429 | 15 | 72 | 13 | 1 | 13 |
| Virginia | 490 | 410 | 335 | 62 | 12 | 1 | 0 | 0 | 0 | 76 | 62 | 2 | 12 | 0 | 0 | 4 |
| West Virginia | 1,042 | 968 | 427 | 261 | 263 | 5 | 3 | 0 | 9 | 71 | 56 | 4 | 11 | 0 | 0 | 3 |
| Region III | 4,930 | 4,101 | 2,616 | 967 | 440 | 40 | 16 | 0 | 22 | 785 | 648 | 23 | 114 | 16 | 1 | 27 |
| Alabama | 458 | 370 | 284 | 64 | 18 | 0 | 0 | 0 | 4 | 82 | 69 | 1 | 12 | 0 | 0 | 6 |
| Florida | 964 | 792 | 586 | 202 | 2 | 1 | 0 | 0 | 1 | 167 | 143 | 2 | 22 | 1 | 1 | 3 |
| Georgia | 564 | 476 | 335 | 136 | 5 | 0 | 0 | 0 | 0 | 84 | 74 | 1 | 9 | 1 | 0 | 3 |
| Kentucky | 709 | 610 | 428 | 108 | 69 | 5 | 0 | 0 | 0 | 93 | 71 | 6 | 16 | 2 | 0 | 4 |
| Mississippi | 257 | 222 | 182 | 40 | 0 | 0 | 0 | 0 | 0 | 35 | 32 | 0 | 3 | 0 | 0 | 0 |
| North Carolina | 413 | 354 | 300 | 53 | 1 | 0 | 0 | 0 | 0 | 57 | 45 | 0 | 12 | 0 | 1 | 1 |
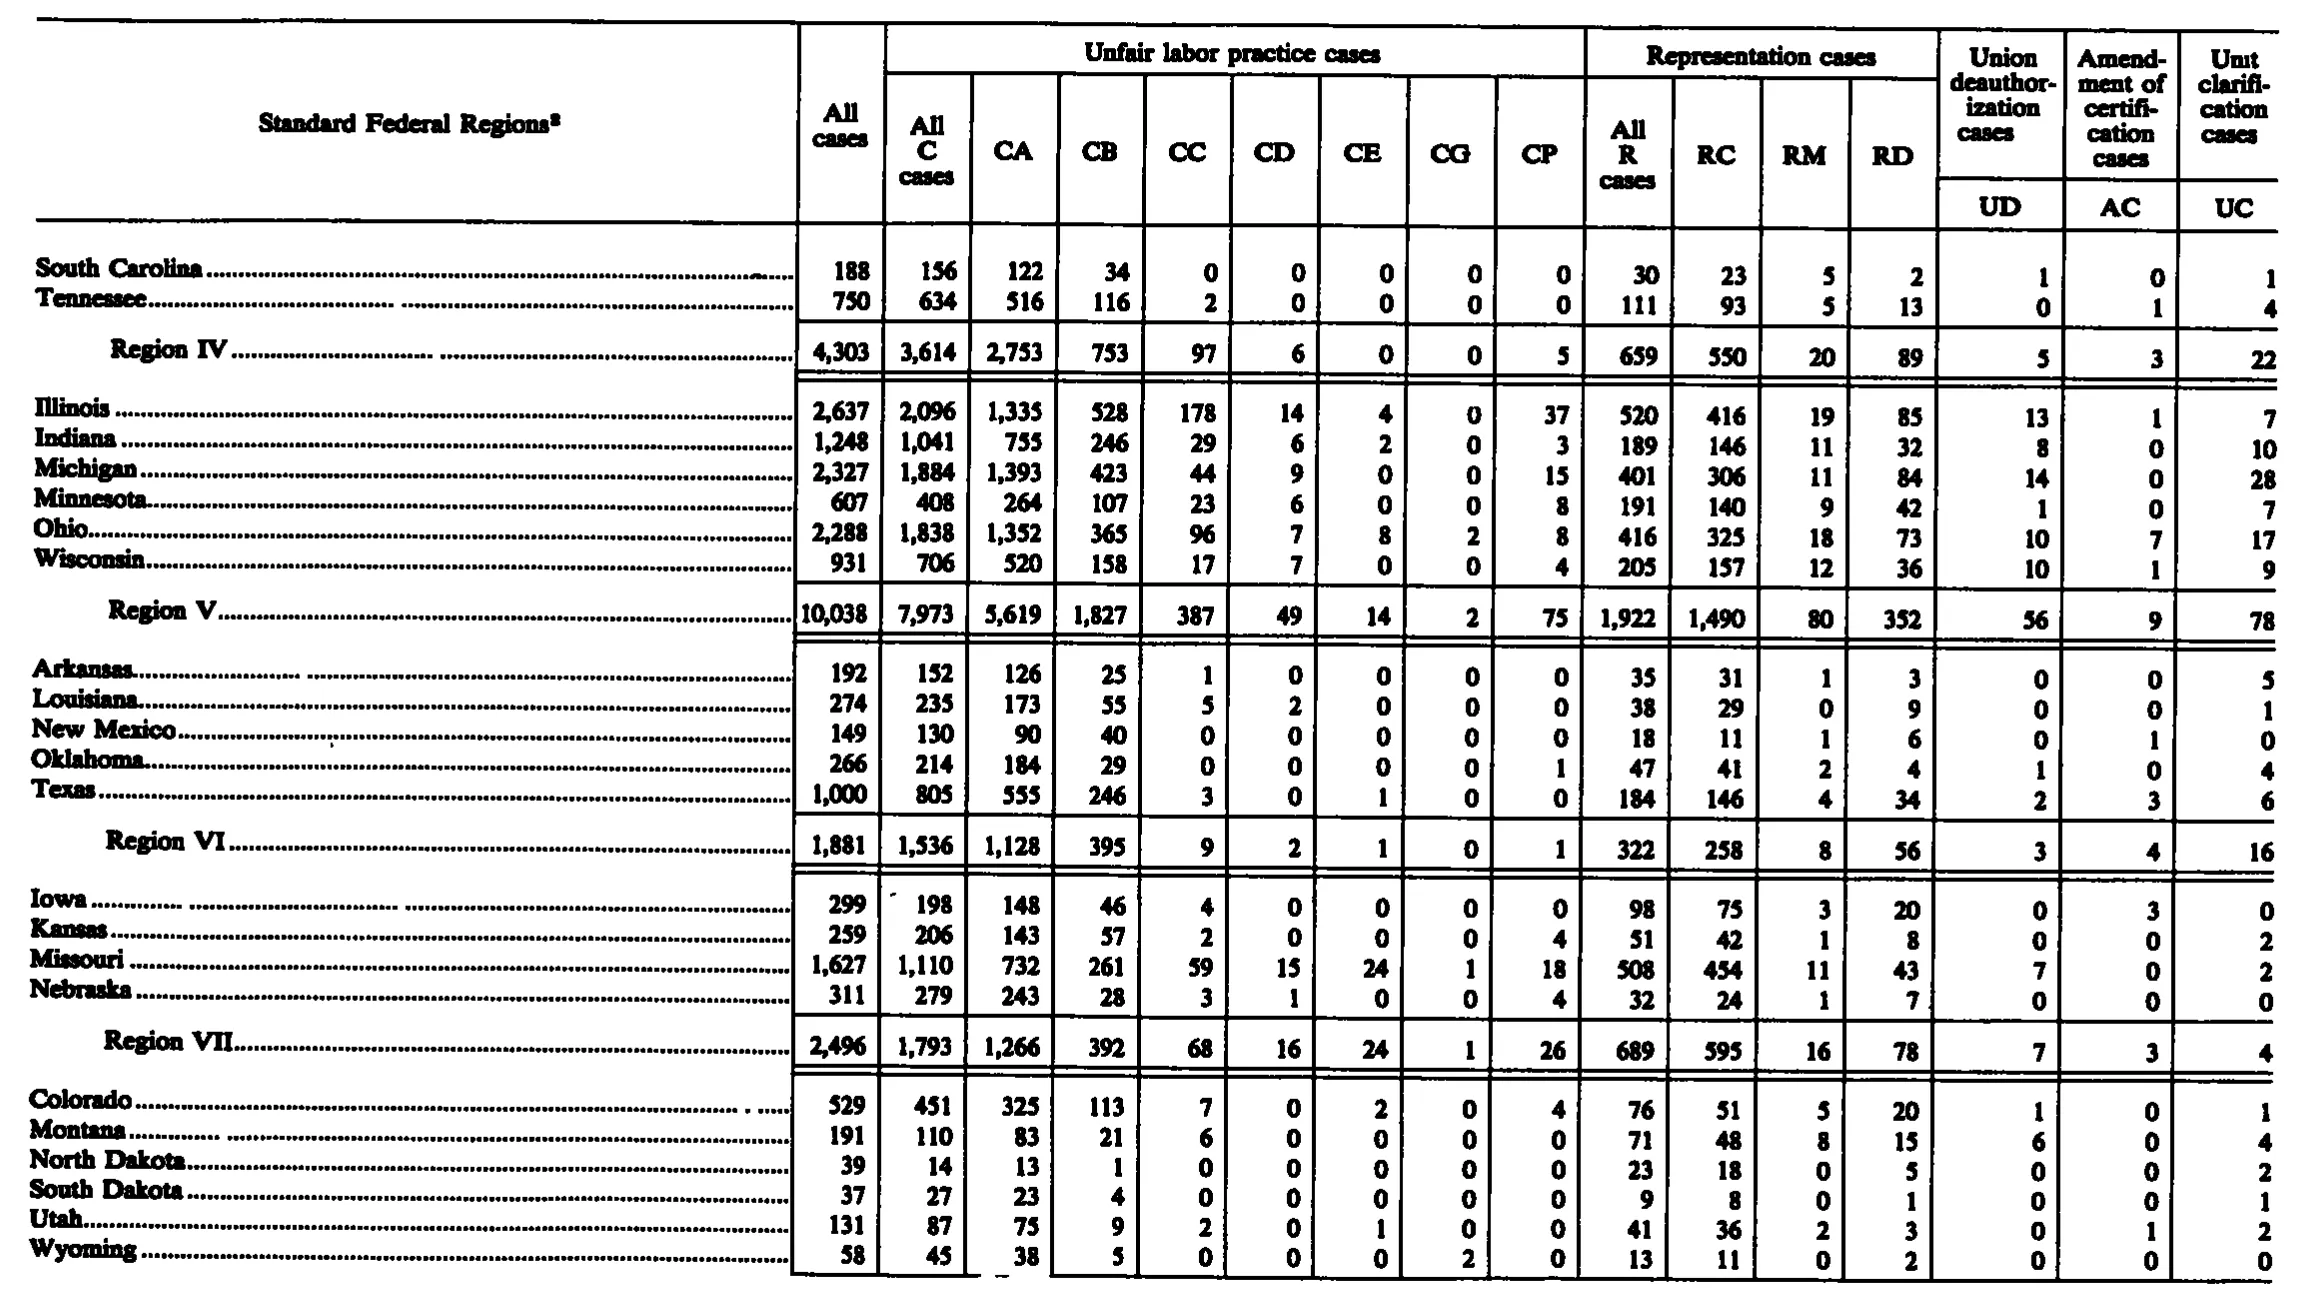
| South Carolina | 188 | 156 | 122 | 34 | 0 | 0 | 0 | 0 | 0 | 30 | 23 | 5 | 2 | 1 | 0 | 1 |
| Tennessee | 750 | 634 | 516 | 116 | 2 | 0 | 0 | 0 | 0 | 111 | 93 | 5 | 13 | 0 | 1 | 4 |
| Region IV | 4,303 | 3,614 | 2,753 | 753 | 97 | 6 | 0 | 0 | 5 | 659 | 550 | 20 | 89 | 5 | 3 | 22 |
| Illinois | 2,637 | 2,096 | 1,335 | 528 | 178 | 14 | 4 | 0 | 37 | 520 | 416 | 19 | 85 | 13 | 1 | 7 |
| Indiana | 1,248 | 1,041 | 755 | 246 | 29 | 6 | 2 | 0 | 3 | 189 | 146 | 11 | 32 | 8 | 0 | 10 |
| Michigan | 2,327 | 1,884 | 1,393 | 423 | 44 | 9 | 0 | 0 | 15 | 401 | 306 | 11 | 84 | 14 | 0 | 28 |
| Minnesota | 607 | 408 | 264 | 107 | 23 | 6 | 0 | 0 | 8 | 191 | 140 | 9 | 42 | 1 | 0 | 7 |
| Ohio | 2,288 | 1,838 | 1,352 | 365 | 96 | 7 | 8 | 2 | 8 | 416 | 325 | 18 | 73 | 10 | 7 | 17 |
| Wisconsin | 931 | 706 | 520 | 158 | 17 | 7 | 0 | 0 | 4 | 205 | 157 | 12 | 36 | 10 | 1 | 9 |
| Region V | 10,038 | 7,973 | 5,619 | 1,827 | 387 | 49 | 14 | 2 | 75 | 1,922 | 1,490 | 80 | 352 | 56 | 9 | 78 |
| Arkansas | 192 | 152 | 126 | 25 | 1 | 0 | 0 | 0 | 0 | 35 | 31 | 1 | 3 | 0 | 0 | 5 |
| Louisiana | 274 | 235 | 173 | 55 | 5 | 2 | 0 | 0 | 0 | 38 | 29 | 0 | 9 | 0 | 0 | 1 |
| New Mexico | 149 | 130 | 90 | 40 | 0 | 0 | 0 | 0 | 0 | 18 | 11 | 1 | 6 | 0 | 1 | 0 |
| Oklahoma | 266 | 214 | 184 | 29 | 0 | 0 | 0 | 0 | 1 | 47 | 41 | 2 | 4 | 1 | 0 | 4 |
| Texas | 1,000 | 805 | 555 | 246 | 3 | 0 | 1 | 0 | 0 | 184 | 146 | 4 | 34 | 2 | 3 | 6 |
| Region VI | 1,881 | 1,536 | 1,128 | 395 | 9 | 2 | 1 | 0 | 1 | 322 | 258 | 8 | 56 | 3 | 4 | 16 |
| Iowa | 299 | 198 | 148 | 46 | 4 | 0 | 0 | 0 | 0 | 98 | 75 | 3 | 20 | 0 | 3 | 0 |
| Kansas | 259 | 206 | 143 | 57 | 2 | 0 | 0 | 0 | 4 | 51 | 42 | 1 | 8 | 0 | 0 | 2 |
| Missouri | 1,627 | 1,110 | 732 | 261 | 59 | 15 | 24 | 1 | 18 | 508 | 454 | 11 | 43 | 7 | 0 | 2 |
| Nebraska | 311 | 279 | 243 | 28 | 3 | 1 | 0 | 0 | 4 | 32 | 24 | 1 | 7 | 0 | 0 | 0 |
| Region VII | 2,496 | 1,793 | 1,266 | 392 | 68 | 16 | 24 | 1 | 26 | 689 | 595 | 16 | 78 | 7 | 3 | 4 |
| Colorado | 529 | 451 | 325 | 113 | 7 | 0 | 2 | 0 | 4 | 76 | 51 | 5 | 20 | 1 | 0 | 1 |
| Montana | 191 | 110 | 83 | 21 | 6 | 0 | 0 | 0 | 0 | 71 | 48 | 8 | 15 | 6 | 0 | 4 |
| North Dakota | 39 | 14 | 13 | 1 | 0 | 0 | 0 | 0 | 0 | 23 | 18 | 1 | 5 | 0 | 0 | 2 |
| South Dakota | 37 | 27 | 23 | 4 | 0 | 0 | 0 | 0 | 0 | 9 | 8 | 0 | 1 | 0 | 0 | 1 |
| Utah | 131 | 87 | 75 | 9 | 2 | 0 | 1 | 0 | 0 | 41 | 36 | 2 | 3 | 0 | 1 | 2 |
| Wyoming | 58 | 45 | 38 | 5 | 0 | 0 | 0 | 2 | 0 | 13 | 11 | 0 | 2 | 0 | 0 | 0 |
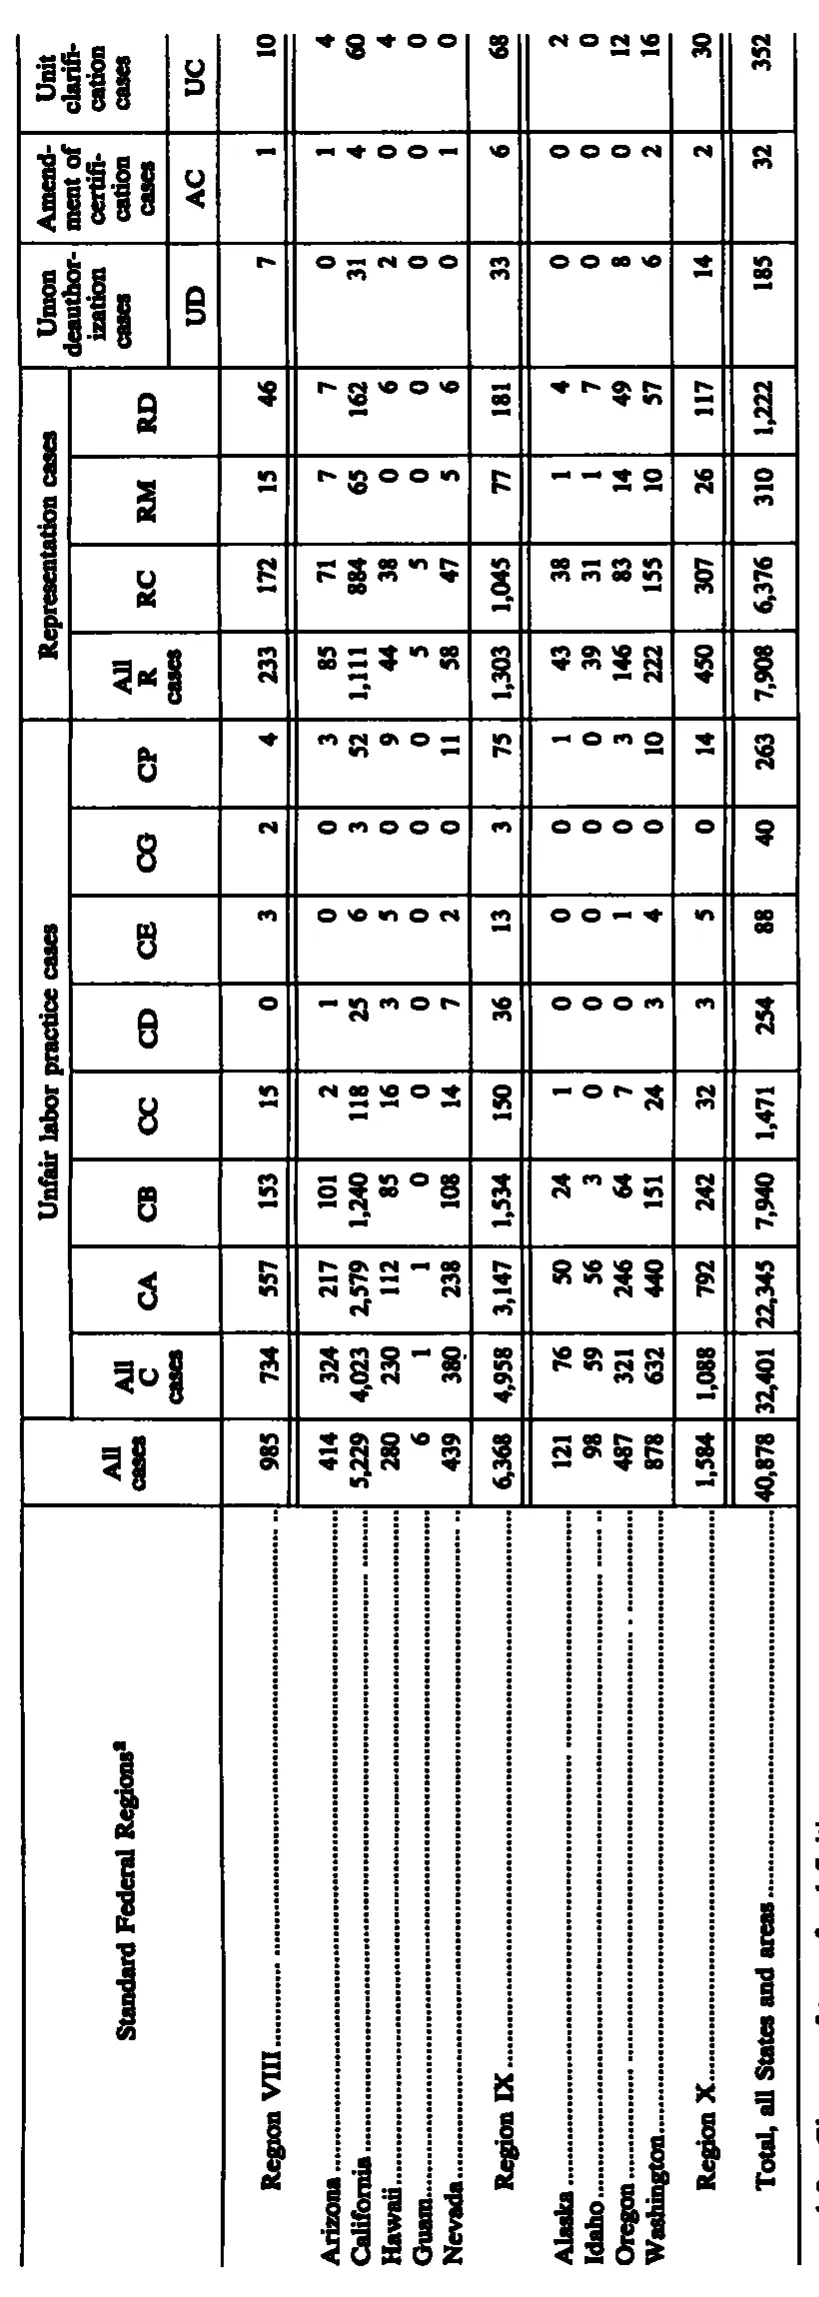
| Standard Federal Regions | All cases | Unfair labor practice cases | Unfair labor practice cases | Unfair labor practice cases | Unfair labor practice cases | Unfair labor practice cases | Unfair labor practice cases | Unfair labor practice cases | Unfair labor practice cases | Representation cases | Representation cases | Representation cases | Representation cases | Union deauthorization cases | Amendment of certification cases | Unit clarification cases |
| Standard Federal Regions | All cases | All C cases | CA | CB | CC | CD | CE | CG | CP | All R cases | RC | RM | RD | UD | AC | UC |
| Region VIII | 985 | 734 | 557 | 153 | 15 | 0 | 3 | 2 | 4 | 233 | 172 | 15 | 46 | 7 | 1 | 10 |
| Arizona | 414 | 324 | 217 | 101 | 2 | 1 | 0 | 0 | 3 | 85 | 71 | 7 | 7 | 0 | 1 | 4 |
| California | 5,229 | 4,023 | 2,579 | 1,240 | 118 | 25 | 6 | 3 | 52 | 1,111 | 884 | 65 | 162 | 31 | 4 | 60 |
| Hawaii | 280 | 230 | 112 | 85 | 16 | 3 | 5 | 0 | 9 | 44 | 38 | 0 | 6 | 2 | 0 | 4 |
| Guam | 6 | 1 | 1 | 0 | 0 | 0 | 0 | 0 | 0 | 5 | 5 | 0 | 0 | 0 | 0 | 0 |
| Nevada | 439 | 380 | 238 | 108 | 14 | 7 | 2 | 0 | 11 | 58 | 47 | 5 | 6 | 0 | 1 | 0 |
| Region IX | 6,368 | 4,958 | 3,147 | 1,534 | 150 | 36 | 13 | 3 | 75 | 1,303 | 1,045 | 77 | 181 | 33 | 6 | 68 |
| Alaska | 121 | 76 | 50 | 24 | 1 | 0 | 0 | 0 | 1 | 43 | 38 | 1 | 4 | 0 | 0 | 2 |
| Idaho | 98 | 59 | 56 | 3 | 0 | 0 | 0 | 0 | 0 | 39 | 31 | 1 | 7 | 0 | 0 | 0 |
| Oregon | 487 | 321 | 246 | 64 | 7 | 0 | 1 | 0 | 3 | 146 | 83 | 14 | 49 | 8 | 0 | 12 |
| Washington | 878 | 632 | 440 | 151 | 24 | 3 | 4 | 0 | 10 | 222 | 155 | 10 | 57 | 6 | 2 | 16 |
| Region X | 1,584 | 1,088 | 792 | 242 | 32 | 3 | 5 | 0 | 14 | 450 | 307 | 26 | 117 | 14 | 2 | 30 |
| Total, all States and areas | 40,878 | 32,401 | 22,345 | 7,940 | 1,471 | 254 | 88 | 40 | 263 | 7,908 | 6,376 | 310 | 1,222 | 185 | 32 | 352 |
794 of 795 figures sit in a row or column sum that works out. 2 cells break a sum: 'North Dakota', column 11: prints 23, columns 12 to 14 add to 24; 'Region VIII', column 13: prints 15, rows 'Colorado' to 'Wyoming' add to 16.
Reader’s notes
p. 218. The crop is the first page of a multi-page table and is cut off at the bottom: the Region IV block is incomplete (it ends mid-block at "North Carolina", with no Region IV subtotal), and the remaining regions and the national total continue on the following page(s). No footnote text is printed on this crop; the raised "2" on the stub heading "Standard Federal Regions" is a marker whose text appears elsewhere, so `footnotes` is empty. Seventeen columns: stub, "All cases", eight unfair-labor-practice columns (All C cases, CA, CB, CC, CD, CE, CG, CP), four representation columns (All R cases, RC, RM, RD), then UD, AC and UC. The three right-hand headings ("Union deauthorization cases", "Amendment of certification cases", "Unit clarification cases") sit over a second heading level giving their codes UD, AC and UC; the stub heading, "All cases" and the code columns span all three heading levels and are repeated accordingly. Every data row and every region subtotal was checked against the printed figures and is internally consistent (component columns sum to "All C cases" and "All R cases", and those plus UD, AC and UC sum to "All cases"; the state rows sum to each Region line), so no misprints are suspected. The one value that looks anomalous at a glance, West Virginia CC = 263 (far larger than any other CC entry), is confirmed by the row and column totals: 427+261+263+5+3+0+9 = 968, and the Region III CC total of 440 requires it.
p. 219. Continuation crop: the table starts mid-way through the Region IV block (South Carolina is the first printed row; earlier States of that region are on the previous page) and is cut off at the bottom in the middle of the Region VIII block (Colorado through Wyoming are printed, but that region's total row falls below the crop). No footnote texts are printed on this crop, so `footnotes` is empty. Stub heading marker: "Standard Federal Regions" carries a small raised character that I read as a superscript 2; at this scan resolution it could also be a raised 1 or a raised letter "a". The marker is recorded as "^2" in all three header levels. Suspected misprint, North Dakota row: the Representation-cases subcolumns RC 18 + RM 1 + RD 5 sum to 24, but the printed "All R cases" cell for that row is 23. The 23 is the value consistent with the rest of the row (All C 14 + All R 23 + UD 0 + AC 0 + UC 2 = All cases 39, as printed), so one of the three subcolumn digits is probably a misprint or a scan artifact; all four cells are transcribed exactly as printed. Every other row on the page is internally consistent (All cases = All C + All R + UD + AC + UC; All C = CA+CB+CC+CD+CE+CG+CP; All R = RC+RM+RD). Two faint single digits in the bottom block sit between baselines and were ambiguous on first reading: the UD column for Montana (6) and for North Dakota (0). The assignment given here is the one that makes both rows add to their printed "All cases" totals (Montana 110+71+6+0+4 = 191; North Dakota 14+23+0+0+2 = 39); the alternative pairing fails both checks. The Oklahoma "RC" cell is printed with a broken second digit that reads as "4l"; it is transcribed as 41, which is what the Region VI subtotal supports. A stray ink speck sits just left of the Iowa "All C cases" value (198); it is not a footnote marker and is not transcribed.
p. 220. The page is a landscape table printed sideways; the crop is rotated 90 degrees relative to reading orientation, but all cells were legible. 17 columns: stub, All cases, then the eight "Unfair labor practice cases" columns (All C cases, CA, CB, CC, CD, CE, CG, CP), the four "Representation cases" columns (All R cases, RC, RM, RD), then UD, AC, UC. The crop is cut off at the bottom edge: a line of footnote text is partly visible below the table's closing rule but is sliced through and not legible, so `footnotes` is left empty rather than reconstructed. At least one footnote marker is printed on the table (the raised character after the stub heading "Standard Federal Regions"), so the table does carry footnotes that this crop does not show in full. The raised character on the stub heading is read as a 2 ("Standard Federal Regions^2"); it is small and slightly broken in the scan, so a 1 cannot be entirely excluded. This crop continues the table from the previous page: the "Region VIII" line is a region total whose component States appear on the earlier page, so no State rows precede it here. "Region IX" and "Region X" are likewise total lines printed after their State rows. Arithmetic check (not applied to the cells, which are as printed): every row's component columns sum to its "All C cases", "All R cases" and "All cases" totals, and the State rows sum exactly to the Region IX, Region X and grand-total lines in all 16 numeric columns. No misprints detected.
Source image
Source data: U.S. NLRB Annual Reports (public domain). Reconstruction by NLRB Stats Archive. Read by claude-opus-5 (effort max, prompt extract_v1) from the 300-dpi scan; stitched by page. Updated October 2026.