NLRB Stats Archive › Annual Reports › FY1989 › Geographic Distribution of Cases Received, Fiscal Year 1989
Geographic Distribution of Cases Received, Fiscal Year 1989
Stitched from pp. 215–217; a later page prints different headings, kept as rows.
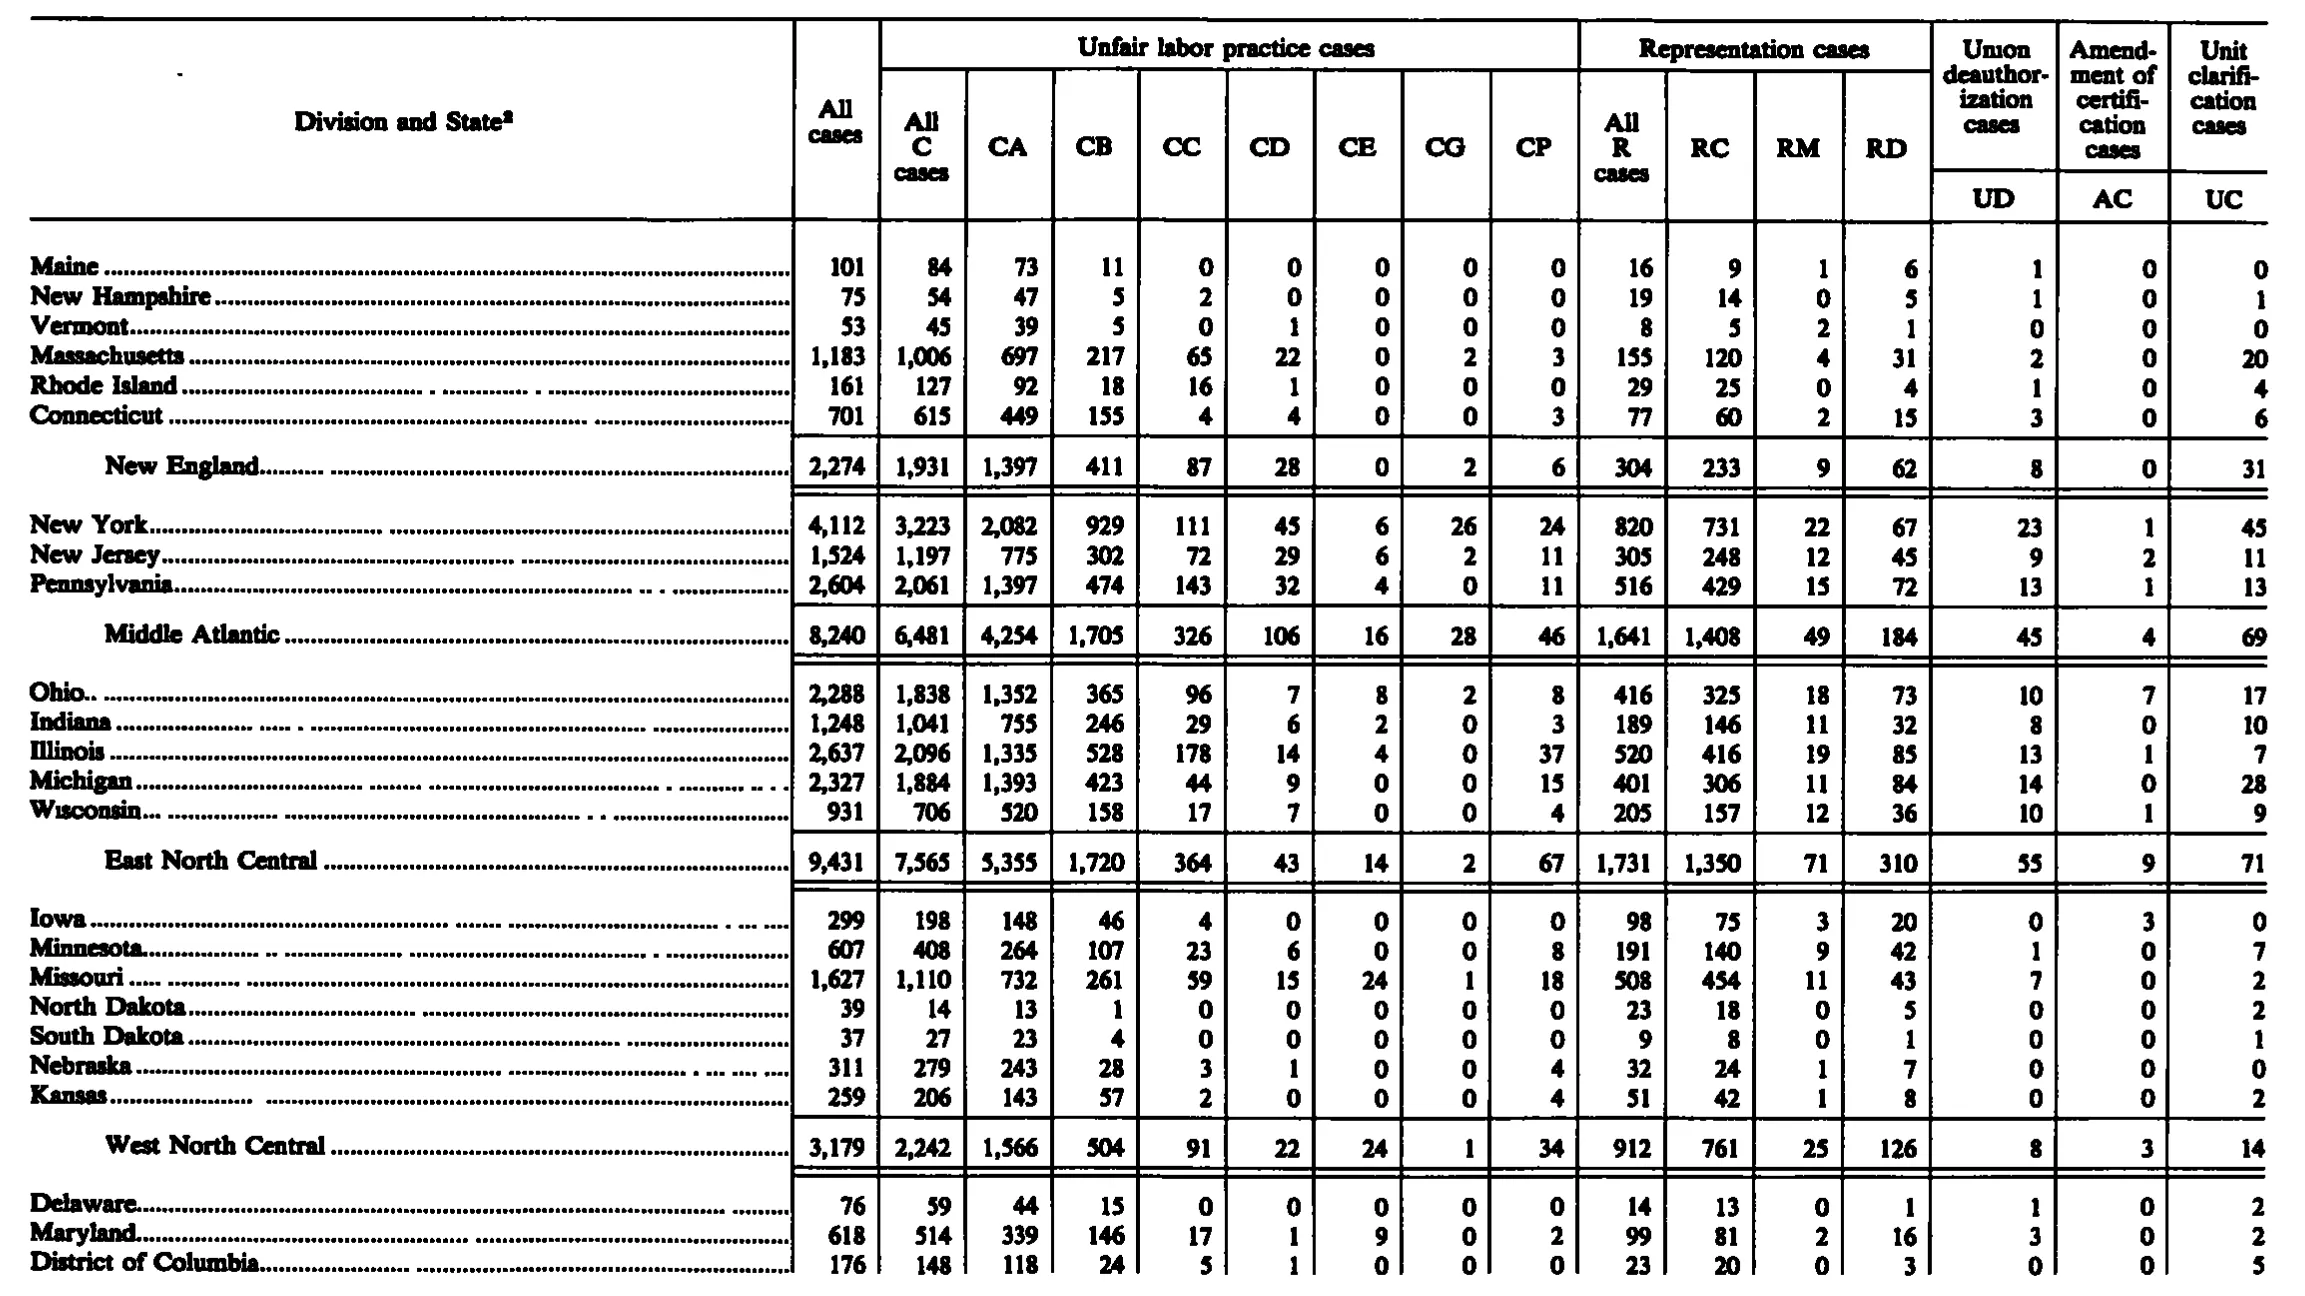
| Division and State | All cases | Unfair labor practice cases | Representation cases | Union deauthorization cases | Amendment of certification cases | Unit clarification cases | ||||||||||
|---|---|---|---|---|---|---|---|---|---|---|---|---|---|---|---|---|
| Division and State | All cases | All C cases | CA | CB | CC | CD | CE | CG | CP | All R cases | RC | RM | RD | Union deauthorization cases | Amendment of certification cases | Unit clarification cases |
| Division and State | All cases | All C cases | CA | CB | CC | CD | CE | CG | CP | All R cases | RC | RM | RD | UD | AC | UC |
| Maine | 101 | 84 | 73 | 11 | 0 | 0 | 0 | 0 | 0 | 16 | 9 | 1 | 6 | 1 | 0 | 0 |
| New Hampshire | 75 | 54 | 47 | 5 | 2 | 0 | 0 | 0 | 0 | 19 | 14 | 0 | 5 | 1 | 0 | 1 |
| Vermont | 53 | 45 | 39 | 5 | 0 | 1 | 0 | 0 | 0 | 8 | 5 | 2 | 1 | 0 | 0 | 0 |
| Massachusetts | 1,183 | 1,006 | 697 | 217 | 65 | 22 | 0 | 2 | 3 | 155 | 120 | 4 | 31 | 2 | 0 | 20 |
| Rhode Island | 161 | 127 | 92 | 18 | 16 | 1 | 0 | 0 | 0 | 29 | 25 | 0 | 4 | 1 | 0 | 4 |
| Connecticut | 701 | 615 | 449 | 155 | 4 | 4 | 0 | 0 | 3 | 77 | 60 | 2 | 15 | 3 | 0 | 6 |
| New England | 2,274 | 1,931 | 1,397 | 411 | 87 | 28 | 0 | 2 | 6 | 304 | 233 | 9 | 62 | 8 | 0 | 31 |
| New York | 4,112 | 3,223 | 2,082 | 929 | 111 | 45 | 6 | 26 | 24 | 820 | 731 | 22 | 67 | 23 | 1 | 45 |
| New Jersey | 1,524 | 1,197 | 775 | 302 | 72 | 29 | 6 | 2 | 11 | 305 | 248 | 12 | 45 | 9 | 2 | 11 |
| Pennsylvania | 2,604 | 2,061 | 1,397 | 474 | 143 | 32 | 4 | 0 | 11 | 516 | 429 | 15 | 72 | 13 | 1 | 13 |
| Middle Atlantic | 8,240 | 6,481 | 4,254 | 1,705 | 326 | 106 | 16 | 28 | 46 | 1,641 | 1,408 | 49 | 184 | 45 | 4 | 69 |
| Ohio | 2,288 | 1,838 | 1,352 | 365 | 96 | 7 | 8 | 2 | 8 | 416 | 325 | 18 | 73 | 10 | 7 | 17 |
| Indiana | 1,248 | 1,041 | 755 | 246 | 29 | 6 | 2 | 0 | 3 | 189 | 146 | 11 | 32 | 8 | 0 | 10 |
| Illinois | 2,637 | 2,096 | 1,335 | 528 | 178 | 14 | 4 | 0 | 37 | 520 | 416 | 19 | 85 | 13 | 1 | 7 |
| Michigan | 2,327 | 1,884 | 1,393 | 423 | 44 | 9 | 0 | 0 | 15 | 401 | 306 | 11 | 84 | 14 | 0 | 28 |
| Wisconsin | 931 | 706 | 520 | 158 | 17 | 7 | 0 | 0 | 4 | 205 | 157 | 12 | 36 | 10 | 1 | 9 |
| East North Central | 9,431 | 7,565 | 5,355 | 1,720 | 364 | 43 | 14 | 2 | 67 | 1,731 | 1,350 | 71 | 310 | 55 | 9 | 71 |
| Iowa | 299 | 198 | 148 | 46 | 4 | 0 | 0 | 0 | 0 | 98 | 75 | 3 | 20 | 0 | 3 | 0 |
| Minnesota | 607 | 408 | 264 | 107 | 23 | 6 | 0 | 0 | 8 | 191 | 140 | 9 | 42 | 1 | 0 | 7 |
| Missouri | 1,627 | 1,110 | 732 | 261 | 59 | 15 | 24 | 1 | 18 | 508 | 454 | 11 | 43 | 7 | 0 | 2 |
| North Dakota | 39 | 14 | 13 | 1 | 0 | 0 | 0 | 0 | 0 | 23 | 18 | 0 | 5 | 0 | 0 | 2 |
| South Dakota | 37 | 27 | 23 | 4 | 0 | 0 | 0 | 0 | 0 | 9 | 8 | 0 | 1 | 0 | 0 | 1 |
| Nebraska | 311 | 279 | 243 | 28 | 3 | 1 | 0 | 0 | 4 | 32 | 24 | 1 | 7 | 0 | 0 | 0 |
| Kansas | 259 | 206 | 143 | 57 | 2 | 0 | 0 | 0 | 4 | 51 | 42 | 1 | 8 | 0 | 0 | 2 |
| West North Central | 3,179 | 2,242 | 1,566 | 504 | 91 | 22 | 24 | 1 | 34 | 912 | 761 | 25 | 126 | 8 | 3 | 14 |
| Delaware | 76 | 59 | 44 | 15 | 0 | 0 | 0 | 0 | 0 | 14 | 13 | 0 | 1 | 1 | 0 | 2 |
| Maryland | 618 | 514 | 339 | 146 | 17 | 1 | 9 | 0 | 2 | 99 | 81 | 2 | 16 | 3 | 0 | 2 |
| District of Columbia | 176 | 148 | 118 | 24 | 5 | 1 | 0 | 0 | 0 | 23 | 20 | 0 | 3 | 0 | 0 | 5 |
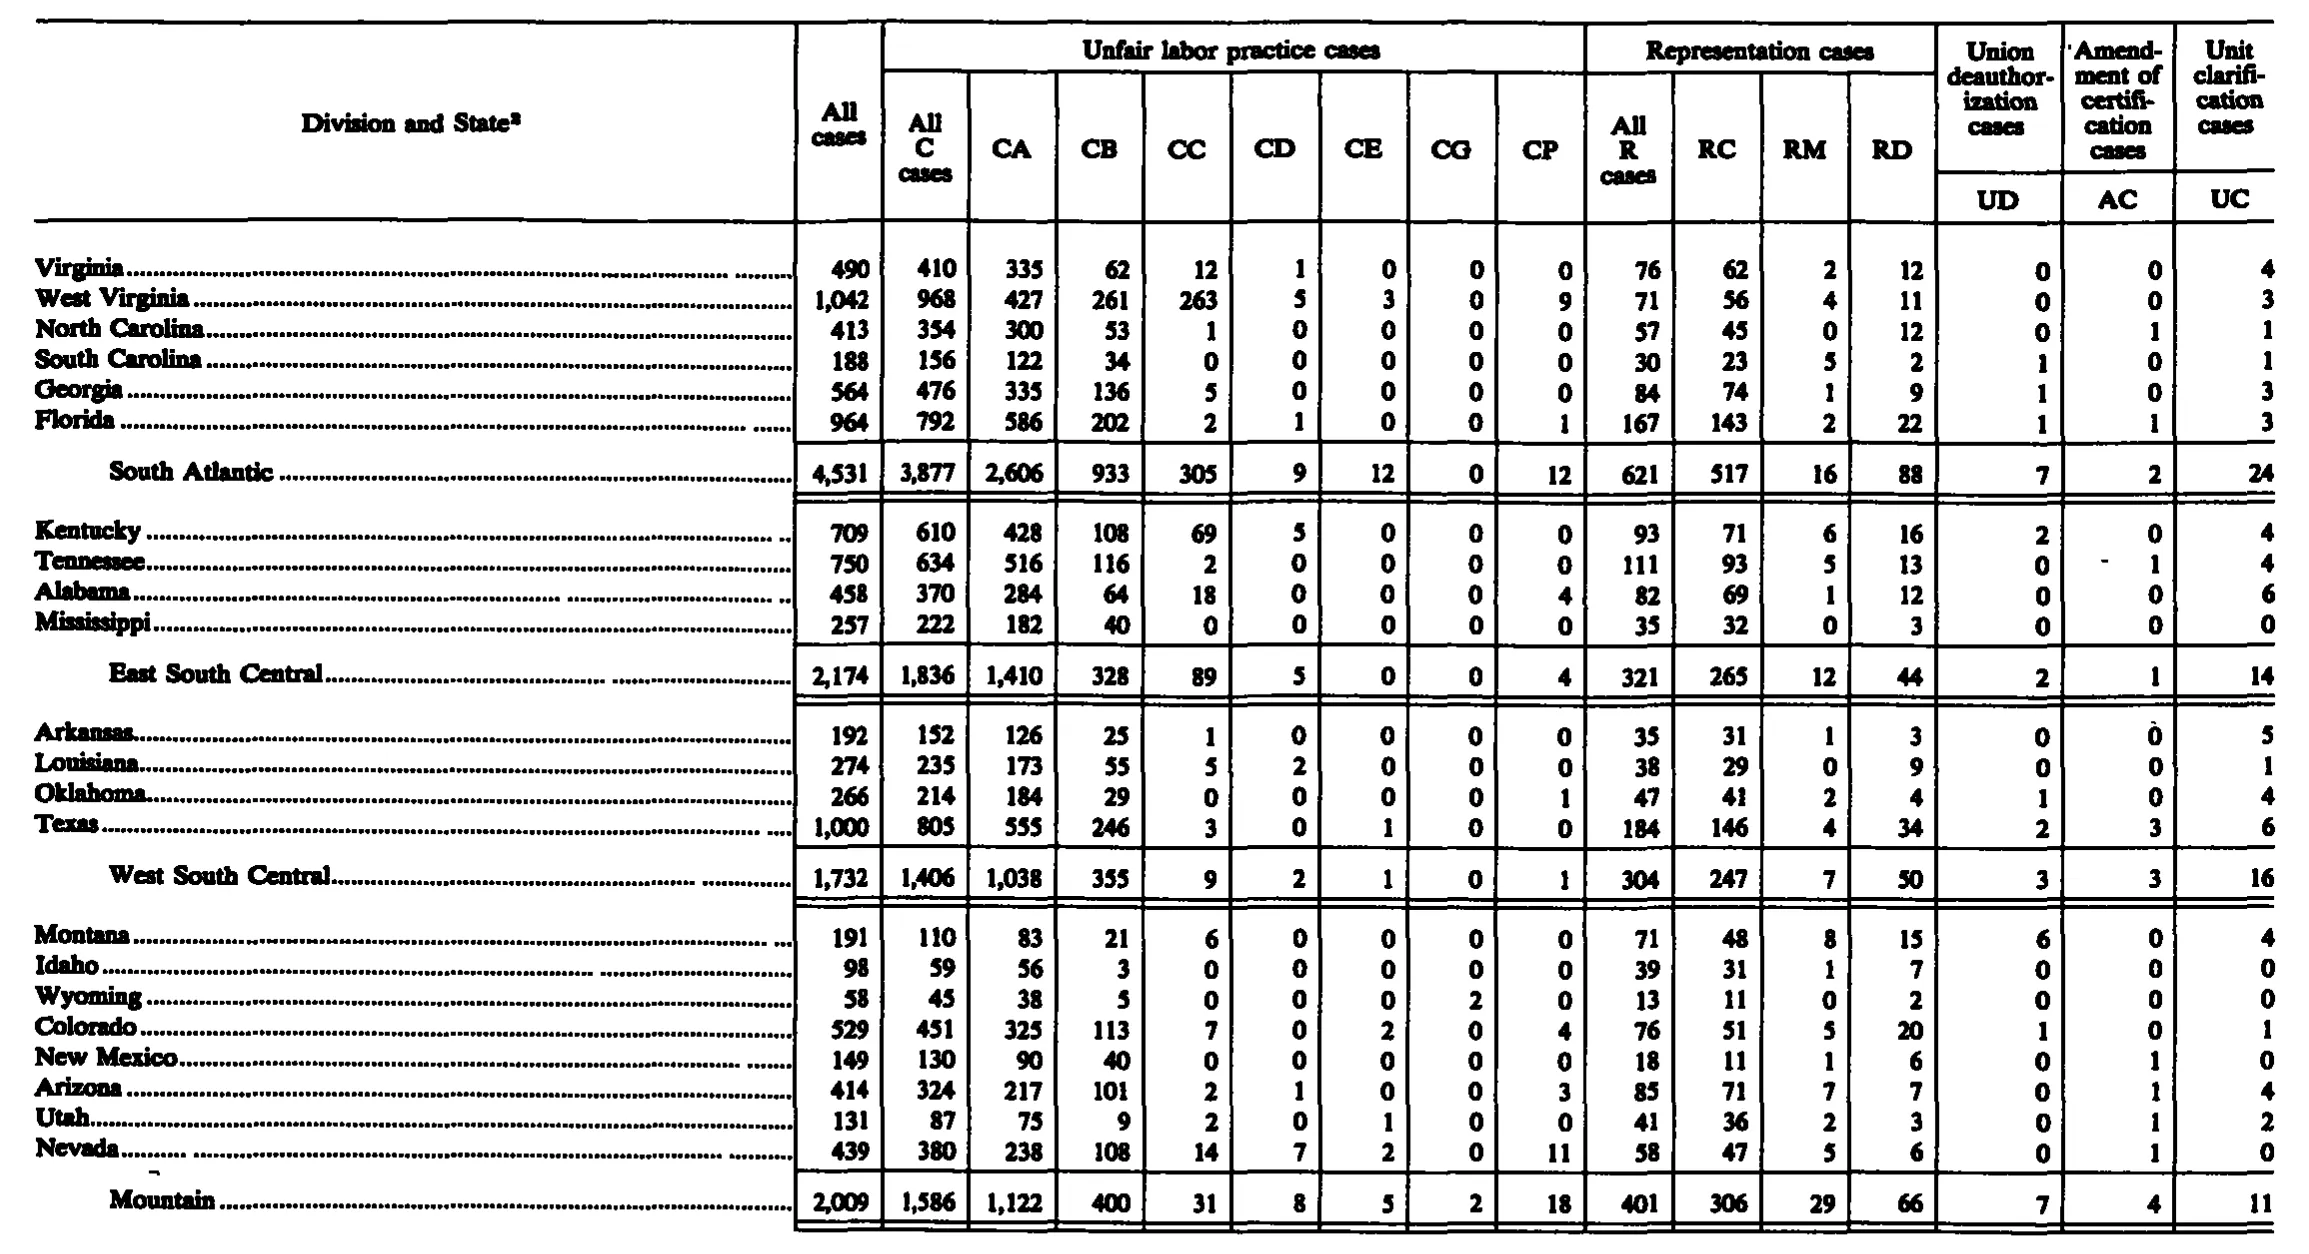
| Virginia | 490 | 410 | 335 | 62 | 12 | 1 | 0 | 0 | 0 | 76 | 62 | 2 | 12 | 0 | 0 | 4 |
| West Virginia | 1,042 | 968 | 427 | 261 | 263 | 5 | 3 | 0 | 9 | 71 | 56 | 4 | 11 | 0 | 0 | 3 |
| North Carolina | 413 | 354 | 300 | 53 | 1 | 0 | 0 | 0 | 0 | 57 | 45 | 0 | 12 | 0 | 1 | 1 |
| South Carolina | 188 | 156 | 122 | 34 | 0 | 0 | 0 | 0 | 0 | 30 | 23 | 5 | 2 | 1 | 0 | 1 |
| Georgia | 564 | 476 | 335 | 136 | 5 | 0 | 0 | 0 | 0 | 84 | 74 | 1 | 9 | 1 | 0 | 3 |
| Florida | 964 | 792 | 586 | 202 | 2 | 1 | 0 | 0 | 1 | 167 | 143 | 2 | 22 | 1 | 1 | 3 |
| South Atlantic | 4,531 | 3,877 | 2,606 | 933 | 305 | 9 | 12 | 0 | 12 | 621 | 517 | 16 | 88 | 7 | 2 | 24 |
| Kentucky | 709 | 610 | 428 | 108 | 69 | 5 | 0 | 0 | 0 | 93 | 71 | 6 | 16 | 2 | 0 | 4 |
| Tennessee | 750 | 634 | 516 | 116 | 2 | 0 | 0 | 0 | 0 | 111 | 93 | 5 | 13 | 0 | 1 | 4 |
| Alabama | 458 | 370 | 284 | 64 | 18 | 0 | 0 | 0 | 4 | 82 | 69 | 1 | 12 | 0 | 0 | 6 |
| Mississippi | 257 | 222 | 182 | 40 | 0 | 0 | 0 | 0 | 0 | 35 | 32 | 0 | 3 | 0 | 0 | 0 |
| East South Central | 2,174 | 1,836 | 1,410 | 328 | 89 | 5 | 0 | 0 | 4 | 321 | 265 | 12 | 44 | 2 | 1 | 14 |
| Arkansas | 192 | 152 | 126 | 25 | 1 | 0 | 0 | 0 | 0 | 35 | 31 | 1 | 3 | 0 | 0 | 5 |
| Louisiana | 274 | 235 | 173 | 55 | 5 | 2 | 0 | 0 | 0 | 38 | 29 | 0 | 9 | 0 | 0 | 1 |
| Oklahoma | 266 | 214 | 184 | 29 | 0 | 0 | 0 | 0 | 1 | 47 | 41 | 2 | 4 | 1 | 0 | 4 |
| Texas | 1,000 | 805 | 555 | 246 | 3 | 0 | 1 | 0 | 0 | 184 | 146 | 4 | 34 | 2 | 3 | 6 |
| West South Central | 1,732 | 1,406 | 1,038 | 355 | 9 | 2 | 1 | 0 | 1 | 304 | 247 | 7 | 50 | 3 | 3 | 16 |
| Montana | 191 | 110 | 83 | 21 | 6 | 0 | 0 | 0 | 0 | 71 | 48 | 8 | 15 | 6 | 0 | 4 |
| Idaho | 98 | 59 | 56 | 3 | 0 | 0 | 0 | 0 | 0 | 39 | 31 | 1 | 7 | 0 | 0 | 0 |
| Wyoming | 58 | 45 | 38 | 5 | 0 | 0 | 0 | 2 | 0 | 13 | 11 | 0 | 2 | 0 | 0 | 0 |
| Colorado | 529 | 451 | 325 | 113 | 7 | 0 | 2 | 0 | 4 | 76 | 51 | 5 | 20 | 1 | 0 | 1 |
| New Mexico | 149 | 130 | 90 | 40 | 0 | 0 | 0 | 0 | 0 | 18 | 11 | 1 | 6 | 0 | 1 | 0 |
| Arizona | 414 | 324 | 217 | 101 | 2 | 1 | 0 | 0 | 3 | 85 | 71 | 7 | 7 | 0 | 1 | 4 |
| Utah | 131 | 87 | 75 | 9 | 2 | 0 | 1 | 0 | 0 | 41 | 36 | 2 | 3 | 0 | 1 | 2 |
| Nevada | 439 | 380 | 238 | 108 | 14 | 7 | 2 | 0 | 11 | 58 | 47 | 5 | 6 | 0 | 1 | 0 |
| Mountain | 2,009 | 1,586 | 1,122 | 400 | 31 | 8 | 5 | 2 | 18 | 401 | 306 | 29 | 66 | 7 | 4 | 11 |
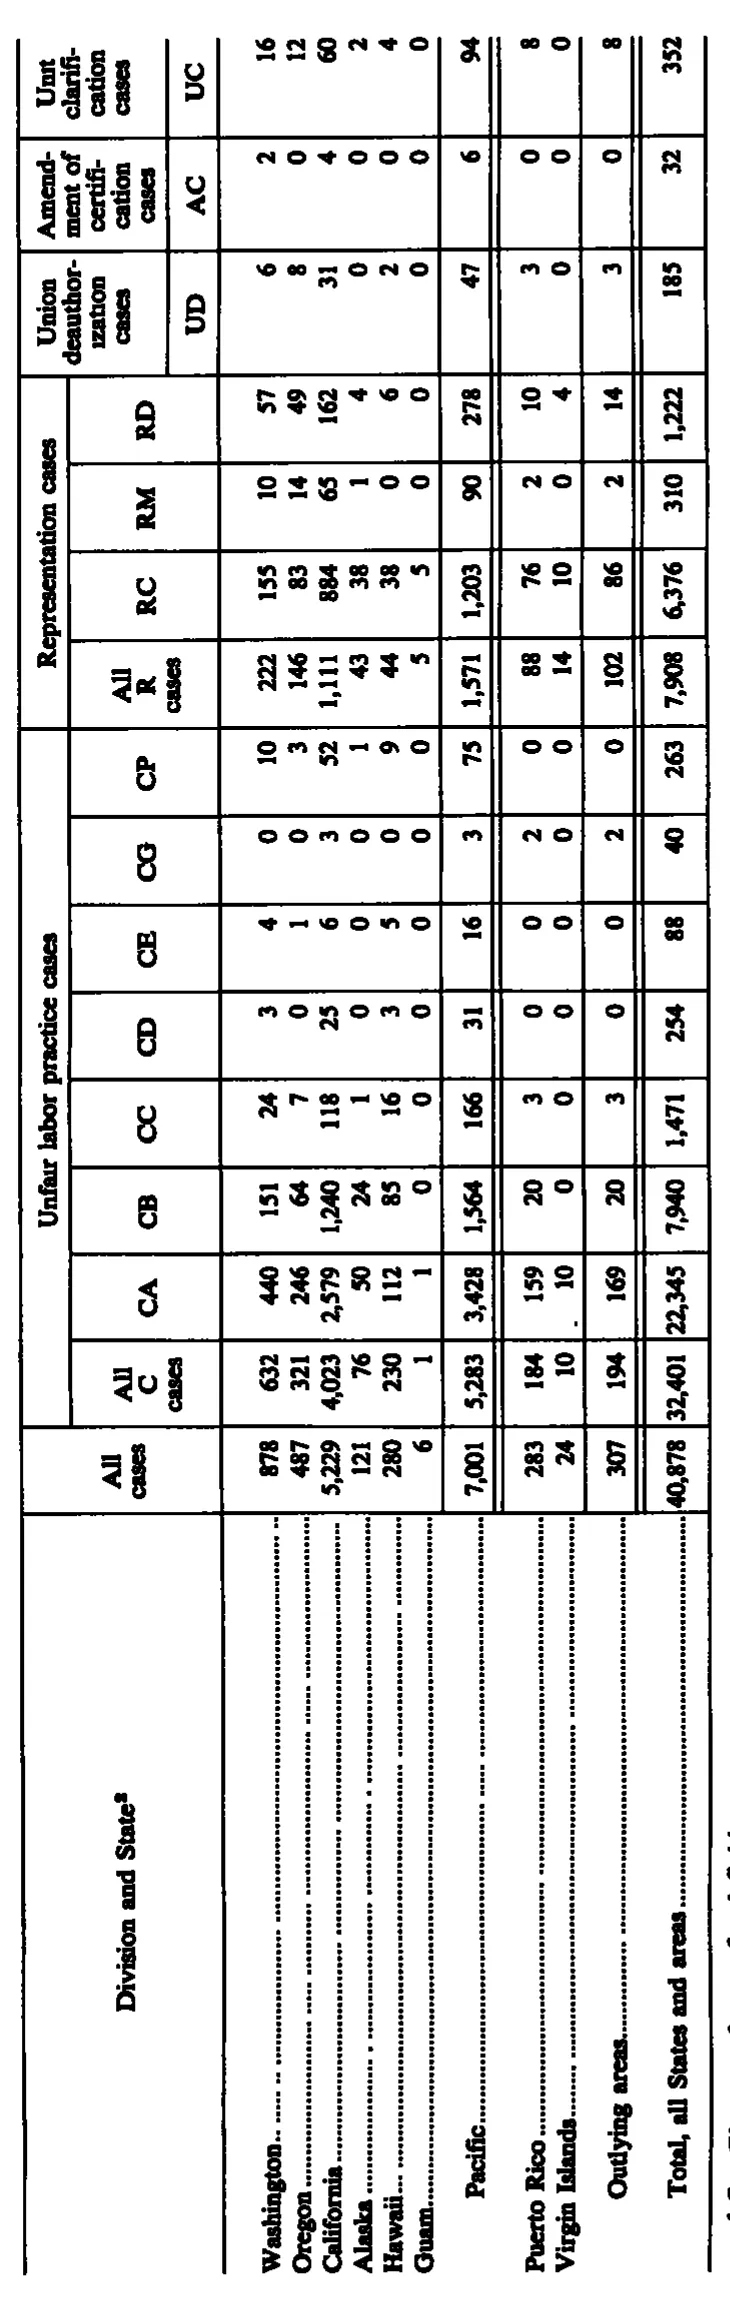
| Division and State | All cases | Unfair labor practice cases | Unfair labor practice cases | Unfair labor practice cases | Unfair labor practice cases | Unfair labor practice cases | Unfair labor practice cases | Unfair labor practice cases | Unfair labor practice cases | Representation cases | Representation cases | Representation cases | Representation cases | Union deauthorization cases | Amendment of certification cases | Unit clarification cases |
| Division and State | All cases | All C cases | CA | CB | CC | CD | CE | CG | CP | All R cases | RC | RM | RD | UD | AC | UC |
| Washington | 878 | 632 | 440 | 151 | 24 | 3 | 4 | 0 | 10 | 222 | 155 | 10 | 57 | 6 | 2 | 16 |
| Oregon | 487 | 321 | 246 | 64 | 7 | 0 | 1 | 0 | 3 | 146 | 83 | 14 | 49 | 8 | 0 | 12 |
| California | 5,229 | 4,023 | 2,579 | 1,240 | 118 | 25 | 6 | 3 | 52 | 1,111 | 884 | 65 | 162 | 31 | 4 | 60 |
| Alaska | 121 | 76 | 50 | 24 | 1 | 0 | 0 | 0 | 1 | 43 | 38 | 1 | 4 | 0 | 0 | 2 |
| Hawaii | 280 | 230 | 112 | 85 | 16 | 3 | 5 | 0 | 9 | 44 | 38 | 0 | 6 | 2 | 0 | 4 |
| Guam | 6 | 1 | 1 | 0 | 0 | 0 | 0 | 0 | 0 | 5 | 5 | 0 | 0 | 0 | 0 | 0 |
| Pacific | 7,001 | 5,283 | 3,428 | 1,564 | 166 | 31 | 16 | 3 | 75 | 1,571 | 1,203 | 90 | 278 | 47 | 6 | 94 |
| Puerto Rico | 283 | 184 | 159 | 20 | 3 | 0 | 0 | 2 | 0 | 88 | 76 | 2 | 10 | 3 | 0 | 8 |
| Virgin Islands | 24 | 10 | 10 | 0 | 0 | 0 | 0 | 0 | 0 | 14 | 10 | 0 | 4 | 0 | 0 | 0 |
| Outlying areas | 307 | 194 | 169 | 20 | 3 | 0 | 0 | 2 | 0 | 102 | 86 | 2 | 14 | 3 | 0 | 8 |
| Total, all States and areas | 40,878 | 32,401 | 22,345 | 7,940 | 1,471 | 254 | 88 | 40 | 263 | 7,908 | 6,376 | 310 | 1,222 | 185 | 32 | 352 |
792 of 792 figures sit in a row or column sum that works out.
Reader’s notes
p. 215. The crop cuts the table off mid-body: it ends at "District of Columbia", which is the third state of an unfinished division group (South Atlantic), and no division subtotal, grand total or footnote text appears on this image. The stub heading carries a superscript footnote marker 2 ("Division and State^2") whose footnote text is not on this crop, so no footnotes are listed. The three right-hand columns are printed as two-level headings: a tall wrapped title ("Union deauthorization cases", "Amendment of certification cases", "Unit clarification cases") spanning the first two header levels, with the codes UD / AC / UC on the bottom level; the codes CA...RD likewise span the second and third levels, so those headings are repeated down. Row labels are followed by long leader dots (some broken or doubled, e.g. "Ohio.." and the ragged rules after Michigan and Kansas); these are dropped. Division subtotal rows (New England, Middle Atlantic, East North Central, West North Central) are printed indented and set off by horizontal rules, but carry values and are transcribed as ordinary rows. All internal arithmetic checks out, which supports the digit reading: for every state row the "All C cases" figure equals CA+CB+CC+CD+CE+CG+CP and "All cases" equals C+R+UD+AC+UC, the "All R cases" figure equals RC+RM+RD, and each of the four division subtotals equals the column-wise sum of its member states in all 16 numeric columns. No misprints detected.
p. 216. Seventeen columns: stub, "All cases", eight columns under "Unfair labor practice cases" (All C cases, CA, CB, CC, CD, CE, CG, CP), four under "Representation cases" (All R cases, RC, RM, RD), then UD, AC, UC. The stub heading carries a raised 2, transcribed as "Division and State^2"; its footnote text is not on this crop. This crop is a continuation page: it is cut off at both ends. The South Atlantic section begins mid-division at Virginia, so the earlier states of that division (Delaware, Maryland, District of Columbia) are on the preceding page and the "South Atlantic" total line is correspondingly larger than the sum of the six states shown here (e.g. All cases 4,531 vs 3,661 for the listed states). Below "Mountain" the table continues onto the next page. No footnotes or caption are visible on this crop. Arithmetic check: every state row and every division subtotal shown here is internally consistent (CA+CB+CC+CD+CE+CG+CP = All C cases; RC+RM+RD = All R cases; All C + All R + UD + AC + UC = All cases), and the East South Central, West South Central and Mountain subtotals equal the sum of their listed states exactly. No misprints detected. Doubtful cells, both minor specks rather than characters: Tennessee, AC column — a short dash-like mark sits just left of the "1" (read as "1", the value that balances the row); Arkansas, AC column — a small mark sits above the "0" (read as "0", which balances the row and the West South Central subtotal). West Virginia's CC value of 263 is unusually large relative to its neighbours but is confirmed by the row sum (427+261+263+5+3+0+9 = 968) and so is transcribed as printed.
p. 217. The table is printed sideways (rotated 90 degrees) on the page; I read it in the printed orientation. 17 columns: stub plus 16 data columns. This is the final portion of a table that continues from earlier pages: the body begins mid-list with the Pacific division's States (Washington through Guam), so there is no top-of-table section for the preceding divisions on this crop. Column headings are printed on this image and are transcribed. A footnote line is present at the very bottom edge of the crop but is cut off and illegible, so `footnotes` is left empty. The stub heading carries a raised marker that I read as a 2 ("Division and State^2"); the corresponding footnote text is not legible on this crop. Blank vertical gaps separate Guam from Pacific and Pacific from Puerto Rico; these are spacing only, not printed rows, so no empty rows were added. Arithmetic cross-checks all hold as printed: in every row the C-type columns (CA through CP) sum to "All C cases", the R-type columns (RC, RM, RD) sum to "All R cases", and All C + All R + UD + AC + UC equals "All cases"; the Pacific, Outlying areas and grand-total rows also equal the sums of their component rows. No suspected misprints.
Source image
Source data: U.S. NLRB Annual Reports (public domain). Reconstruction by NLRB Stats Archive. Read by claude-opus-5 (effort max, prompt extract_v1) from the 300-dpi scan; stitched by page. Updated October 2026.