NLRB Stats Archive › Annual Reports › FY1988 › Proceedings Decided by Circuit Courts of Appeals on Petitions for Enforcement and/or Review of Board Orders, Fiscal Year 1988, Compared With 5-Year Cumulative Totals, Fiscal Years 1983 Through 1987
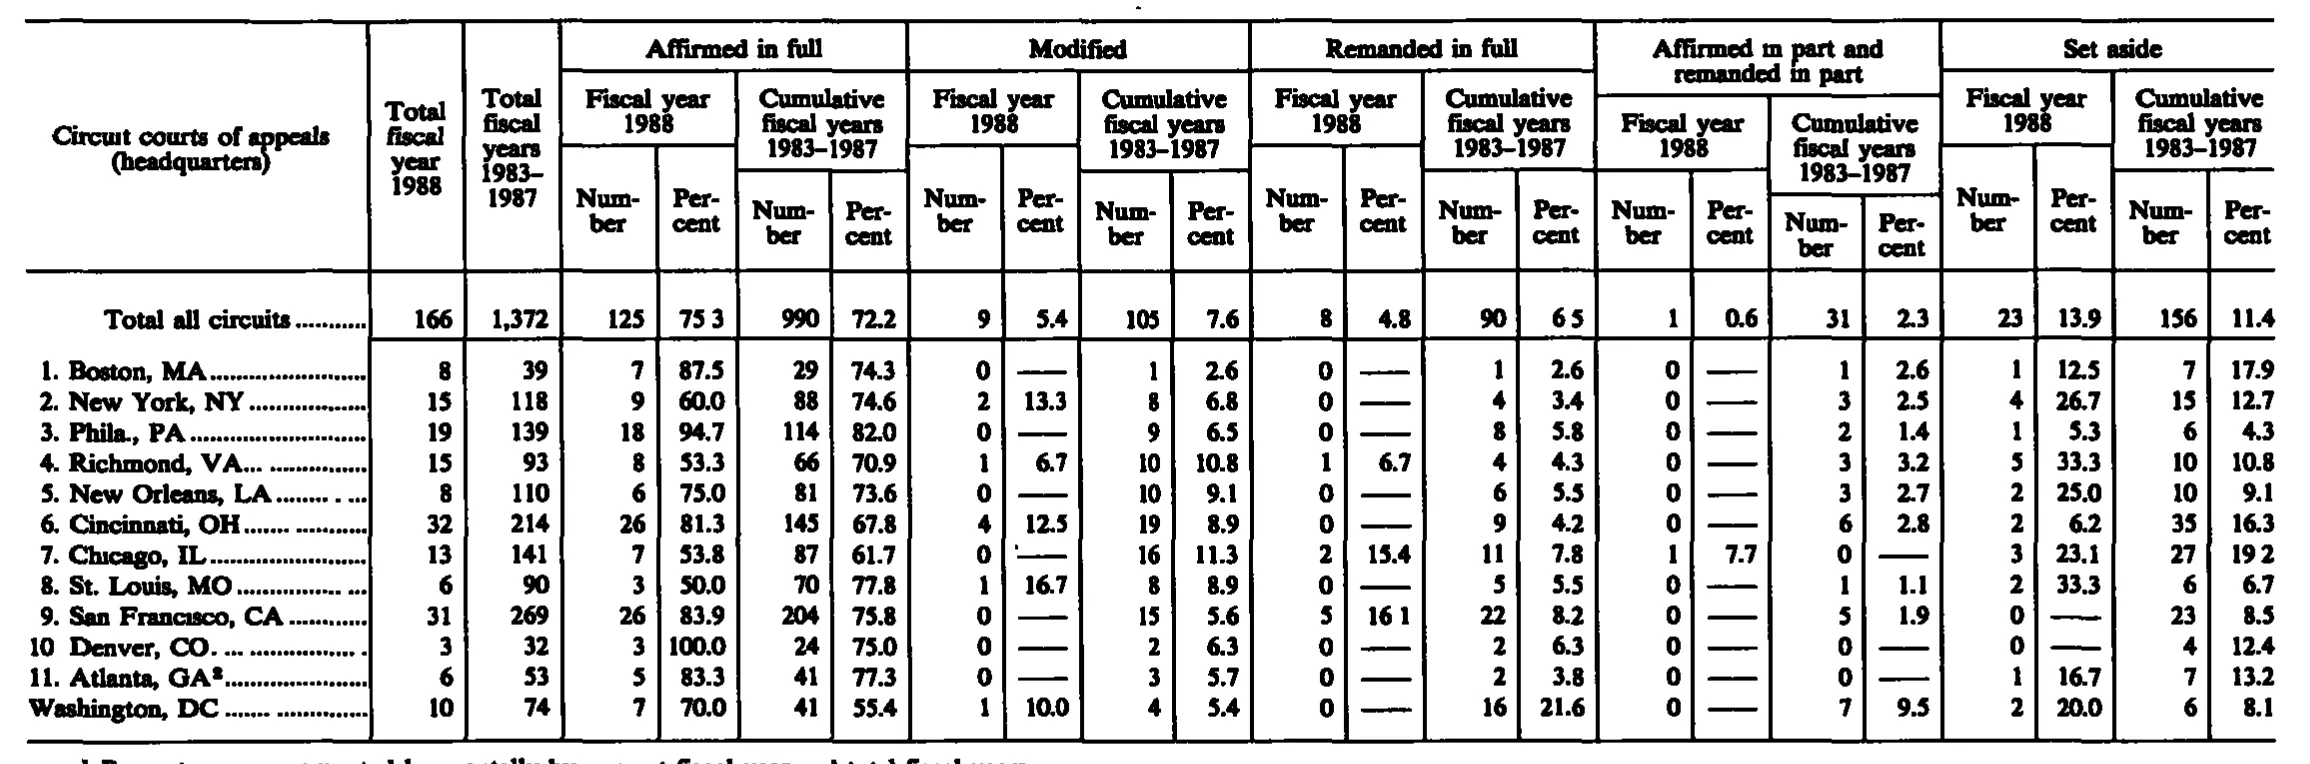
Proceedings Decided by Circuit Courts of Appeals on Petitions for Enforcement and/or Review of Board Orders, Fiscal Year 1988, Compared With 5-Year Cumulative Totals, Fiscal Years 1983 Through 1987
| Circuit courts of appeals (headquarters) | Total fiscal year 1988 | Total fiscal years 1983–1987 | Affirmed in full | Modified | Remanded in full | Affirmed in part and remanded in part | Set aside | |||||||||||||||
|---|---|---|---|---|---|---|---|---|---|---|---|---|---|---|---|---|---|---|---|---|---|---|
| Circuit courts of appeals (headquarters) | Total fiscal year 1988 | Total fiscal years 1983–1987 | Fiscal year 1988 | Cumulative fiscal years 1983–1987 | Fiscal year 1988 | Cumulative fiscal years 1983–1987 | Fiscal year 1988 | Cumulative fiscal years 1983–1987 | Fiscal year 1988 | Cumulative fiscal years 1983–1987 | Fiscal year 1988 | Cumulative fiscal years 1983–1987 | ||||||||||
| Circuit courts of appeals (headquarters) | Total fiscal year 1988 | Total fiscal years 1983–1987 | Number | Percent | Number | Percent | Number | Percent | Number | Percent | Number | Percent | Number | Percent | Number | Percent | Number | Percent | Number | Percent | Number | Percent |
| Total all circuits | 166 | 1,372 | 125 | 75.3 | 990 | 72.2 | 9 | 5.4 | 105 | 7.6 | 8 | 4.8 | 90 | 6.5 | 1 | 0.6 | 31 | 2.3 | 23 | 13.9 | 156 | 11.4 |
| 1. Boston, MA | 8 | 39 | 7 | 87.5 | 29 | 74.3 | 0 | 1 | 2.6 | 0 | 1 | 2.6 | 0 | 1 | 2.6 | 1 | 12.5 | 7 | 17.9 | |||
| 2. New York, NY | 15 | 118 | 9 | 60.0 | 88 | 74.6 | 2 | 13.3 | 8 | 6.8 | 0 | 4 | 3.4 | 0 | 3 | 2.5 | 4 | 26.7 | 15 | 12.7 | ||
| 3. Phila., PA | 19 | 139 | 18 | 94.7 | 114 | 82.0 | 0 | 9 | 6.5 | 0 | 8 | 5.8 | 0 | 2 | 1.4 | 1 | 5.3 | 6 | 4.3 | |||
| 4. Richmond, VA | 15 | 93 | 8 | 53.3 | 66 | 70.9 | 1 | 6.7 | 10 | 10.8 | 1 | 6.7 | 4 | 4.3 | 0 | 3 | 3.2 | 5 | 33.3 | 10 | 10.8 | |
| 5. New Orleans, LA | 8 | 110 | 6 | 75.0 | 81 | 73.6 | 0 | 10 | 9.1 | 0 | 6 | 5.5 | 0 | 3 | 2.7 | 2 | 25.0 | 10 | 9.1 | |||
| 6. Cincinnati, OH | 32 | 214 | 26 | 81.3 | 145 | 67.8 | 4 | 12.5 | 19 | 8.9 | 0 | 9 | 4.2 | 0 | 6 | 2.8 | 2 | 6.2 | 35 | 16.3 | ||
| 7. Chicago, IL | 13 | 141 | 7 | 53.8 | 87 | 61.7 | 0 | 16 | 11.3 | 2 | 15.4 | 11 | 7.8 | 1 | 7.7 | 0 | 3 | 23.1 | 27 | 19.2 | ||
| 8. St. Louis, MO | 6 | 90 | 3 | 50.0 | 70 | 77.8 | 1 | 16.7 | 8 | 8.9 | 0 | 5 | 5.5 | 0 | 1 | 1.1 | 2 | 33.3 | 6 | 6.7 | ||
| 9. San Francisco, CA | 31 | 269 | 26 | 83.9 | 204 | 75.8 | 0 | 15 | 5.6 | 5 | 16.1 | 22 | 8.2 | 0 | 5 | 1.9 | 0 | 23 | 8.5 | |||
| 10. Denver, CO | 3 | 32 | 3 | 100.0 | 24 | 75.0 | 0 | 2 | 6.3 | 0 | 2 | 6.3 | 0 | 0 | 0 | 4 | 12.4 | |||||
| 11. Atlanta, GA | 6 | 53 | 5 | 83.3 | 41 | 77.3 | 0 | 3 | 5.7 | 0 | 2 | 3.8 | 0 | 0 | 1 | 16.7 | 7 | 13.2 | ||||
| Washington, DC | 10 | 74 | 7 | 70.0 | 41 | 55.4 | 1 | 10.0 | 4 | 5.4 | 0 | 16 | 21.6 | 0 | 7 | 9.5 | 2 | 20.0 | 6 | 8.1 | ||
124 of 124 figures sit in a row or column sum that works out.
Reader’s notes
p. 257. Structure: 23 columns — stub, two tall "Total" columns, then five outcome groups (Affirmed in full; Modified; Remanded in full; Affirmed in part and remanded in part; Set aside), each split into "Fiscal year 1988" and "Cumulative fiscal years 1983-1987", each with Number and Percent. Verification: every one of the 22 numeric columns sums down to the "Total all circuits" line exactly, and in every row the five Number cells sum to the row's Total for both the FY1988 and the cumulative panel. This makes the digits and their column placement highly reliable. Faded decimal points: the scan drops the decimal point in four percent cells, which print as "75 3", "6 5", "16 1" and "19 2". I restored the point (75.3, 6.5, 16.1, 19.2) because every other cell in those columns is a one-decimal percent, and for two of them the arithmetic confirms it (125/166 = 75.3; 90/1,372 = 6.5; 5/31 = 16.1). Cells: Total all circuits / Affirmed in full / Fiscal year 1988 / Percent; Total all circuits / Remanded in full / Cumulative / Percent; 9. San Francisco, CA / Remanded in full / Fiscal year 1988 / Percent; 7. Chicago, IL / Set aside / Cumulative / Percent. Two percent cells disagree with their own Number/Total ratio and may be misprints or misreads; both are transcribed as I read them, uncompute d: (a) "7. Chicago, IL" / Set aside / Cumulative / Percent reads 19.2, but 27/141 = 19.1 — this is also one of the cells whose decimal point is lost, so the final digit is the least certain character in the table; (b) "10. Denver, CO" / Set aside / Cumulative / Percent reads 12.4, but 4/32 = 12.5 exactly. No other percent in the table is off by more than truncation. Empty cells: a long dash rule ("——") stands in for a zero percent throughout the body and is transcribed as "". Row label: "10. Denver, CO" — the period after "10" is faint and the character after "CO" may be either a period or the first leader dot; I read it as a leader dot and dropped it. Crop: a footnote line is printed below the table but is sliced off at the bottom edge of the image — only the top sliver of the letters survives. It begins with marker 1 and appears to concern how the percentages are computed, but too little is legible to transcribe, so `footnotes` is empty. Footnote marker 2, attached to "11. Atlanta, GA", has no visible text on this crop either. Headings: "Affirmed in part and remanded in part" prints with a broken "in" that scans as "m"; transcribed as the intended word.
Source image
Source data: U.S. NLRB Annual Reports (public domain). Reconstruction by NLRB Stats Archive. Read by claude-opus-5 (effort max, prompt extract_v1) from the 300-dpi scan; stitched by page. Updated October 2026.