NLRB Stats Archive › Annual Reports › FY1988 › Standard Federal Administrative Regional Distribution of Cases Received, Fiscal Year 1988
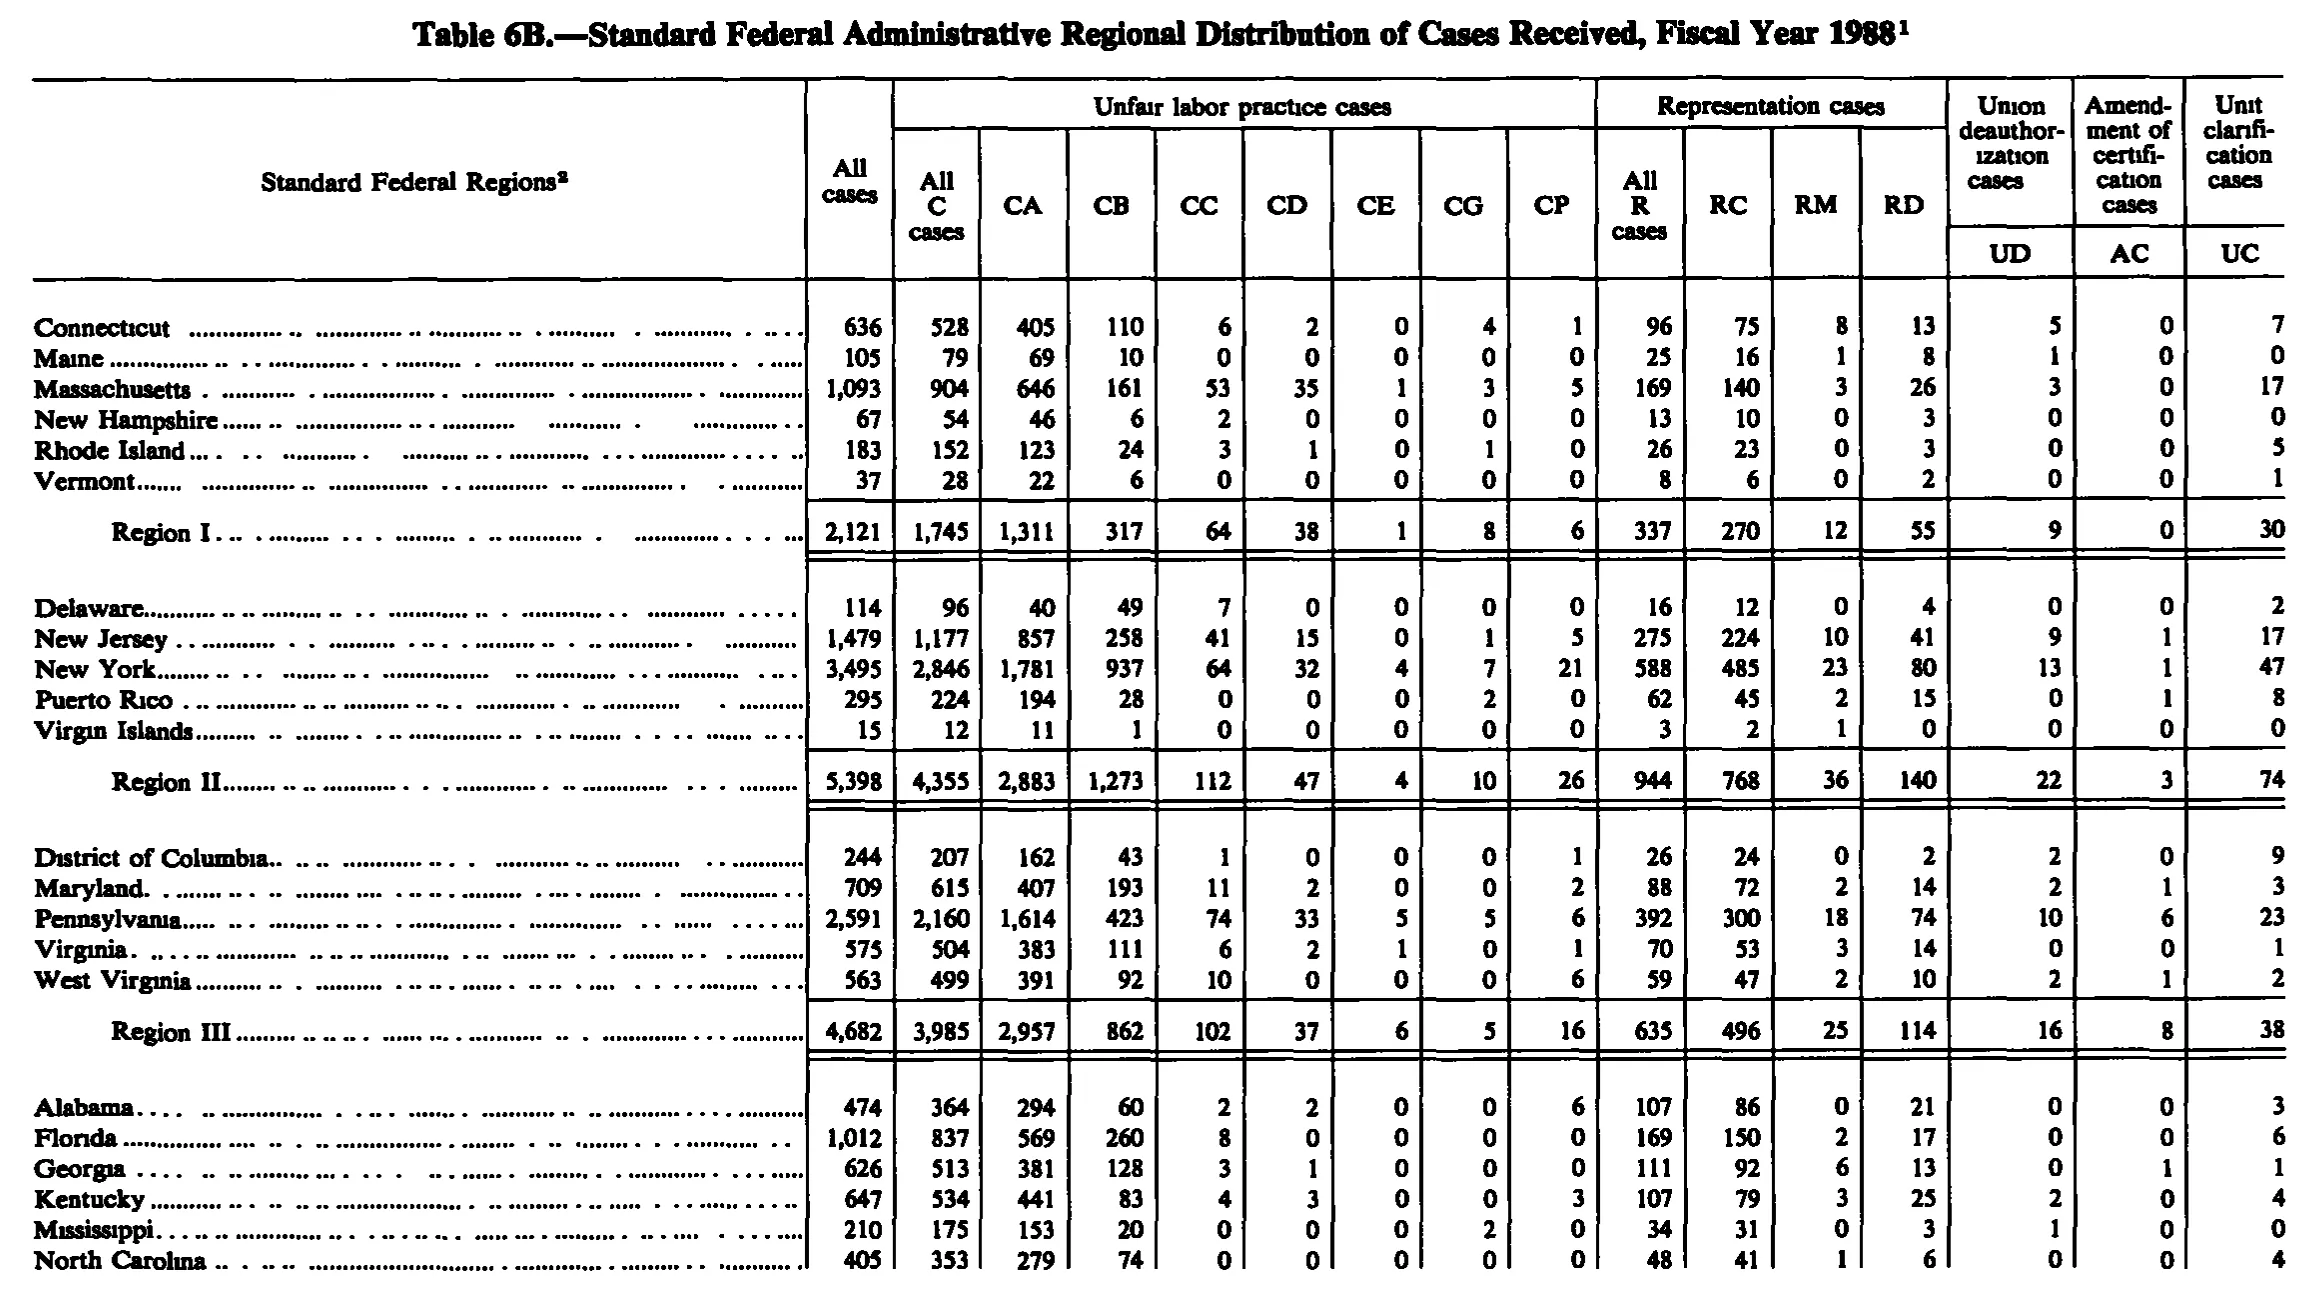
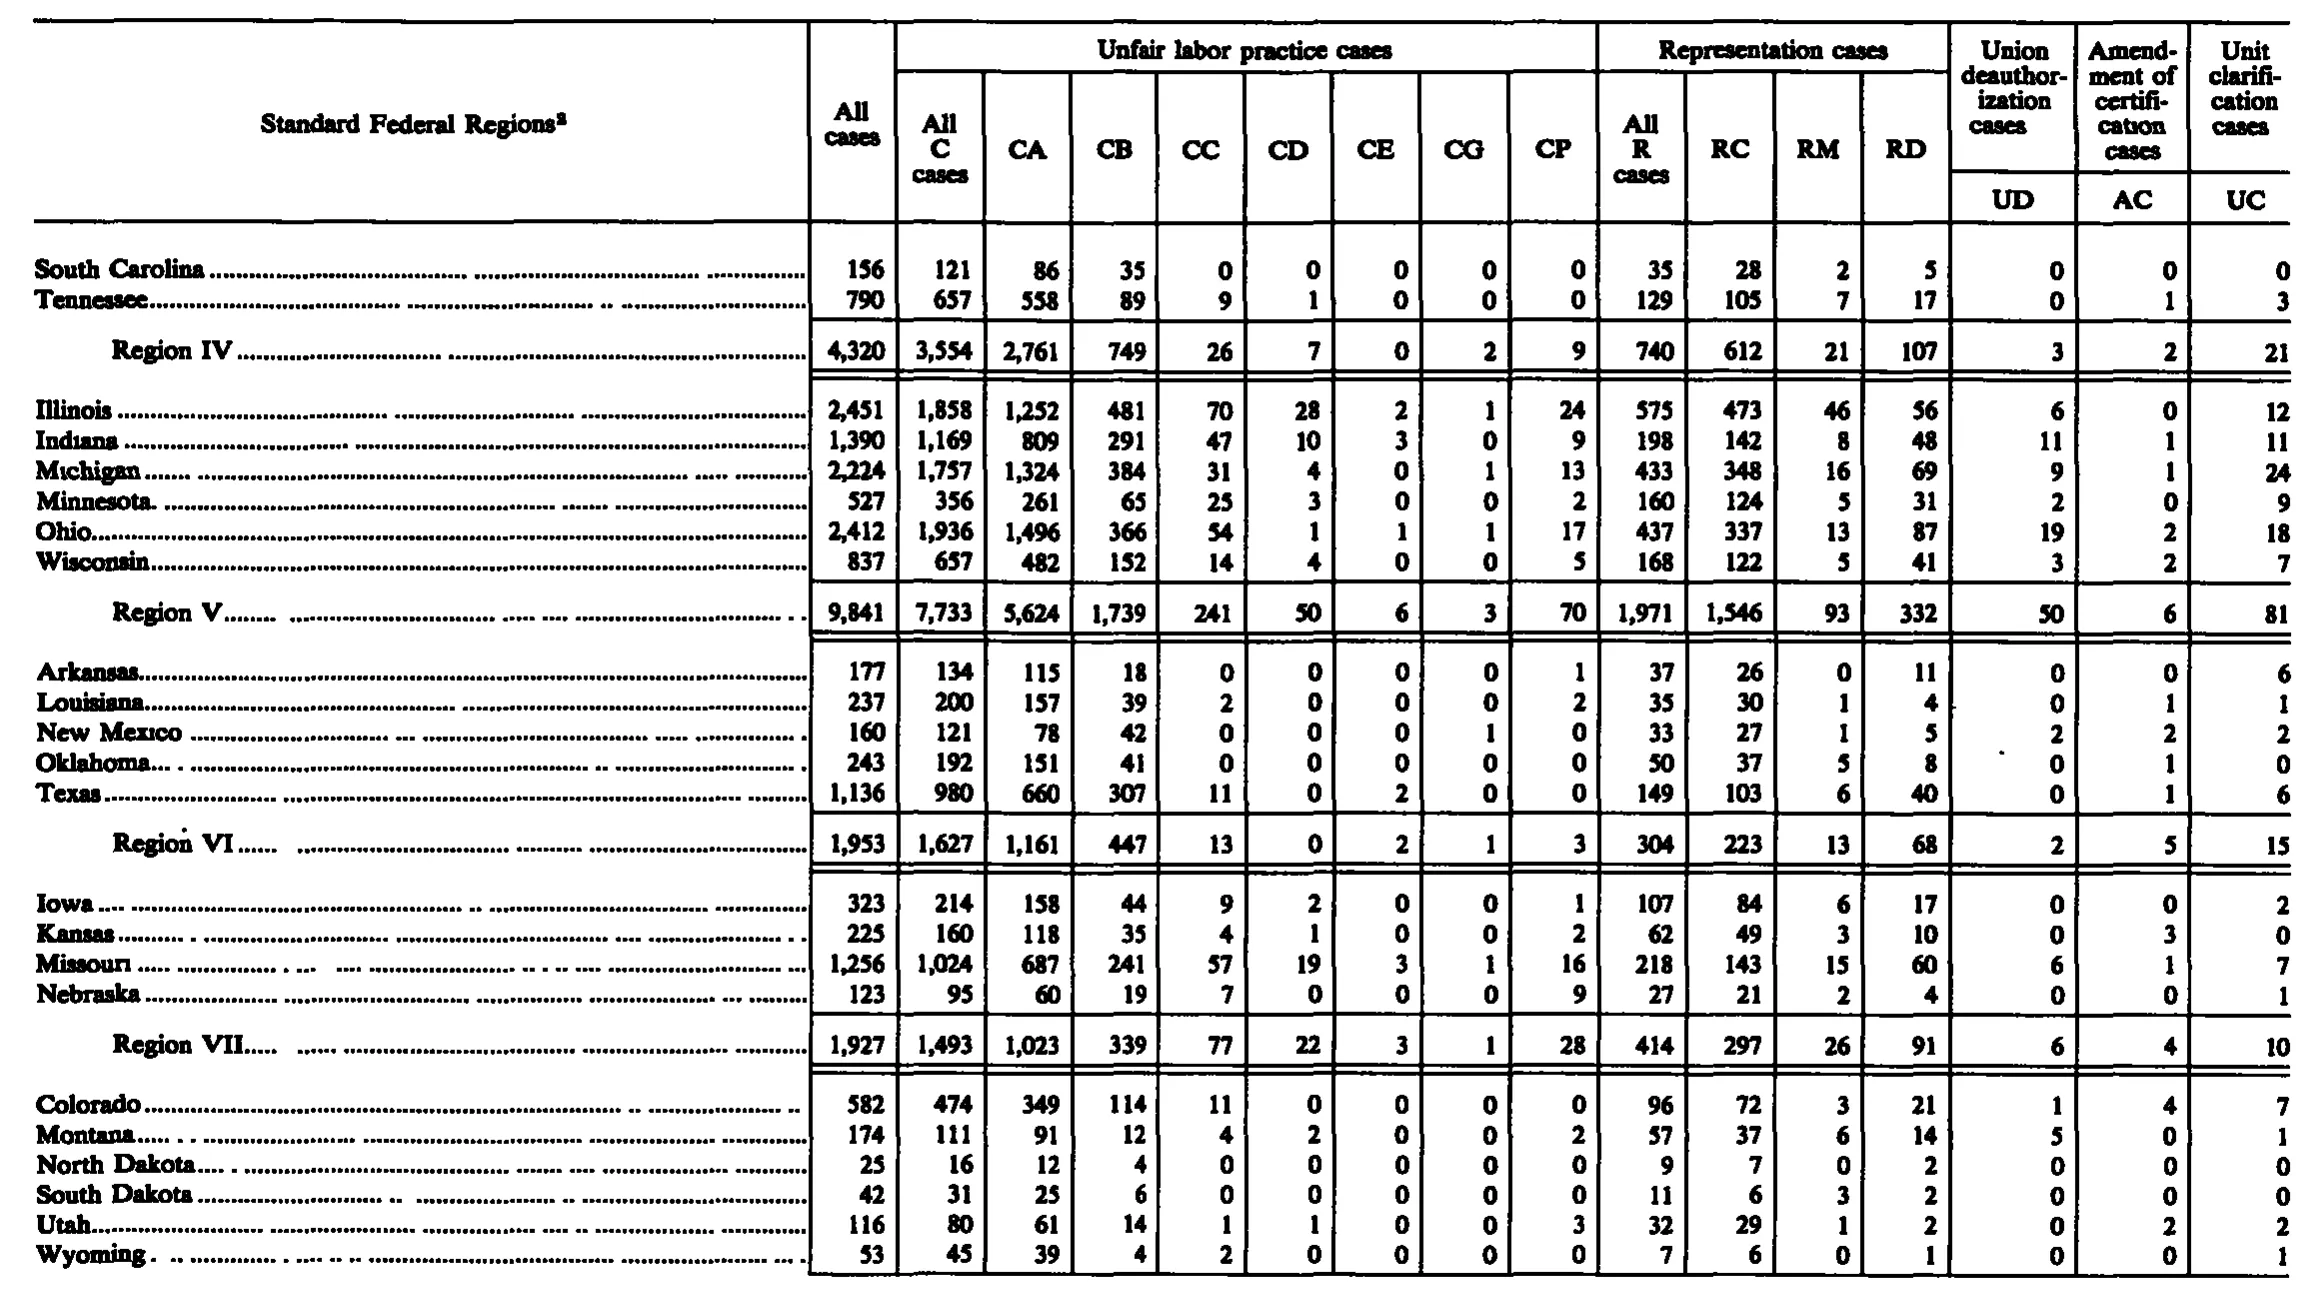
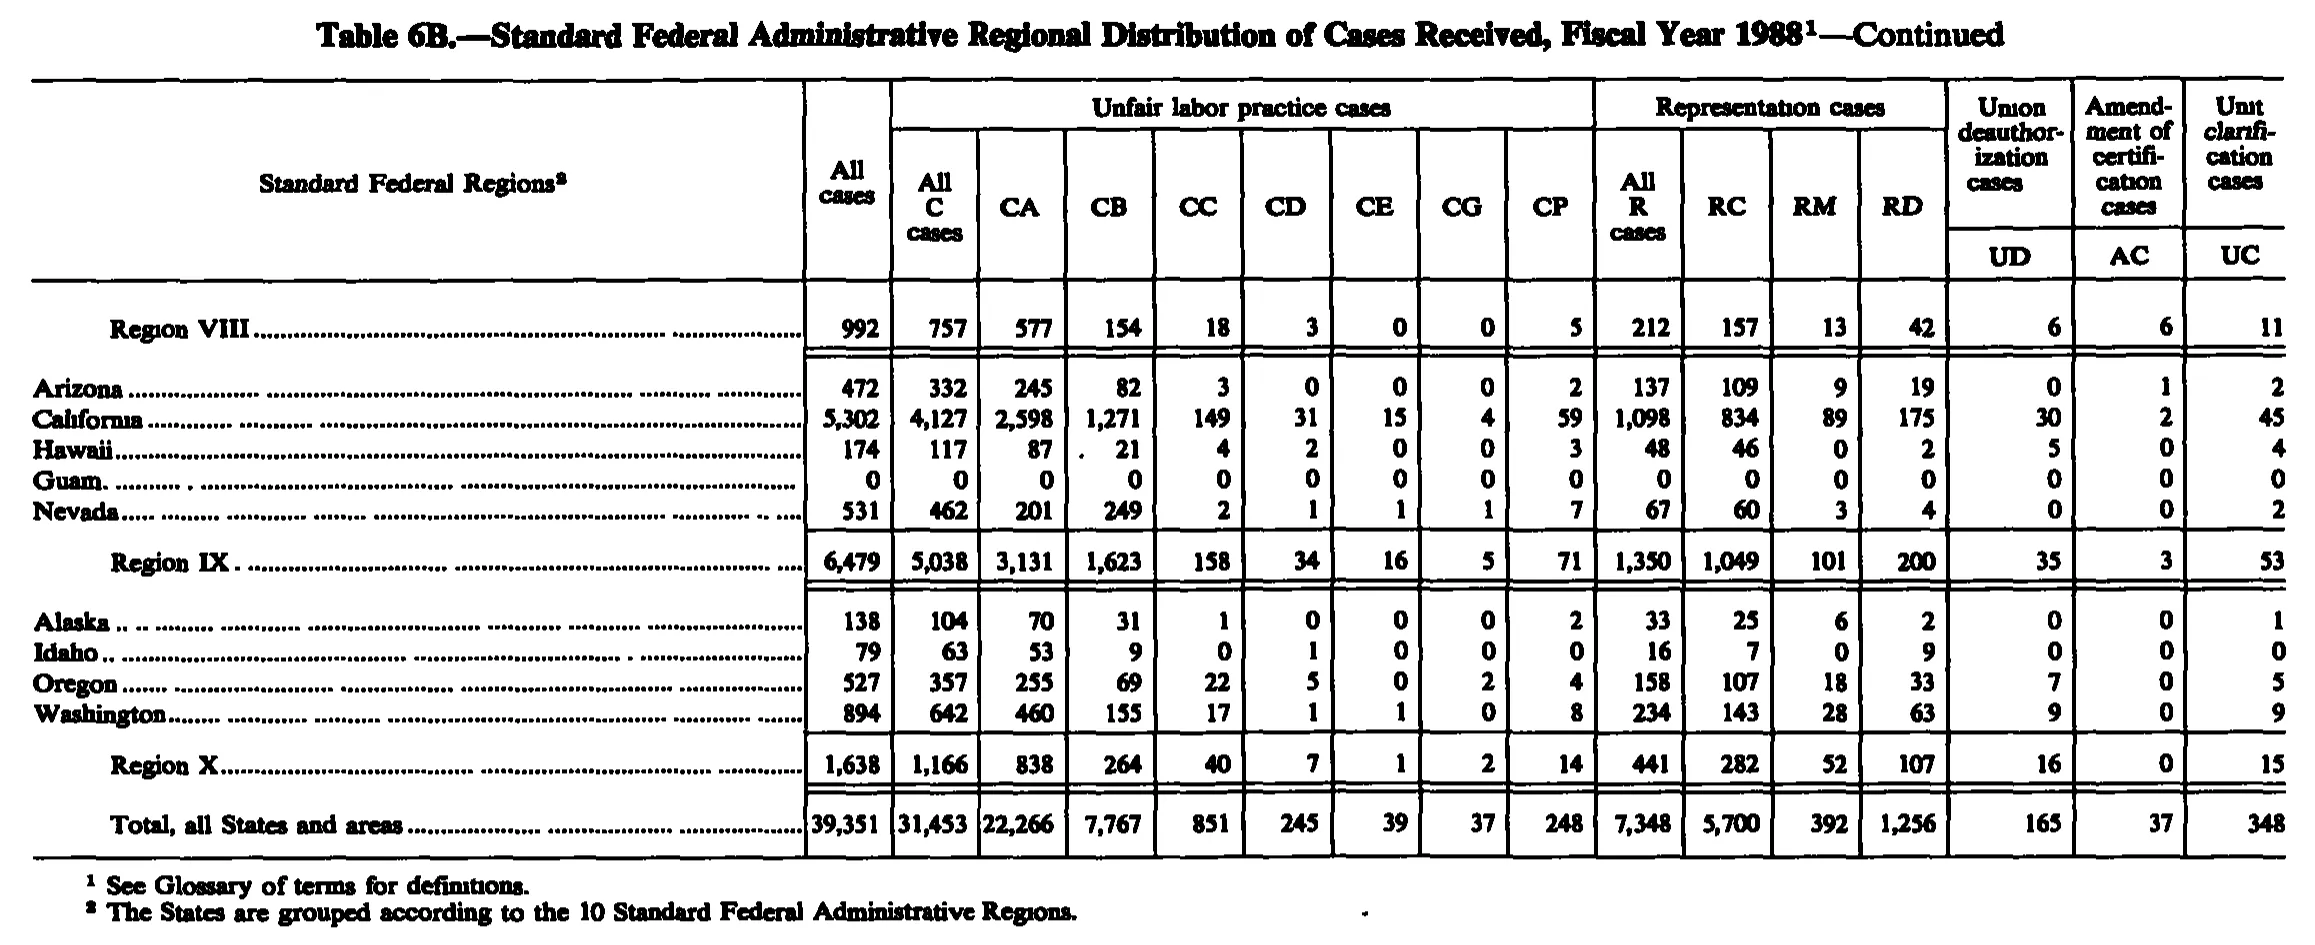
Standard Federal Administrative Regional Distribution of Cases Received, Fiscal Year 1988
Stitched from pp. 216–218.
| Standard Federal Regions | All cases | Unfair labor practice cases | Representation cases | Union deauthorization cases | Amendment of certification cases | Unit clarification cases | ||||||||||
|---|---|---|---|---|---|---|---|---|---|---|---|---|---|---|---|---|
| Standard Federal Regions | All cases | All C cases | CA | CB | CC | CD | CE | CG | CP | All R cases | RC | RM | RD | Union deauthorization cases | Amendment of certification cases | Unit clarification cases |
| Standard Federal Regions | All cases | All C cases | CA | CB | CC | CD | CE | CG | CP | All R cases | RC | RM | RD | UD | AC | UC |
| Connecticut | 636 | 528 | 405 | 110 | 6 | 2 | 0 | 4 | 1 | 96 | 75 | 8 | 13 | 5 | 0 | 7 |
| Maine | 105 | 79 | 69 | 10 | 0 | 0 | 0 | 0 | 0 | 25 | 16 | 1 | 8 | 1 | 0 | 0 |
| Massachusetts | 1,093 | 904 | 646 | 161 | 53 | 35 | 1 | 3 | 5 | 169 | 140 | 3 | 26 | 3 | 0 | 17 |
| New Hampshire | 67 | 54 | 46 | 6 | 2 | 0 | 0 | 0 | 0 | 13 | 10 | 0 | 3 | 0 | 0 | 0 |
| Rhode Island | 183 | 152 | 123 | 24 | 3 | 1 | 0 | 1 | 0 | 26 | 23 | 0 | 3 | 0 | 0 | 5 |
| Vermont | 37 | 28 | 22 | 6 | 0 | 0 | 0 | 0 | 0 | 8 | 6 | 0 | 2 | 0 | 0 | 1 |
| Region I | 2,121 | 1,745 | 1,311 | 317 | 64 | 38 | 1 | 8 | 6 | 337 | 270 | 12 | 55 | 9 | 0 | 30 |
| Delaware | 114 | 96 | 40 | 49 | 7 | 0 | 0 | 0 | 0 | 16 | 12 | 0 | 4 | 0 | 0 | 2 |
| New Jersey | 1,479 | 1,177 | 857 | 258 | 41 | 15 | 0 | 1 | 5 | 275 | 224 | 10 | 41 | 9 | 1 | 17 |
| New York | 3,495 | 2,846 | 1,781 | 937 | 64 | 32 | 4 | 7 | 21 | 588 | 485 | 23 | 80 | 13 | 1 | 47 |
| Puerto Rico | 295 | 224 | 194 | 28 | 0 | 0 | 0 | 2 | 0 | 62 | 45 | 2 | 15 | 0 | 1 | 8 |
| Virgin Islands | 15 | 12 | 11 | 1 | 0 | 0 | 0 | 0 | 0 | 3 | 2 | 1 | 0 | 0 | 0 | 0 |
| Region II | 5,398 | 4,355 | 2,883 | 1,273 | 112 | 47 | 4 | 10 | 26 | 944 | 768 | 36 | 140 | 22 | 3 | 74 |
| District of Columbia | 244 | 207 | 162 | 43 | 1 | 0 | 0 | 0 | 1 | 26 | 24 | 0 | 2 | 2 | 0 | 9 |
| Maryland | 709 | 615 | 407 | 193 | 11 | 2 | 0 | 0 | 2 | 88 | 72 | 2 | 14 | 2 | 1 | 3 |
| Pennsylvania | 2,591 | 2,160 | 1,614 | 423 | 74 | 33 | 5 | 5 | 6 | 392 | 300 | 18 | 74 | 10 | 6 | 23 |
| Virginia | 575 | 504 | 383 | 111 | 6 | 2 | 1 | 0 | 1 | 70 | 53 | 3 | 14 | 0 | 0 | 1 |
| West Virginia | 563 | 499 | 391 | 92 | 10 | 0 | 0 | 0 | 6 | 59 | 47 | 2 | 10 | 2 | 1 | 2 |
| Region III | 4,682 | 3,985 | 2,957 | 862 | 102 | 37 | 6 | 5 | 16 | 635 | 496 | 25 | 114 | 16 | 8 | 38 |
| Alabama | 474 | 364 | 294 | 60 | 2 | 2 | 0 | 0 | 6 | 107 | 86 | 0 | 21 | 0 | 0 | 3 |
| Florida | 1,012 | 837 | 569 | 260 | 8 | 0 | 0 | 0 | 0 | 169 | 150 | 2 | 17 | 0 | 0 | 6 |
| Georgia | 626 | 513 | 381 | 128 | 3 | 1 | 0 | 0 | 0 | 111 | 92 | 6 | 13 | 0 | 1 | 1 |
| Kentucky | 647 | 534 | 441 | 83 | 4 | 3 | 0 | 0 | 3 | 107 | 79 | 3 | 25 | 2 | 0 | 4 |
| Mississippi | 210 | 175 | 153 | 20 | 0 | 0 | 0 | 2 | 0 | 34 | 31 | 0 | 3 | 1 | 0 | 0 |
| North Carolina | 405 | 353 | 279 | 74 | 0 | 0 | 0 | 0 | 0 | 48 | 41 | 1 | 6 | 0 | 0 | 4 |
| South Carolina | 156 | 121 | 86 | 35 | 0 | 0 | 0 | 0 | 0 | 35 | 28 | 2 | 5 | 0 | 0 | 0 |
| Tennessee | 790 | 657 | 558 | 89 | 9 | 1 | 0 | 0 | 0 | 129 | 105 | 7 | 17 | 0 | 1 | 3 |
| Region IV | 4,320 | 3,554 | 2,761 | 749 | 26 | 7 | 0 | 2 | 9 | 740 | 612 | 21 | 107 | 3 | 2 | 21 |
| Illinois | 2,451 | 1,858 | 1,252 | 481 | 70 | 28 | 2 | 1 | 24 | 575 | 473 | 46 | 56 | 6 | 0 | 12 |
| Indiana | 1,390 | 1,169 | 809 | 291 | 47 | 10 | 3 | 0 | 9 | 198 | 142 | 8 | 48 | 11 | 1 | 11 |
| Michigan | 2,224 | 1,757 | 1,324 | 384 | 31 | 4 | 0 | 1 | 13 | 433 | 348 | 16 | 69 | 9 | 1 | 24 |
| Minnesota | 527 | 356 | 261 | 65 | 25 | 3 | 0 | 0 | 2 | 160 | 124 | 5 | 31 | 2 | 0 | 9 |
| Ohio | 2,412 | 1,936 | 1,496 | 366 | 54 | 1 | 1 | 1 | 17 | 437 | 337 | 13 | 87 | 19 | 2 | 18 |
| Wisconsin | 837 | 657 | 482 | 152 | 14 | 4 | 0 | 0 | 5 | 168 | 122 | 5 | 41 | 3 | 2 | 7 |
| Region V | 9,841 | 7,733 | 5,624 | 1,739 | 241 | 50 | 6 | 3 | 70 | 1,971 | 1,546 | 93 | 332 | 50 | 6 | 81 |
| Arkansas | 177 | 134 | 115 | 18 | 0 | 0 | 0 | 0 | 1 | 37 | 26 | 0 | 11 | 0 | 0 | 6 |
| Louisiana | 237 | 200 | 157 | 39 | 2 | 0 | 0 | 0 | 2 | 35 | 30 | 1 | 4 | 0 | 1 | 1 |
| New Mexico | 160 | 121 | 78 | 42 | 0 | 0 | 0 | 1 | 0 | 33 | 27 | 1 | 5 | 2 | 2 | 2 |
| Oklahoma | 243 | 192 | 151 | 41 | 0 | 0 | 0 | 0 | 0 | 50 | 37 | 5 | 8 | 0 | 1 | 0 |
| Texas | 1,136 | 980 | 660 | 307 | 11 | 0 | 2 | 0 | 0 | 149 | 103 | 6 | 40 | 0 | 1 | 6 |
| Region VI | 1,953 | 1,627 | 1,161 | 447 | 13 | 0 | 2 | 1 | 3 | 304 | 223 | 13 | 68 | 2 | 5 | 15 |
| Iowa | 323 | 214 | 158 | 44 | 9 | 2 | 0 | 0 | 1 | 107 | 84 | 6 | 17 | 0 | 0 | 2 |
| Kansas | 225 | 160 | 118 | 35 | 4 | 1 | 0 | 0 | 2 | 62 | 49 | 3 | 10 | 0 | 3 | 0 |
| Missouri | 1,256 | 1,024 | 687 | 241 | 57 | 19 | 3 | 1 | 16 | 218 | 143 | 15 | 60 | 6 | 1 | 7 |
| Nebraska | 123 | 95 | 60 | 19 | 7 | 0 | 0 | 0 | 9 | 27 | 21 | 2 | 4 | 0 | 0 | 1 |
| Region VII | 1,927 | 1,493 | 1,023 | 339 | 77 | 22 | 3 | 1 | 28 | 414 | 297 | 26 | 91 | 6 | 4 | 10 |
| Colorado | 582 | 474 | 349 | 114 | 11 | 0 | 0 | 0 | 0 | 96 | 72 | 3 | 21 | 1 | 4 | 7 |
| Montana | 174 | 111 | 91 | 12 | 4 | 2 | 0 | 0 | 2 | 57 | 37 | 6 | 14 | 5 | 0 | 1 |
| North Dakota | 25 | 16 | 12 | 4 | 0 | 0 | 0 | 0 | 0 | 9 | 7 | 0 | 2 | 0 | 0 | 0 |
| South Dakota | 42 | 31 | 25 | 6 | 0 | 0 | 0 | 0 | 0 | 11 | 6 | 3 | 2 | 0 | 0 | 0 |
| Utah | 116 | 80 | 61 | 14 | 1 | 1 | 0 | 0 | 3 | 32 | 29 | 1 | 2 | 0 | 2 | 2 |
| Wyoming | 53 | 45 | 39 | 4 | 2 | 0 | 0 | 0 | 0 | 7 | 6 | 0 | 1 | 0 | 0 | 0 |
| Region VIII | 992 | 757 | 577 | 154 | 18 | 3 | 0 | 0 | 5 | 212 | 157 | 13 | 42 | 6 | 6 | 11 |
| Arizona | 472 | 332 | 245 | 82 | 3 | 0 | 0 | 0 | 2 | 137 | 109 | 9 | 19 | 0 | 1 | 2 |
| California | 5,302 | 4,127 | 2,598 | 1,271 | 149 | 31 | 15 | 4 | 59 | 1,098 | 834 | 89 | 175 | 30 | 2 | 45 |
| Hawaii | 174 | 117 | 87 | 21 | 4 | 2 | 0 | 0 | 3 | 48 | 46 | 0 | 2 | 5 | 0 | 4 |
| Guam | 0 | 0 | 0 | 0 | 0 | 0 | 0 | 0 | 0 | 0 | 0 | 0 | 0 | 0 | 0 | 0 |
| Nevada | 531 | 462 | 201 | 249 | 2 | 1 | 1 | 1 | 7 | 67 | 60 | 3 | 4 | 0 | 0 | 2 |
| Region IX | 6,479 | 5,038 | 3,131 | 1,623 | 158 | 34 | 16 | 5 | 71 | 1,350 | 1,049 | 101 | 200 | 35 | 3 | 53 |
| Alaska | 138 | 104 | 70 | 31 | 1 | 0 | 0 | 0 | 2 | 33 | 25 | 6 | 2 | 0 | 0 | 1 |
| Idaho | 79 | 63 | 53 | 9 | 0 | 1 | 0 | 0 | 0 | 16 | 7 | 0 | 9 | 0 | 0 | 0 |
| Oregon | 527 | 357 | 255 | 69 | 22 | 5 | 0 | 2 | 4 | 158 | 107 | 18 | 33 | 7 | 0 | 5 |
| Washington | 894 | 642 | 460 | 155 | 17 | 1 | 1 | 0 | 8 | 234 | 143 | 28 | 63 | 9 | 0 | 9 |
| Region X | 1,638 | 1,166 | 838 | 264 | 40 | 7 | 1 | 2 | 14 | 441 | 282 | 52 | 107 | 16 | 0 | 15 |
| Total, all States and areas | 39,351 | 31,453 | 22,266 | 7,767 | 851 | 245 | 39 | 37 | 248 | 7,348 | 5,700 | 392 | 1,256 | 165 | 37 | 348 |
- 1 See Glossary of terms for definitions.
- 2 The States are grouped according to the 10 Standard Federal Administrative Regions.
799 of 799 figures sit in a row or column sum that works out. 2 cells break a sum: 'Wyoming', column 2: prints 53, the subtotals in columns 3 to 17 add to 52; 'Region VIII', column 17: prints 11, rows 'Colorado' to 'Wyoming' add to 10.
Reader’s notes
p. 216. The crop is cut off at the bottom: the body ends mid-section with "North Carolina" (the Region IV group is incomplete), and no footnote texts are visible even though footnote markers are printed (a raised 1 on the caption, a raised 2 on the stub heading "Standard Federal Regions"). The caption marker is not transcribed since captions are excluded; the stub-heading marker is kept as "Standard Federal Regions^2". Column structure: 17 columns. The spanner "Unfair labor practice cases" covers the 8 columns All C cases, CA, CB, CC, CD, CE, CG, CP; "Representation cases" covers All R cases, RC, RM, RD. The last three boxes carry a tall descriptive heading ("Union deauthorization cases", "Amendment of certification cases", "Unit clarification cases") over a third-level code line (UD, AC, UC), so those descriptive headings are repeated in header levels 1 and 2 and the codes appear in level 3; likewise "Standard Federal Regions^2" and "All cases" are repeated across all three levels. "Region I", "Region II" and "Region III" are indented subtotal rows set off by rules, not data rows; they are transcribed in reading order after the states they total. All values were cross-checked: every state row satisfies All cases = All C + All R + UD + AC + UC, All C = CA+CB+CC+CD+CE+CG+CP, and All R = RC+RM+RD, and each Region subtotal equals the sum of its states in every column. No misprints or doubtful cells were found. The scan renders some "i" dots faintly in row labels (e.g. "Connecticut", "Mississippi"), but the words themselves are unambiguous.
p. 217. Crop/continuation: this is a continuation page. It begins mid-Region IV (the first two listed states, South Carolina and Tennessee, are the tail of that region's state list; earlier Region IV states are on the preceding page) and it ends mid-Region VIII — the Colorado…Wyoming block has no "Region VIII" total line on this image, and any further regions and the footnote block are cut off below. No footnote text is printed on this crop. Header structure: three printed heading levels. "Unfair labor practice cases" spans the 8 columns All C cases…CP; "Representation cases" spans All R cases…RD; "Standard Federal Regions", "All cases", and the three right-hand headings ("Union deauthorization cases", "Amendment of certification cases", "Unit clarification cases") are tall boxes repeated down the levels they span, with UD/AC/UC printed on the lowest level. Doubtful cell: the superscript marker on the stub heading "Standard Federal Regions" is a small raised character I read as a 2, but at this scan quality it could be a raised "a" or "1"; I transcribed it as "Standard Federal Regions^2". Scan artifacts (not transcribed as content): broken dotted "i" in "Michigan", "Missouri", "Indiana" and "New Mexico"; an isolated ink speck in the UD column on the Oklahoma line, which I read as an artifact rather than a punctuation mark, so that cell is 0. Leader dots after each row label were dropped. Arithmetic: every row's components sum to its "All C cases", "All R cases" and "All cases" figures, and the Region V, VI and VII total lines equal the sums of their listed states in all 16 numeric columns. No printed total appears to be misprinted.
p. 218. This is a continuation page ("—Continued"): the body opens with the "Region VIII" total line, so the individual States making up Region VIII appear on the preceding page and are not on this crop. Seventeen printed columns (stub + 16 numeric). The last three columns each carry a two-tier heading, the spelled-out name over the code letters UD / AC / UC; the first level of the heading band is occupied by the spanners "Unfair labor practice cases" and "Representation cases", while "All cases" and the stub heading run the full height. Row labels are followed by long, broken leader dots (e.g. "Guam. ........ , ........", "Alaska .. ..", "Idaho..", "Region IX ."); the stray dots and commas are leaders, not text, and were dropped. In the Hawaii row a stray leader dot sits just left of the CB value 21; the value is 21. Idaho RD reads 9 (larger than RC = 7), but it is printed clearly and is consistent with All R = 16 (7 + 0 + 9). All region subtotals, the row-wise C/R splits and the grand-total row add up as printed; nothing required correction.
Source image
Source data: U.S. NLRB Annual Reports (public domain). Reconstruction by NLRB Stats Archive. Read by claude-opus-5 (effort max, prompt extract_v1) from the 300-dpi scan; stitched by page. Updated October 2026.