NLRB Stats Archive › Annual Reports › FY1987 › Proceedings Decided by Circuit Courts of Appeals on Petitions for Enforcement and/or Review of Board Orders, Fiscal Year 1987, Compared With 5-Year Cumulative Totals, Fiscal Years 1982 Through 1986
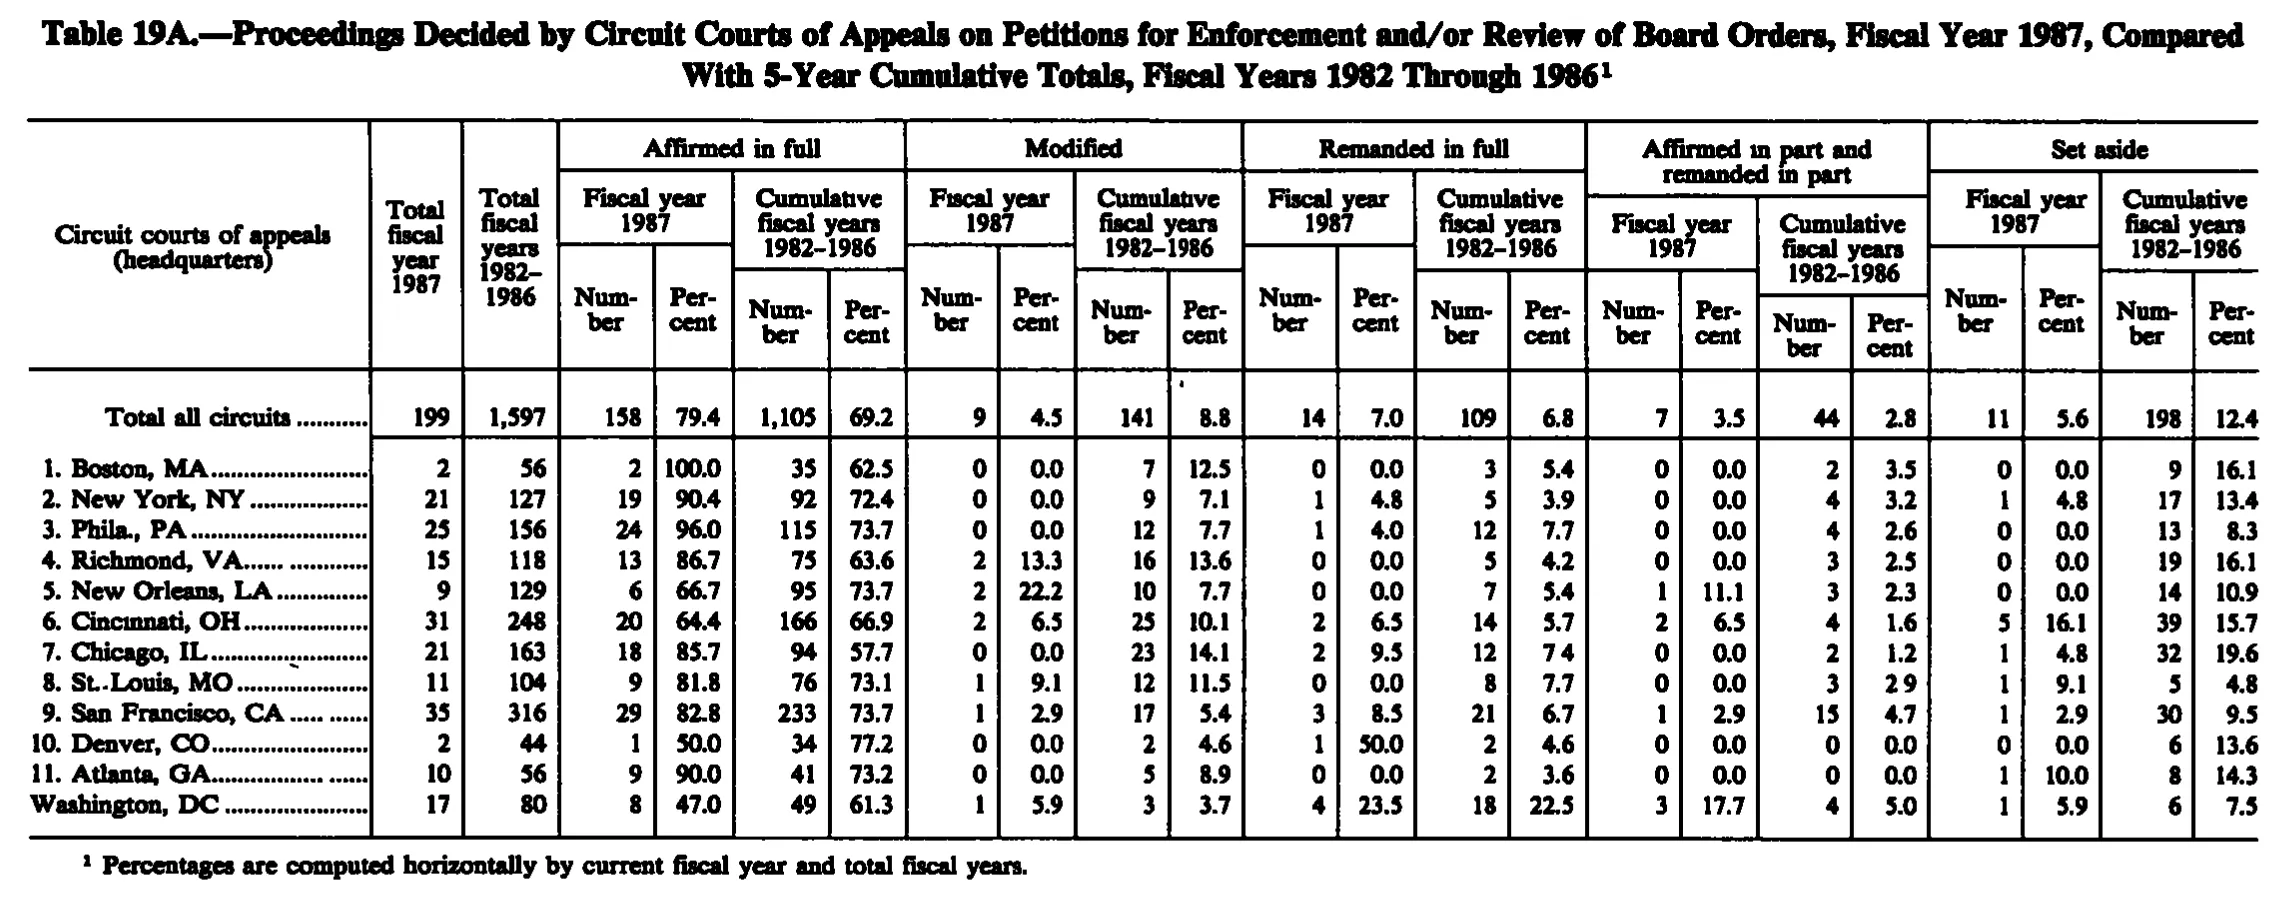
Proceedings Decided by Circuit Courts of Appeals on Petitions for Enforcement and/or Review of Board Orders, Fiscal Year 1987, Compared With 5-Year Cumulative Totals, Fiscal Years 1982 Through 1986
| Circuit courts of appeals (headquarters) | Total fiscal year 1987 | Total fiscal years 1982-1986 | Affirmed in full | Modified | Remanded in full | Affirmed in part and remanded in part | Set aside | |||||||||||||||
|---|---|---|---|---|---|---|---|---|---|---|---|---|---|---|---|---|---|---|---|---|---|---|
| Circuit courts of appeals (headquarters) | Total fiscal year 1987 | Total fiscal years 1982-1986 | Fiscal year 1987 | Cumulative fiscal years 1982-1986 | Fiscal year 1987 | Cumulative fiscal years 1982-1986 | Fiscal year 1987 | Cumulative fiscal years 1982-1986 | Fiscal year 1987 | Cumulative fiscal years 1982-1986 | Fiscal year 1987 | Cumulative fiscal years 1982-1986 | ||||||||||
| Circuit courts of appeals (headquarters) | Total fiscal year 1987 | Total fiscal years 1982-1986 | Number | Percent | Number | Percent | Number | Percent | Number | Percent | Number | Percent | Number | Percent | Number | Percent | Number | Percent | Number | Percent | Number | Percent |
| Total all circuits | 199 | 1,597 | 158 | 79.4 | 1,105 | 69.2 | 9 | 4.5 | 141 | 8.8 | 14 | 7.0 | 109 | 6.8 | 7 | 3.5 | 44 | 2.8 | 11 | 5.6 | 198 | 12.4 |
| 1. Boston, MA | 2 | 56 | 2 | 100.0 | 35 | 62.5 | 0 | 0.0 | 7 | 12.5 | 0 | 0.0 | 3 | 5.4 | 0 | 0.0 | 2 | 3.5 | 0 | 0.0 | 9 | 16.1 |
| 2. New York, NY | 21 | 127 | 19 | 90.4 | 92 | 72.4 | 0 | 0.0 | 9 | 7.1 | 1 | 4.8 | 5 | 3.9 | 0 | 0.0 | 4 | 3.2 | 1 | 4.8 | 17 | 13.4 |
| 3. Phila., PA | 25 | 156 | 24 | 96.0 | 115 | 73.7 | 0 | 0.0 | 12 | 7.7 | 1 | 4.0 | 12 | 7.7 | 0 | 0.0 | 4 | 2.6 | 0 | 0.0 | 13 | 8.3 |
| 4. Richmond, VA | 15 | 118 | 13 | 86.7 | 75 | 63.6 | 2 | 13.3 | 16 | 13.6 | 0 | 0.0 | 5 | 4.2 | 0 | 0.0 | 3 | 2.5 | 0 | 0.0 | 19 | 16.1 |
| 5. New Orleans, LA | 9 | 129 | 6 | 66.7 | 95 | 73.7 | 2 | 22.2 | 10 | 7.7 | 0 | 0.0 | 7 | 5.4 | 1 | 11.1 | 3 | 2.3 | 0 | 0.0 | 14 | 10.9 |
| 6. Cincinnati, OH | 31 | 248 | 20 | 64.4 | 166 | 66.9 | 2 | 6.5 | 25 | 10.1 | 2 | 6.5 | 14 | 5.7 | 2 | 6.5 | 4 | 1.6 | 5 | 16.1 | 39 | 15.7 |
| 7. Chicago, IL | 21 | 163 | 18 | 85.7 | 94 | 57.7 | 0 | 0.0 | 23 | 14.1 | 2 | 9.5 | 12 | 7.4 | 0 | 0.0 | 2 | 1.2 | 1 | 4.8 | 32 | 19.6 |
| 8. St. Louis, MO | 11 | 104 | 9 | 81.8 | 76 | 73.1 | 1 | 9.1 | 12 | 11.5 | 0 | 0.0 | 8 | 7.7 | 0 | 0.0 | 3 | 2.9 | 1 | 9.1 | 5 | 4.8 |
| 9. San Francisco, CA | 35 | 316 | 29 | 82.8 | 233 | 73.7 | 1 | 2.9 | 17 | 5.4 | 3 | 8.5 | 21 | 6.7 | 1 | 2.9 | 15 | 4.7 | 1 | 2.9 | 30 | 9.5 |
| 10. Denver, CO | 2 | 44 | 1 | 50.0 | 34 | 77.2 | 0 | 0.0 | 2 | 4.6 | 1 | 50.0 | 2 | 4.6 | 0 | 0.0 | 0 | 0.0 | 0 | 0.0 | 6 | 13.6 |
| 11. Atlanta, GA | 10 | 56 | 9 | 90.0 | 41 | 73.2 | 0 | 0.0 | 5 | 8.9 | 0 | 0.0 | 2 | 3.6 | 0 | 0.0 | 0 | 0.0 | 1 | 10.0 | 8 | 14.3 |
| Washington, DC | 17 | 80 | 8 | 47.0 | 49 | 61.3 | 1 | 5.9 | 3 | 3.7 | 4 | 23.5 | 18 | 22.5 | 3 | 17.7 | 4 | 5.0 | 1 | 5.9 | 6 | 7.5 |
- 1 Percentages are computed horizontally by current fiscal year and total fiscal years.
130 of 130 figures sit in a row or column sum that works out.
Reader’s notes
p. 258. Grid is 23 columns: stub, "Total fiscal year 1987", "Total fiscal years 1982-1986", then five outcome groups (Affirmed in full; Modified; Remanded in full; Affirmed in part and remanded in part; Set aside), each with four columns (Fiscal year 1987 Number/Percent, Cumulative fiscal years 1982-1986 Number/Percent). The footnote marker 1 is attached to the caption, which is not transcribed. All count columns cross-check: every row's five FY1987 Number cells sum to its "Total fiscal year 1987", and the five Cumulative Number cells sum to its "Total fiscal years 1982-1986", so the integer cells are reliable. Doubtful cells, all final digits of percentages blurred by the scan; each is transcribed as it appears, not corrected. Recomputing the percentage horizontally (as footnote 1 directs) would give a different last digit in these cells, so the reading or the print may be off by one: "6. Cincinnati, OH" / Affirmed in full - Fiscal year 1987 - Percent, read 64.4 (20/31 = 64.5); "Washington, DC" / Affirmed in full - Fiscal year 1987 - Percent, read 47.0 (8/17 = 47.1); "Washington, DC" / Modified - Cumulative - Percent, read 3.7 (3/80 = 3.8); "1. Boston, MA" / Affirmed in part and remanded in part - Cumulative - Percent, read 3.5 (2/56 = 3.6); "2. New York, NY" / Affirmed in part and remanded in part - Cumulative - Percent, read 3.2 (4/127 = 3.1). Elsewhere the printed percentages match an ordinary rounding of the counts. Decimal points are faint rather than absent in two cells, read as decimals: "7. Chicago, IL" / Remanded in full - Cumulative - Percent prints as "7 4" and is given as 7.4; "8. St. Louis, MO" / Affirmed in part and remanded in part - Cumulative - Percent prints as "2 9" and is given as 2.9. Row labels: the stub for row 8 prints as "St..Louis, MO" where the row label's period runs into the leader dots; given as "St. Louis, MO". Row 6 prints as "Cincmnati, OH" from a broken "in" ligature in the scan; given as "Cincinnati, OH". The last row has no circuit number printed, unlike rows 1-11. A small stray ink speck sits above the "141"/"8.8" cells in the Total all circuits row; it is not a footnote marker and is not transcribed.
Source image
Source data: U.S. NLRB Annual Reports (public domain). Reconstruction by NLRB Stats Archive. Read by claude-opus-5 (effort max, prompt extract_v1) from the 300-dpi scan; stitched by page. Updated October 2026.