NLRB Stats Archive › Annual Reports › FY1987 › Distribution of Unfair Labor Practice Situations Received, by Number of Employees in Establishments, Fiscal Year 1987
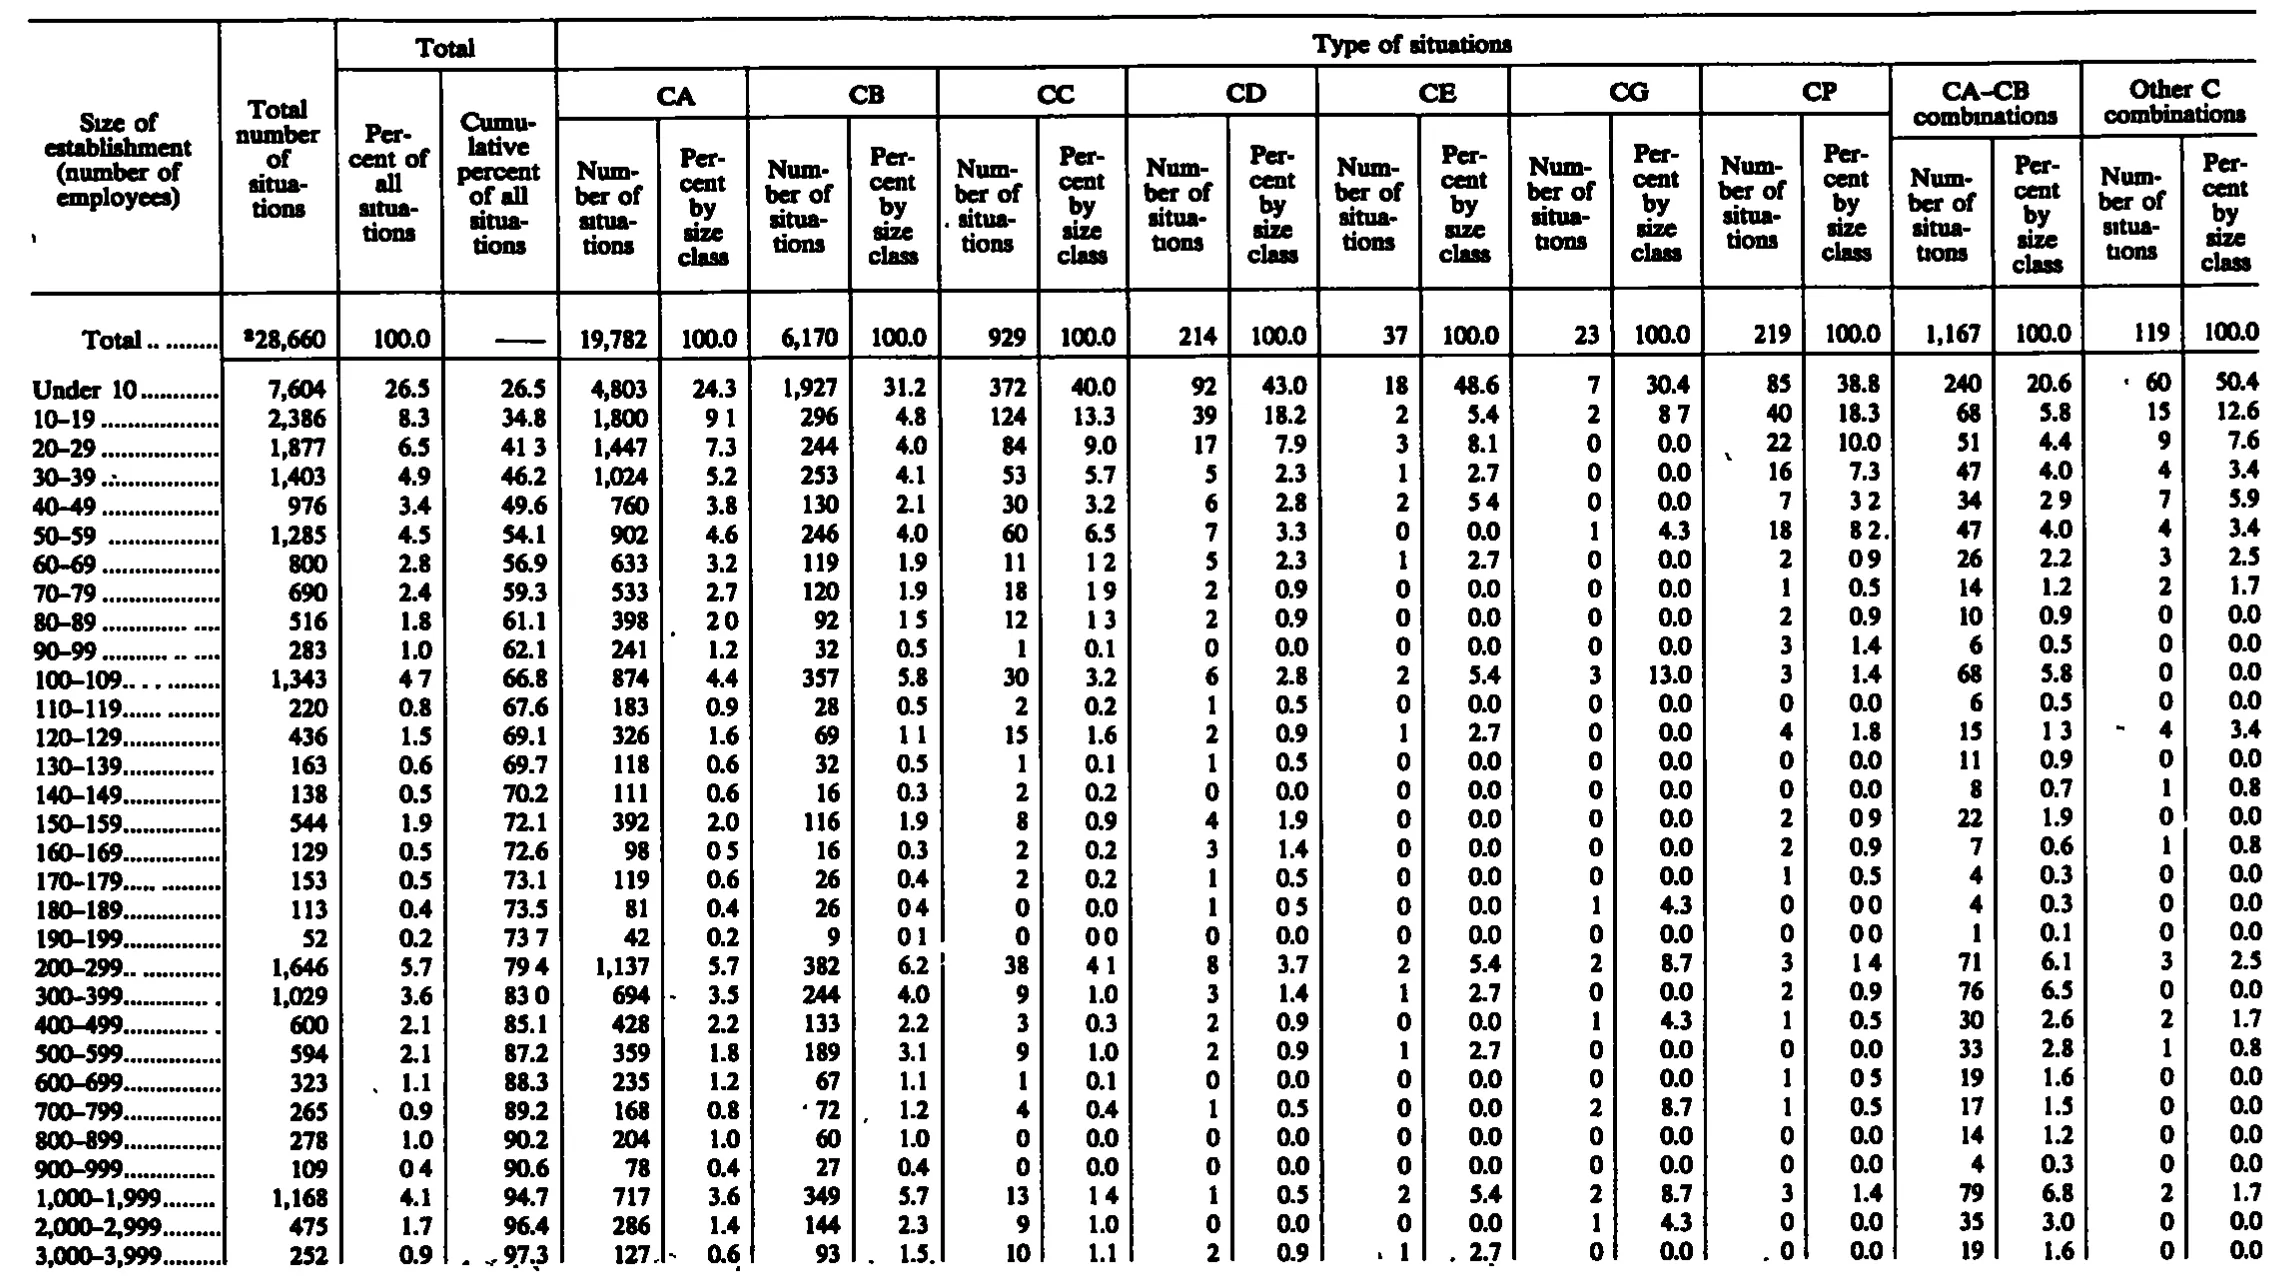
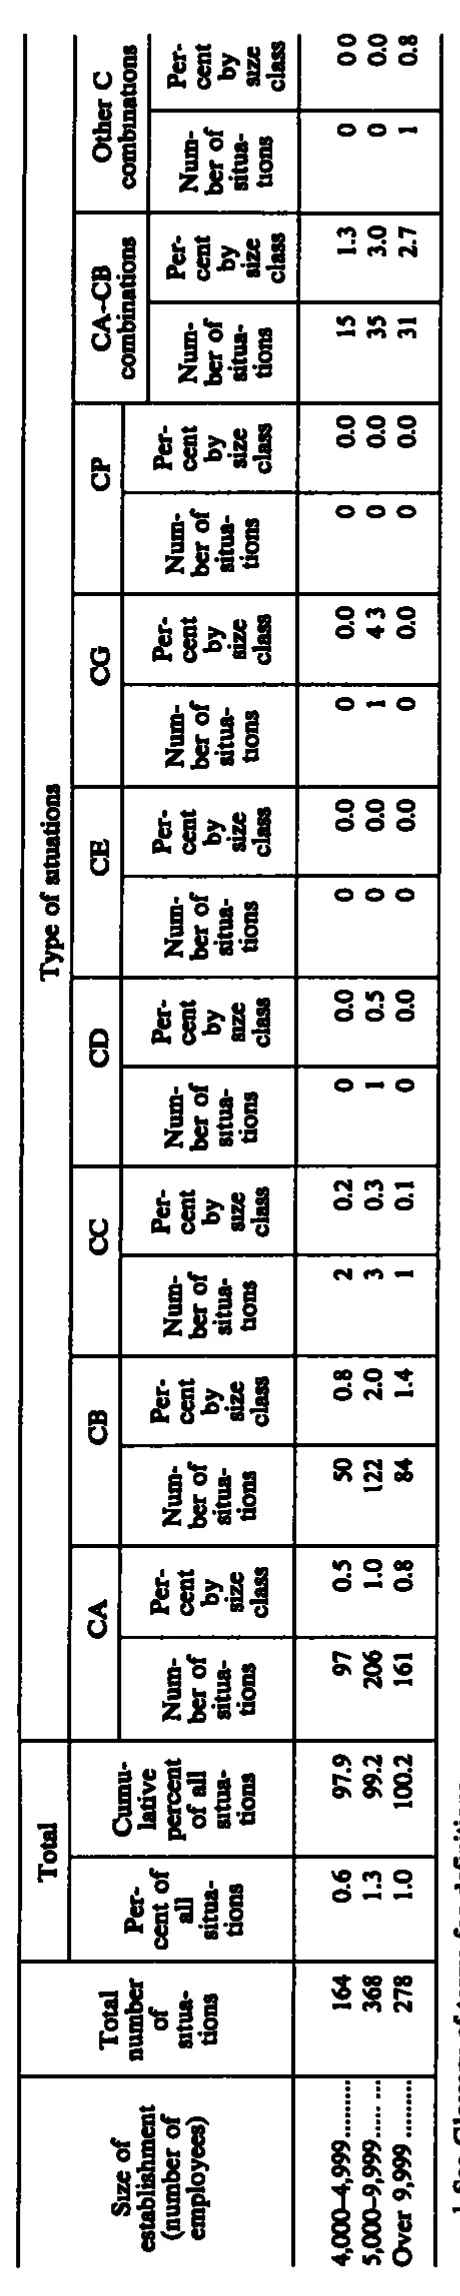
Distribution of Unfair Labor Practice Situations Received, by Number of Employees in Establishments, Fiscal Year 1987
Stitched from pp. 255–256.
| Size of establishment (number of employees) | Total number of situations | Total | Type of situations | ||||||||||||||||||
|---|---|---|---|---|---|---|---|---|---|---|---|---|---|---|---|---|---|---|---|---|---|
| Size of establishment (number of employees) | Total number of situations | Percent of all situations | Cumulative percent of all situations | CA | CB | CC | CD | CE | CG | CP | CA-CB combinations | Other C combinations | |||||||||
| Size of establishment (number of employees) | Total number of situations | Percent of all situations | Cumulative percent of all situations | Number of situations | Percent by size class | Number of situations | Percent by size class | Number of situations | Percent by size class | Number of situations | Percent by size class | Number of situations | Percent by size class | Number of situations | Percent by size class | Number of situations | Percent by size class | Number of situations | Percent by size class | Number of situations | Percent by size class |
| Total | 28,660 | 100.0 | 19,782 | 100.0 | 6,170 | 100.0 | 929 | 100.0 | 214 | 100.0 | 37 | 100.0 | 23 | 100.0 | 219 | 100.0 | 1,167 | 100.0 | 119 | 100.0 | |
| Under 10 | 7,604 | 26.5 | 26.5 | 4,803 | 24.3 | 1,927 | 31.2 | 372 | 40.0 | 92 | 43.0 | 18 | 48.6 | 7 | 30.4 | 85 | 38.8 | 240 | 20.6 | 60 | 50.4 |
| 10–19 | 2,386 | 8.3 | 34.8 | 1,800 | 9.1 | 296 | 4.8 | 124 | 13.3 | 39 | 18.2 | 2 | 5.4 | 2 | 8.7 | 40 | 18.3 | 68 | 5.8 | 15 | 12.6 |
| 20–29 | 1,877 | 6.5 | 41.3 | 1,447 | 7.3 | 244 | 4.0 | 84 | 9.0 | 17 | 7.9 | 3 | 8.1 | 0 | 0.0 | 22 | 10.0 | 51 | 4.4 | 9 | 7.6 |
| 30–39 | 1,403 | 4.9 | 46.2 | 1,024 | 5.2 | 253 | 4.1 | 53 | 5.7 | 5 | 2.3 | 1 | 2.7 | 0 | 0.0 | 16 | 7.3 | 47 | 4.0 | 4 | 3.4 |
| 40–49 | 976 | 3.4 | 49.6 | 760 | 3.8 | 130 | 2.1 | 30 | 3.2 | 6 | 2.8 | 2 | 5.4 | 0 | 0.0 | 7 | 3.2 | 34 | 2.9 | 7 | 5.9 |
| 50–59 | 1,285 | 4.5 | 54.1 | 902 | 4.6 | 246 | 4.0 | 60 | 6.5 | 7 | 3.3 | 0 | 0.0 | 1 | 4.3 | 18 | 8.2 | 47 | 4.0 | 4 | 3.4 |
| 60–69 | 800 | 2.8 | 56.9 | 633 | 3.2 | 119 | 1.9 | 11 | 1.2 | 5 | 2.3 | 1 | 2.7 | 0 | 0.0 | 2 | 0.9 | 26 | 2.2 | 3 | 2.5 |
| 70–79 | 690 | 2.4 | 59.3 | 533 | 2.7 | 120 | 1.9 | 18 | 1.9 | 2 | 0.9 | 0 | 0.0 | 0 | 0.0 | 1 | 0.5 | 14 | 1.2 | 2 | 1.7 |
| 80–89 | 516 | 1.8 | 61.1 | 398 | 2.0 | 92 | 1.5 | 12 | 1.3 | 2 | 0.9 | 0 | 0.0 | 0 | 0.0 | 2 | 0.9 | 10 | 0.9 | 0 | 0.0 |
| 90–99 | 283 | 1.0 | 62.1 | 241 | 1.2 | 32 | 0.5 | 1 | 0.1 | 0 | 0.0 | 0 | 0.0 | 0 | 0.0 | 3 | 1.4 | 6 | 0.5 | 0 | 0.0 |
| 100–109 | 1,343 | 4.7 | 66.8 | 874 | 4.4 | 357 | 5.8 | 30 | 3.2 | 6 | 2.8 | 2 | 5.4 | 3 | 13.0 | 3 | 1.4 | 68 | 5.8 | 0 | 0.0 |
| 110–119 | 220 | 0.8 | 67.6 | 183 | 0.9 | 28 | 0.5 | 2 | 0.2 | 1 | 0.5 | 0 | 0.0 | 0 | 0.0 | 0 | 0.0 | 6 | 0.5 | 0 | 0.0 |
| 120–129 | 436 | 1.5 | 69.1 | 326 | 1.6 | 69 | 1.1 | 15 | 1.6 | 2 | 0.9 | 1 | 2.7 | 0 | 0.0 | 4 | 1.8 | 15 | 1.3 | 4 | 3.4 |
| 130–139 | 163 | 0.6 | 69.7 | 118 | 0.6 | 32 | 0.5 | 1 | 0.1 | 1 | 0.5 | 0 | 0.0 | 0 | 0.0 | 0 | 0.0 | 11 | 0.9 | 0 | 0.0 |
| 140–149 | 138 | 0.5 | 70.2 | 111 | 0.6 | 16 | 0.3 | 2 | 0.2 | 0 | 0.0 | 0 | 0.0 | 0 | 0.0 | 0 | 0.0 | 8 | 0.7 | 1 | 0.8 |
| 150–159 | 544 | 1.9 | 72.1 | 392 | 2.0 | 116 | 1.9 | 8 | 0.9 | 4 | 1.9 | 0 | 0.0 | 0 | 0.0 | 2 | 0.9 | 22 | 1.9 | 0 | 0.0 |
| 160–169 | 129 | 0.5 | 72.6 | 98 | 0.5 | 16 | 0.3 | 2 | 0.2 | 3 | 1.4 | 0 | 0.0 | 0 | 0.0 | 2 | 0.9 | 7 | 0.6 | 1 | 0.8 |
| 170–179 | 153 | 0.5 | 73.1 | 119 | 0.6 | 26 | 0.4 | 2 | 0.2 | 1 | 0.5 | 0 | 0.0 | 0 | 0.0 | 1 | 0.5 | 4 | 0.3 | 0 | 0.0 |
| 180–189 | 113 | 0.4 | 73.5 | 81 | 0.4 | 26 | 0.4 | 0 | 0.0 | 1 | 0.5 | 0 | 0.0 | 1 | 4.3 | 0 | 0.0 | 4 | 0.3 | 0 | 0.0 |
| 190–199 | 52 | 0.2 | 73.7 | 42 | 0.2 | 9 | 0.1 | 0 | 0.0 | 0 | 0.0 | 0 | 0.0 | 0 | 0.0 | 0 | 0.0 | 1 | 0.1 | 0 | 0.0 |
| 200–299 | 1,646 | 5.7 | 79.4 | 1,137 | 5.7 | 382 | 6.2 | 38 | 4.1 | 8 | 3.7 | 2 | 5.4 | 2 | 8.7 | 3 | 1.4 | 71 | 6.1 | 3 | 2.5 |
| 300–399 | 1,029 | 3.6 | 83.0 | 694 | 3.5 | 244 | 4.0 | 9 | 1.0 | 3 | 1.4 | 1 | 2.7 | 0 | 0.0 | 2 | 0.9 | 76 | 6.5 | 0 | 0.0 |
| 400–499 | 600 | 2.1 | 85.1 | 428 | 2.2 | 133 | 2.2 | 3 | 0.3 | 2 | 0.9 | 0 | 0.0 | 1 | 4.3 | 1 | 0.5 | 30 | 2.6 | 2 | 1.7 |
| 500–599 | 594 | 2.1 | 87.2 | 359 | 1.8 | 189 | 3.1 | 9 | 1.0 | 2 | 0.9 | 1 | 2.7 | 0 | 0.0 | 0 | 0.0 | 33 | 2.8 | 1 | 0.8 |
| 600–699 | 323 | 1.1 | 88.3 | 235 | 1.2 | 67 | 1.1 | 1 | 0.1 | 0 | 0.0 | 0 | 0.0 | 0 | 0.0 | 1 | 0.5 | 19 | 1.6 | 0 | 0.0 |
| 700–799 | 265 | 0.9 | 89.2 | 168 | 0.8 | 72 | 1.2 | 4 | 0.4 | 1 | 0.5 | 0 | 0.0 | 2 | 8.7 | 1 | 0.5 | 17 | 1.5 | 0 | 0.0 |
| 800–899 | 278 | 1.0 | 90.2 | 204 | 1.0 | 60 | 1.0 | 0 | 0.0 | 0 | 0.0 | 0 | 0.0 | 0 | 0.0 | 0 | 0.0 | 14 | 1.2 | 0 | 0.0 |
| 900–999 | 109 | 0.4 | 90.6 | 78 | 0.4 | 27 | 0.4 | 0 | 0.0 | 0 | 0.0 | 0 | 0.0 | 0 | 0.0 | 0 | 0.0 | 4 | 0.3 | 0 | 0.0 |
| 1,000–1,999 | 1,168 | 4.1 | 94.7 | 717 | 3.6 | 349 | 5.7 | 13 | 1.4 | 1 | 0.5 | 2 | 5.4 | 2 | 8.7 | 3 | 1.4 | 79 | 6.8 | 2 | 1.7 |
| 2,000–2,999 | 475 | 1.7 | 96.4 | 286 | 1.4 | 144 | 2.3 | 9 | 1.0 | 0 | 0.0 | 0 | 0.0 | 1 | 4.3 | 0 | 0.0 | 35 | 3.0 | 0 | 0.0 |
| 3,000–3,999 | 252 | 0.9 | 97.3 | 127 | 0.6 | 93 | 1.5 | 10 | 1.1 | 2 | 0.9 | 1 | 2.7 | 0 | 0.0 | 0 | 0.0 | 19 | 1.6 | 0 | 0.0 |
| 4,000-4,999 | 164 | 0.6 | 97.9 | 97 | 0.5 | 50 | 0.8 | 2 | 0.2 | 0 | 0.0 | 0 | 0.0 | 0 | 0.0 | 0 | 0.0 | 15 | 1.3 | 0 | 0.0 |
| 5,000-9,999 | 368 | 1.3 | 99.2 | 206 | 1.0 | 122 | 2.0 | 3 | 0.3 | 1 | 0.5 | 0 | 0.0 | 1 | 4.3 | 0 | 0.0 | 35 | 3.0 | 0 | 0.0 |
| Over 9,999 | 278 | 1.0 | 100.2 | 161 | 0.8 | 84 | 1.4 | 1 | 0.1 | 0 | 0.0 | 0 | 0.0 | 0 | 0.0 | 0 | 0.0 | 31 | 2.7 | 1 | 0.8 |
- 1 See Glossary of terms for definitions.
262 of 262 figures sit in a row or column sum that works out.
Reader’s notes
p. 255. 22 columns: stub, "Total number of situations", two "Total" percent columns, and nine number/percent pairs under "Type of situations". The crop is cut off at the bottom: the last row that is fully printed is "3,000–3,999" (its baseline sits right on the bottom edge of the image). Further size classes and any footnote block printed below the table are not on this image, so `footnotes` is empty even though the Total row carries a marker. Total row: the total number of situations is printed with a small raised 2 immediately before the figure (²28,660), transcribed as 28,660^2; the corresponding footnote text is below the crop. The cumulative-percent cell of the Total row holds a dash rule, transcribed as "". Print quality: the scan drops or blurs many decimal points, so several percent cells read as two digit groups separated by a space. I have read them as decimals, and the reading is corroborated by the arithmetic of the cumulative column and by each number divided by its column total. Examples: 10–19 CA percent printed "9 1" → 9.1; 10–19 CG percent "8 7" → 8.7; 20–29 cumulative "41 3" → 41.3; 50–59 CP percent "8 2." → 8.2; 60–69 CC percent "1 2" → 1.2; 70–79 CC "1 9" → 1.9; 80–89 CC "1 3" → 1.3; 100–109 percent of all "4 7" → 4.7; 120–129 CB "1 1" → 1.1; 120–129 CA-CB "1 3" → 1.3; 160–169 CA percent "0 5" → 0.5; 190–199 cumulative "73 7" → 73.7, CB percent "0 1" → 0.1, CC percent "0 0" → 0.0, CP percent "0 0" → 0.0; 200–299 cumulative "79 4" → 79.4, CC percent "4 1" → 4.1, CP percent "1 4" → 1.4; 300–399 cumulative "83 0" → 83.0; 600–699 CP percent "0 5" → 0.5; 900–999 percent of all "0 4" → 0.4; 1,000–1,999 CC percent "1 4" → 1.4; 3,000–3,999 cumulative "97 3" → 97.3. Stray ink specks sit beside some cells (left of the "Other C combinations" number for "Under 10" and for 120–129, left of the CG number for 20–29, left of the CE number and the CG/CP numbers in the 3,000–3,999 row, and above the CA number for 300–399 and 700–799). They are scan noise, not digits or footnote markers, and are not transcribed.
p. 256. The crop is a landscape-printed table captured rotated 90 degrees (column headings run bottom-to-top in the image); the grid above is given in normal left-to-right order, stub first. This is a continuation page: only the last three size-class rows (4,000-4,999; 5,000-9,999; Over 9,999) are printed here, and no grand-total row appears in the crop. The column headings are printed on this page, so they are transcribed. Header structure: the "Total" spanner appears to cover only "Percent of all situations" and "Cumulative percent of all situations", with "Total number of situations" printed as a full-height heading beside it (not under "Total"). At this scan resolution I cannot be fully certain the "Total" box does not also extend over "Total number of situations"; if it does, that column's level-1 cell should read "Total" instead. Doubtful glyphs (all resolved from context, since every other percent cell carries one decimal place): the decimal point is very faint in CG "Percent by size class" for row 5,000-9,999 (prints like "4 3", read as 4.3) and in "Other C combinations / Percent by size class" for rows 4,000-4,999 and 5,000-9,999 (print like "0 0", read as 0.0). Arithmetic check (transcribed as printed, not corrected): the type-of-situation counts sum exactly to the printed totals in every row (97+50+2+0+0+0+0+15+0=164; 206+122+3+1+0+1+0+35+0=368; 161+84+1+0+0+0+0+31+1=278). The cumulative percent in the last row is printed as 100.2, i.e. above 100; it is consistent with the printed percents (97.9+1.3=99.2, 99.2+1.0=100.2) and is a rounding artifact in the source, left as printed. The footnote line sits at the very bottom edge of the crop and its descenders are slightly clipped; the wording "See Glossary of terms for definitions." is legible but the word order is the one place I would flag for a second look.
Source image
Source data: U.S. NLRB Annual Reports (public domain). Reconstruction by NLRB Stats Archive. Read by claude-opus-5 (effort max, prompt extract_v1) from the 300-dpi scan; stitched by page. Updated October 2026.