NLRB Stats Archive › Annual Reports › FY1986 › Proceedings Decided by Circuit Courts of Appeals on Petitions for Enforcement and/or Review of Board Orders, Fiscal Year 1986, Compared With 5-Year Cumulative Totals, Fiscal Years 1981 Through 1985
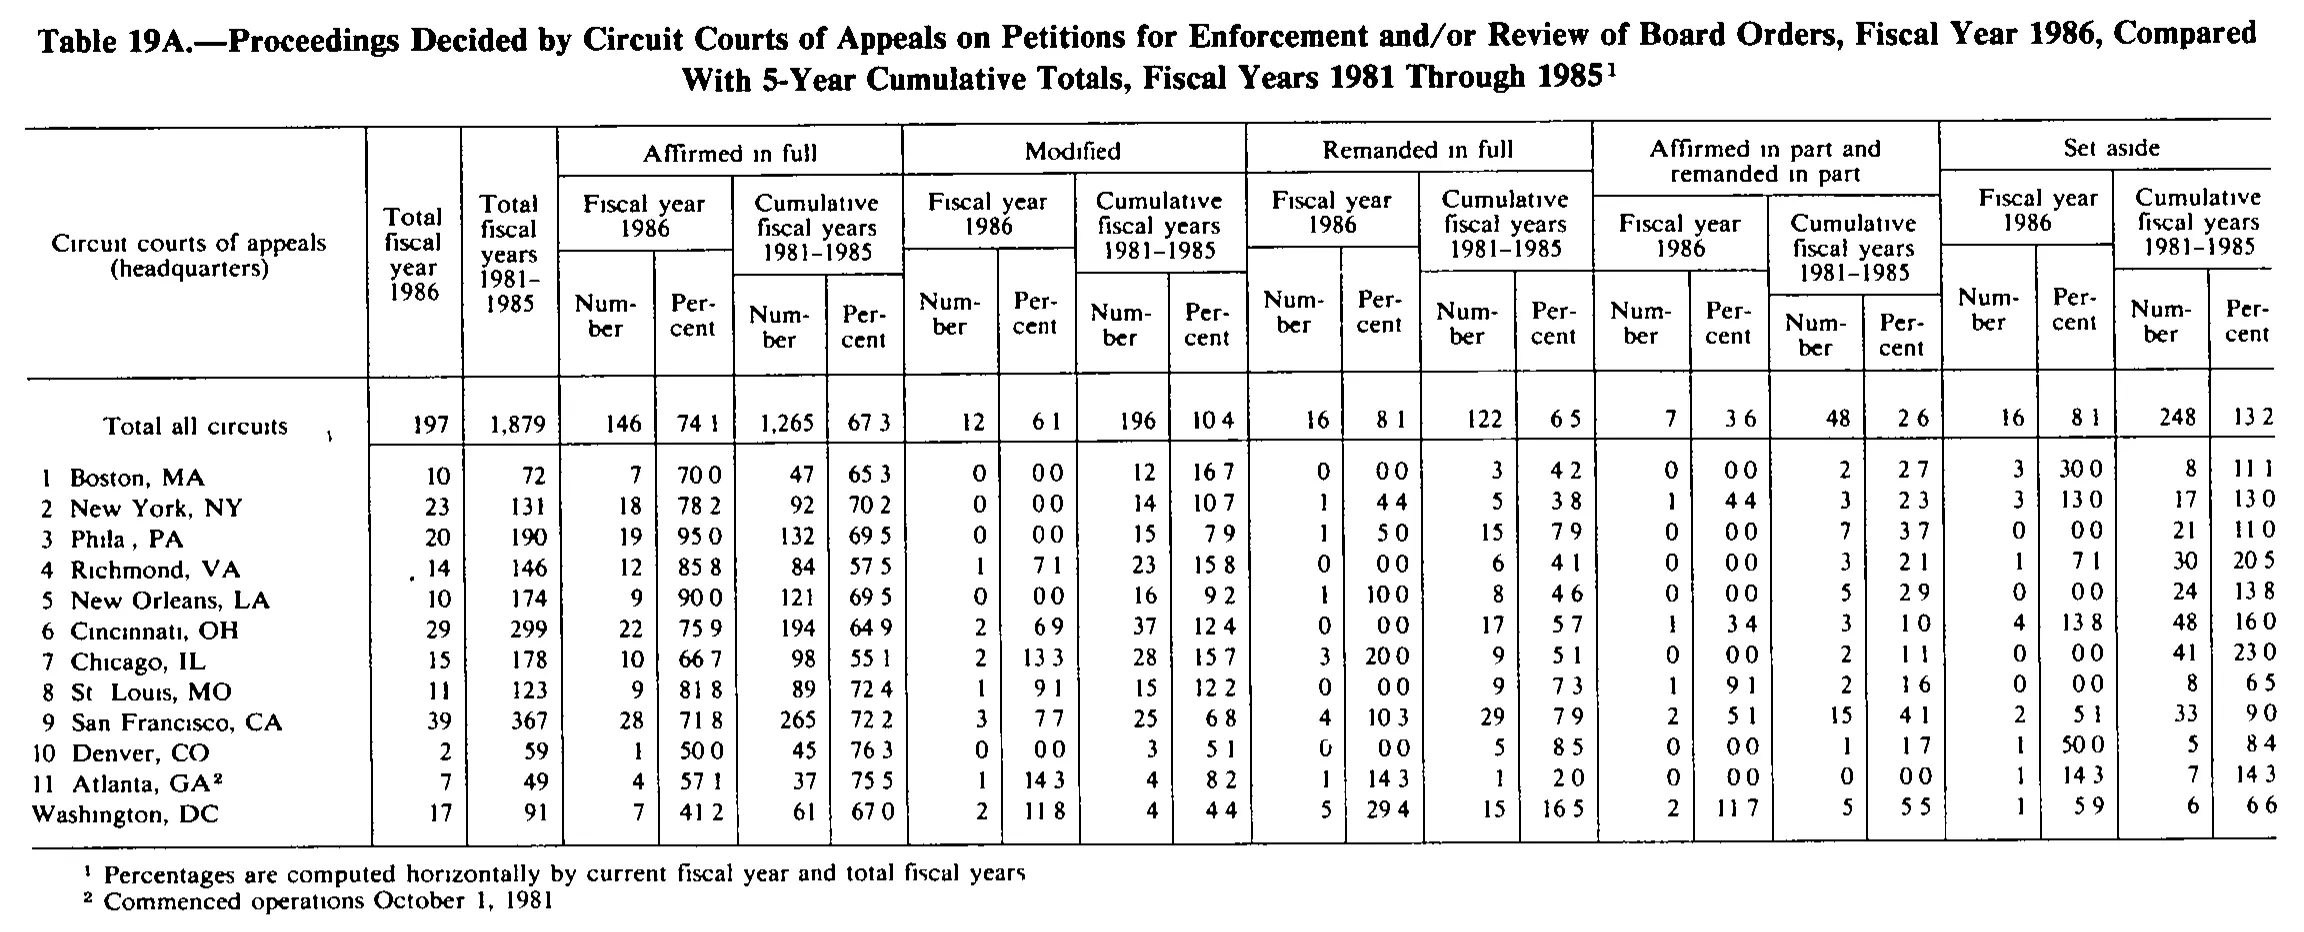
Proceedings Decided by Circuit Courts of Appeals on Petitions for Enforcement and/or Review of Board Orders, Fiscal Year 1986, Compared With 5-Year Cumulative Totals, Fiscal Years 1981 Through 1985
| Circuit courts of appeals (headquarters) | Total fiscal year 1986 | Total fiscal years 1981-1985 | Affirmed in full | Modified | Remanded in full | Affirmed in part and remanded in part | Set aside | |||||||||||||||
|---|---|---|---|---|---|---|---|---|---|---|---|---|---|---|---|---|---|---|---|---|---|---|
| Circuit courts of appeals (headquarters) | Total fiscal year 1986 | Total fiscal years 1981-1985 | Fiscal year 1986 | Cumulative fiscal years 1981-1985 | Fiscal year 1986 | Cumulative fiscal years 1981-1985 | Fiscal year 1986 | Cumulative fiscal years 1981-1985 | Fiscal year 1986 | Cumulative fiscal years 1981-1985 | Fiscal year 1986 | Cumulative fiscal years 1981-1985 | ||||||||||
| Circuit courts of appeals (headquarters) | Total fiscal year 1986 | Total fiscal years 1981-1985 | Number | Percent | Number | Percent | Number | Percent | Number | Percent | Number | Percent | Number | Percent | Number | Percent | Number | Percent | Number | Percent | Number | Percent |
| Total all circuits | 197 | 1,879 | 146 | 74.1 | 1,265 | 67.3 | 12 | 6.1 | 196 | 10.4 | 16 | 8.1 | 122 | 6.5 | 7 | 3.6 | 48 | 2.6 | 16 | 8.1 | 248 | 13.2 |
| 1 Boston, MA | 10 | 72 | 7 | 70.0 | 47 | 65.3 | 0 | 0.0 | 12 | 16.7 | 0 | 0.0 | 3 | 4.2 | 0 | 0.0 | 2 | 2.7 | 3 | 30.0 | 8 | 11.1 |
| 2 New York, NY | 23 | 131 | 18 | 78.2 | 92 | 70.2 | 0 | 0.0 | 14 | 10.7 | 1 | 4.4 | 5 | 3.8 | 1 | 4.4 | 3 | 2.3 | 3 | 13.0 | 17 | 13.0 |
| 3 Phila., PA | 20 | 190 | 19 | 95.0 | 132 | 69.5 | 0 | 0.0 | 15 | 7.9 | 1 | 5.0 | 15 | 7.9 | 0 | 0.0 | 7 | 3.7 | 0 | 0.0 | 21 | 11.0 |
| 4 Richmond, VA | 14 | 146 | 12 | 85.8 | 84 | 57.5 | 1 | 7.1 | 23 | 15.8 | 0 | 0.0 | 6 | 4.1 | 0 | 0.0 | 3 | 2.1 | 1 | 7.1 | 30 | 20.5 |
| 5 New Orleans, LA | 10 | 174 | 9 | 90.0 | 121 | 69.5 | 0 | 0.0 | 16 | 9.2 | 1 | 10.0 | 8 | 4.6 | 0 | 0.0 | 5 | 2.9 | 0 | 0.0 | 24 | 13.8 |
| 6 Cincinnati, OH | 29 | 299 | 22 | 75.9 | 194 | 64.9 | 2 | 6.9 | 37 | 12.4 | 0 | 0.0 | 17 | 5.7 | 1 | 3.4 | 3 | 1.0 | 4 | 13.8 | 48 | 16.0 |
| 7 Chicago, IL | 15 | 178 | 10 | 66.7 | 98 | 55.1 | 2 | 13.3 | 28 | 15.7 | 3 | 20.0 | 9 | 5.1 | 0 | 0.0 | 2 | 1.1 | 0 | 0.0 | 41 | 23.0 |
| 8 St. Louis, MO | 11 | 123 | 9 | 81.8 | 89 | 72.4 | 1 | 9.1 | 15 | 12.2 | 0 | 0.0 | 9 | 7.3 | 1 | 9.1 | 2 | 1.6 | 0 | 0.0 | 8 | 6.5 |
| 9 San Francisco, CA | 39 | 367 | 28 | 71.8 | 265 | 72.2 | 3 | 7.7 | 25 | 6.8 | 4 | 10.3 | 29 | 7.9 | 2 | 5.1 | 15 | 4.1 | 2 | 5.1 | 33 | 9.0 |
| 10 Denver, CO | 2 | 59 | 1 | 50.0 | 45 | 76.3 | 0 | 0.0 | 3 | 5.1 | 0 | 0.0 | 5 | 8.5 | 0 | 0.0 | 1 | 1.7 | 1 | 50.0 | 5 | 8.4 |
| 11 Atlanta, GA | 7 | 49 | 4 | 57.1 | 37 | 75.5 | 1 | 14.3 | 4 | 8.2 | 1 | 14.3 | 1 | 2.0 | 0 | 0.0 | 0 | 0.0 | 1 | 14.3 | 7 | 14.3 |
| Washington, DC | 17 | 91 | 7 | 41.2 | 61 | 67.0 | 2 | 11.8 | 4 | 4.4 | 5 | 29.4 | 15 | 16.5 | 2 | 11.7 | 5 | 5.5 | 1 | 5.9 | 6 | 6.6 |
- 1 Percentages are computed horizontally by current fiscal year and total fiscal years
- 2 Commenced operations October 1, 1981
134 of 134 figures sit in a row or column sum that works out.
Reader’s notes
p. 281. Decimal points: every "Percent" cell is printed with one decimal place, but in this 1-bit scan the decimal point is mostly lost and reads as a space ("74 1", "67 3"). I have restored the point before the final digit in all percent cells (so "74 1" is transcribed 74.1). Likewise the abbreviation periods in "Phila., PA" and "St. Louis, MO" are faint/absent in the scan and have been restored; the stub labels are otherwise exactly as printed, including the circuit numbers and the unnumbered "Washington, DC" row. Counts are well supported: every Number column sums to the "Total all circuits" row, and each row's five Number cells sum to that row's Total column, in both the fiscal-year-1986 and the cumulative 1981-1985 halves. Doubtful final percent digits. Footnote 1 says percentages are computed horizontally, and most cells match that computation after normal rounding, but six cells as I read them do not; each involves a last digit that is hard to resolve at this scan quality (7/8, 2/3, 4/5), so they may be my misreading rather than misprints: Boston, MA, "Affirmed in part and remanded in part / Cumulative 1981-1985 / Percent" reads 2.7 (2 of 72 = 2.8); New York, NY, "Affirmed in full / Fiscal year 1986 / Percent" reads 78.2 (18 of 23 = 78.3); New York, NY, "Remanded in full / Fiscal year 1986 / Percent" and "Affirmed in part / Fiscal year 1986 / Percent" both read 4.4 (1 of 23 = 4.3); Richmond, VA, "Affirmed in full / Fiscal year 1986 / Percent" reads 85.8 (12 of 14 = 85.7); Denver, CO, "Set aside / Cumulative 1981-1985 / Percent" reads 8.4 (5 of 59 = 8.5, and the Remanded cell in the same row, also 5 of 59, reads 8.5); Washington, DC, "Affirmed in part / Fiscal year 1986 / Percent" reads 11.7 (2 of 17 = 11.8, and the Modified cell in the same row, also 2 of 17, reads 11.8). Values are transcribed as read, uncorrected. Minor scan artifacts, not transcribed: a stray dot sits just left of the 14 in the Richmond, VA "Total fiscal year 1986" cell, and a comma-like speck follows the "Total all circuits" label. Denver, CO, "Remanded in full / Fiscal year 1986 / Number" is a smudged glyph read as 0; the column sum of 16 confirms 0.
Source image
Source data: U.S. NLRB Annual Reports (public domain). Reconstruction by NLRB Stats Archive. Read by claude-opus-5 (effort max, prompt extract_v1) from the 300-dpi scan; stitched by page. Updated October 2026.