NLRB Stats Archive › Annual Reports › FY1986 › Cases received, by standard Federal administrative region
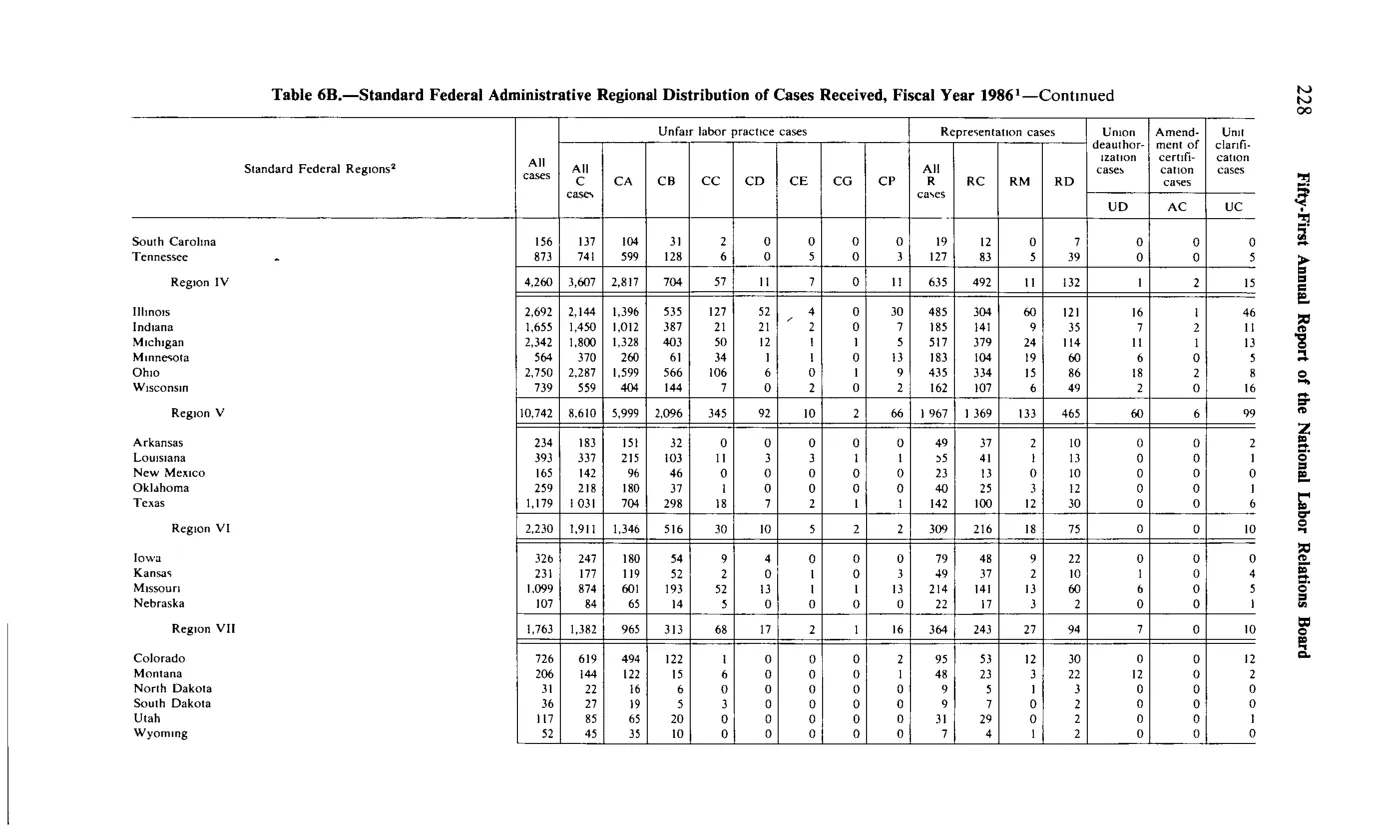
Cases received, by standard Federal administrative region
| Standard Federal Regions / State | All cases | Unfair labor practice cases — All C cases | CA | CB | CC | CD | CE | CG | CP | Representation cases — All R cases | RC | RM | RD | Union deauthorization cases UD | Amendment of certification cases AC | Unit clarification cases UC |
|---|---|---|---|---|---|---|---|---|---|---|---|---|---|---|---|---|
| Region IV — subtotal (Sunbelt DHHS: SC + TN + ... institutional 8-state cluster) | 4,260 | 3,607 | 2,817 | 704 | 57 | 11 | 2 | 9 | 7 | 635 | 492 | 13 | 132 | 1 | 2 | 15 |
| Region V — subtotal (Midwest industrial-heartland IL + IN + MI + MN + OH + WI) | 10,742 | 8,610 | 5,999 | 2,096 | 345 | 92 | 10 | 2 | 66 | 1,967 | 1,369 | 133 | 465 | 60 | 6 | 99 |
| Region VI — subtotal (AR + LA + NM + OK + TX) | 2,201 | 1,911 | 1,346 | 516 | 30 | 10 | 5 | 2 | 2 | 309 | 216 | 18 | 75 | 0 | 0 | 10 |
| Region VII — subtotal (Iowa + Kansas + Missouri + Nebraska) | 1,763 | 1,382 | 965 | 313 | 68 | 17 | 2 | 1 | 16 | 364 | 243 | 27 | 94 | 7 | 0 | 10 |
| Per-state Region IV+V+VI+VII+VIII |
Source image
Source data: U.S. NLRB Annual Reports (public domain). Reconstruction by NLRB Stats Archive. Updated June 2026.