NLRB Stats Archive › Annual Reports › FY1986 › Geographic Distribution of Cases Received, Fiscal Year 1986
Geographic Distribution of Cases Received, Fiscal Year 1986
Stitched from pp. 237–239.
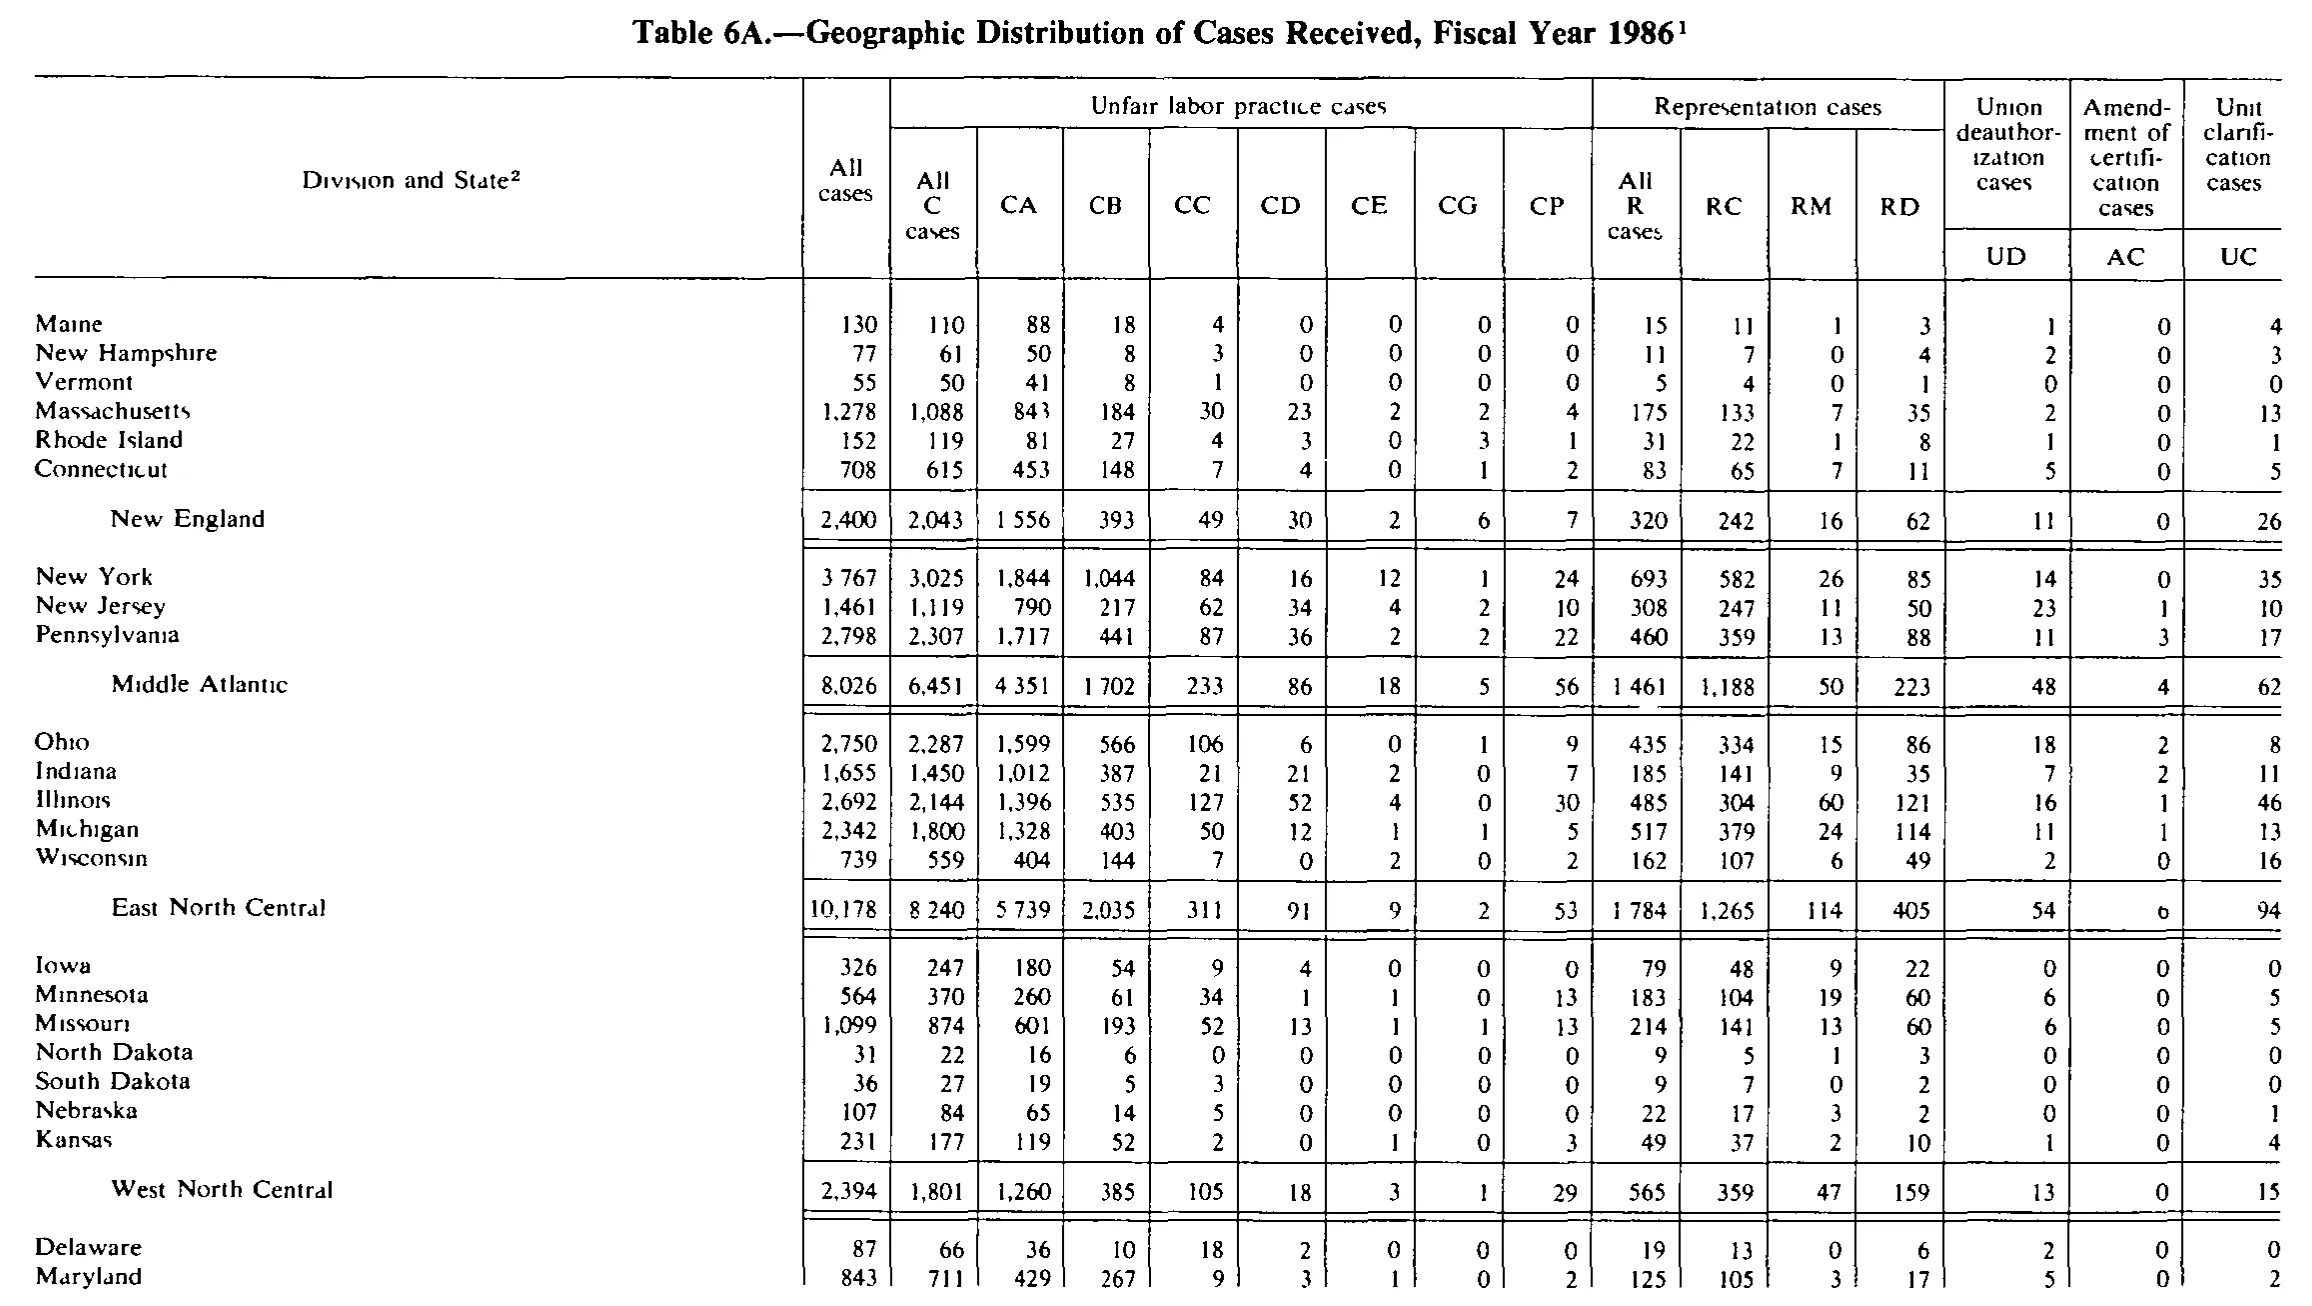
| Division and State | All cases | Unfair labor practice cases | Representation cases | Union deauthorization cases | Amendment of certification cases | Unit clarification cases | ||||||||||
|---|---|---|---|---|---|---|---|---|---|---|---|---|---|---|---|---|
| Division and State | All cases | All C cases | CA | CB | CC | CD | CE | CG | CP | All R cases | RC | RM | RD | Union deauthorization cases | Amendment of certification cases | Unit clarification cases |
| Division and State | All cases | All C cases | CA | CB | CC | CD | CE | CG | CP | All R cases | RC | RM | RD | UD | AC | UC |
| Maine | 130 | 110 | 88 | 18 | 4 | 0 | 0 | 0 | 0 | 15 | 11 | 1 | 3 | 1 | 0 | 4 |
| New Hampshire | 77 | 61 | 50 | 8 | 3 | 0 | 0 | 0 | 0 | 11 | 7 | 0 | 4 | 2 | 0 | 3 |
| Vermont | 55 | 50 | 41 | 8 | 1 | 0 | 0 | 0 | 0 | 5 | 4 | 0 | 1 | 0 | 0 | 0 |
| Massachusetts | 1,278 | 1,088 | 843 | 184 | 30 | 23 | 2 | 2 | 4 | 175 | 133 | 7 | 35 | 2 | 0 | 13 |
| Rhode Island | 152 | 119 | 81 | 27 | 4 | 3 | 0 | 3 | 1 | 31 | 22 | 1 | 8 | 1 | 0 | 1 |
| Connecticut | 708 | 615 | 453 | 148 | 7 | 4 | 0 | 1 | 2 | 83 | 65 | 7 | 11 | 5 | 0 | 5 |
| New England | 2,400 | 2,043 | 1,556 | 393 | 49 | 30 | 2 | 6 | 7 | 320 | 242 | 16 | 62 | 11 | 0 | 26 |
| New York | 3,767 | 3,025 | 1,844 | 1,044 | 84 | 16 | 12 | 1 | 24 | 693 | 582 | 26 | 85 | 14 | 0 | 35 |
| New Jersey | 1,461 | 1,119 | 790 | 217 | 62 | 34 | 4 | 2 | 10 | 308 | 247 | 11 | 50 | 23 | 1 | 10 |
| Pennsylvania | 2,798 | 2,307 | 1,717 | 441 | 87 | 36 | 2 | 2 | 22 | 460 | 359 | 13 | 88 | 11 | 3 | 17 |
| Middle Atlantic | 8,026 | 6,451 | 4,351 | 1,702 | 233 | 86 | 18 | 5 | 56 | 1,461 | 1,188 | 50 | 223 | 48 | 4 | 62 |
| Ohio | 2,750 | 2,287 | 1,599 | 566 | 106 | 6 | 0 | 1 | 9 | 435 | 334 | 15 | 86 | 18 | 2 | 8 |
| Indiana | 1,655 | 1,450 | 1,012 | 387 | 21 | 21 | 2 | 0 | 7 | 185 | 141 | 9 | 35 | 7 | 2 | 11 |
| Illinois | 2,692 | 2,144 | 1,396 | 535 | 127 | 52 | 4 | 0 | 30 | 485 | 304 | 60 | 121 | 16 | 1 | 46 |
| Michigan | 2,342 | 1,800 | 1,328 | 403 | 50 | 12 | 1 | 1 | 5 | 517 | 379 | 24 | 114 | 11 | 1 | 13 |
| Wisconsin | 739 | 559 | 404 | 144 | 7 | 0 | 2 | 0 | 2 | 162 | 107 | 6 | 49 | 2 | 0 | 16 |
| East North Central | 10,178 | 8,240 | 5,739 | 2,035 | 311 | 91 | 9 | 2 | 53 | 1,784 | 1,265 | 114 | 405 | 54 | 6 | 94 |
| Iowa | 326 | 247 | 180 | 54 | 9 | 4 | 0 | 0 | 0 | 79 | 48 | 9 | 22 | 0 | 0 | 0 |
| Minnesota | 564 | 370 | 260 | 61 | 34 | 1 | 1 | 0 | 13 | 183 | 104 | 19 | 60 | 6 | 0 | 5 |
| Missouri | 1,099 | 874 | 601 | 193 | 52 | 13 | 1 | 1 | 13 | 214 | 141 | 13 | 60 | 6 | 0 | 5 |
| North Dakota | 31 | 22 | 16 | 6 | 0 | 0 | 0 | 0 | 0 | 9 | 5 | 1 | 3 | 0 | 0 | 0 |
| South Dakota | 36 | 27 | 19 | 5 | 3 | 0 | 0 | 0 | 0 | 9 | 7 | 0 | 2 | 0 | 0 | 0 |
| Nebraska | 107 | 84 | 65 | 14 | 5 | 0 | 0 | 0 | 0 | 22 | 17 | 3 | 2 | 0 | 0 | 1 |
| Kansas | 231 | 177 | 119 | 52 | 2 | 0 | 1 | 0 | 3 | 49 | 37 | 2 | 10 | 1 | 0 | 4 |
| West North Central | 2,394 | 1,801 | 1,260 | 385 | 105 | 18 | 3 | 1 | 29 | 565 | 359 | 47 | 159 | 13 | 0 | 15 |
| Delaware | 87 | 66 | 36 | 10 | 18 | 2 | 0 | 0 | 0 | 19 | 13 | 0 | 6 | 2 | 0 | 0 |
| Maryland | 843 | 711 | 429 | 267 | 9 | 3 | 1 | 0 | 2 | 125 | 105 | 3 | 17 | 5 | 0 | 2 |
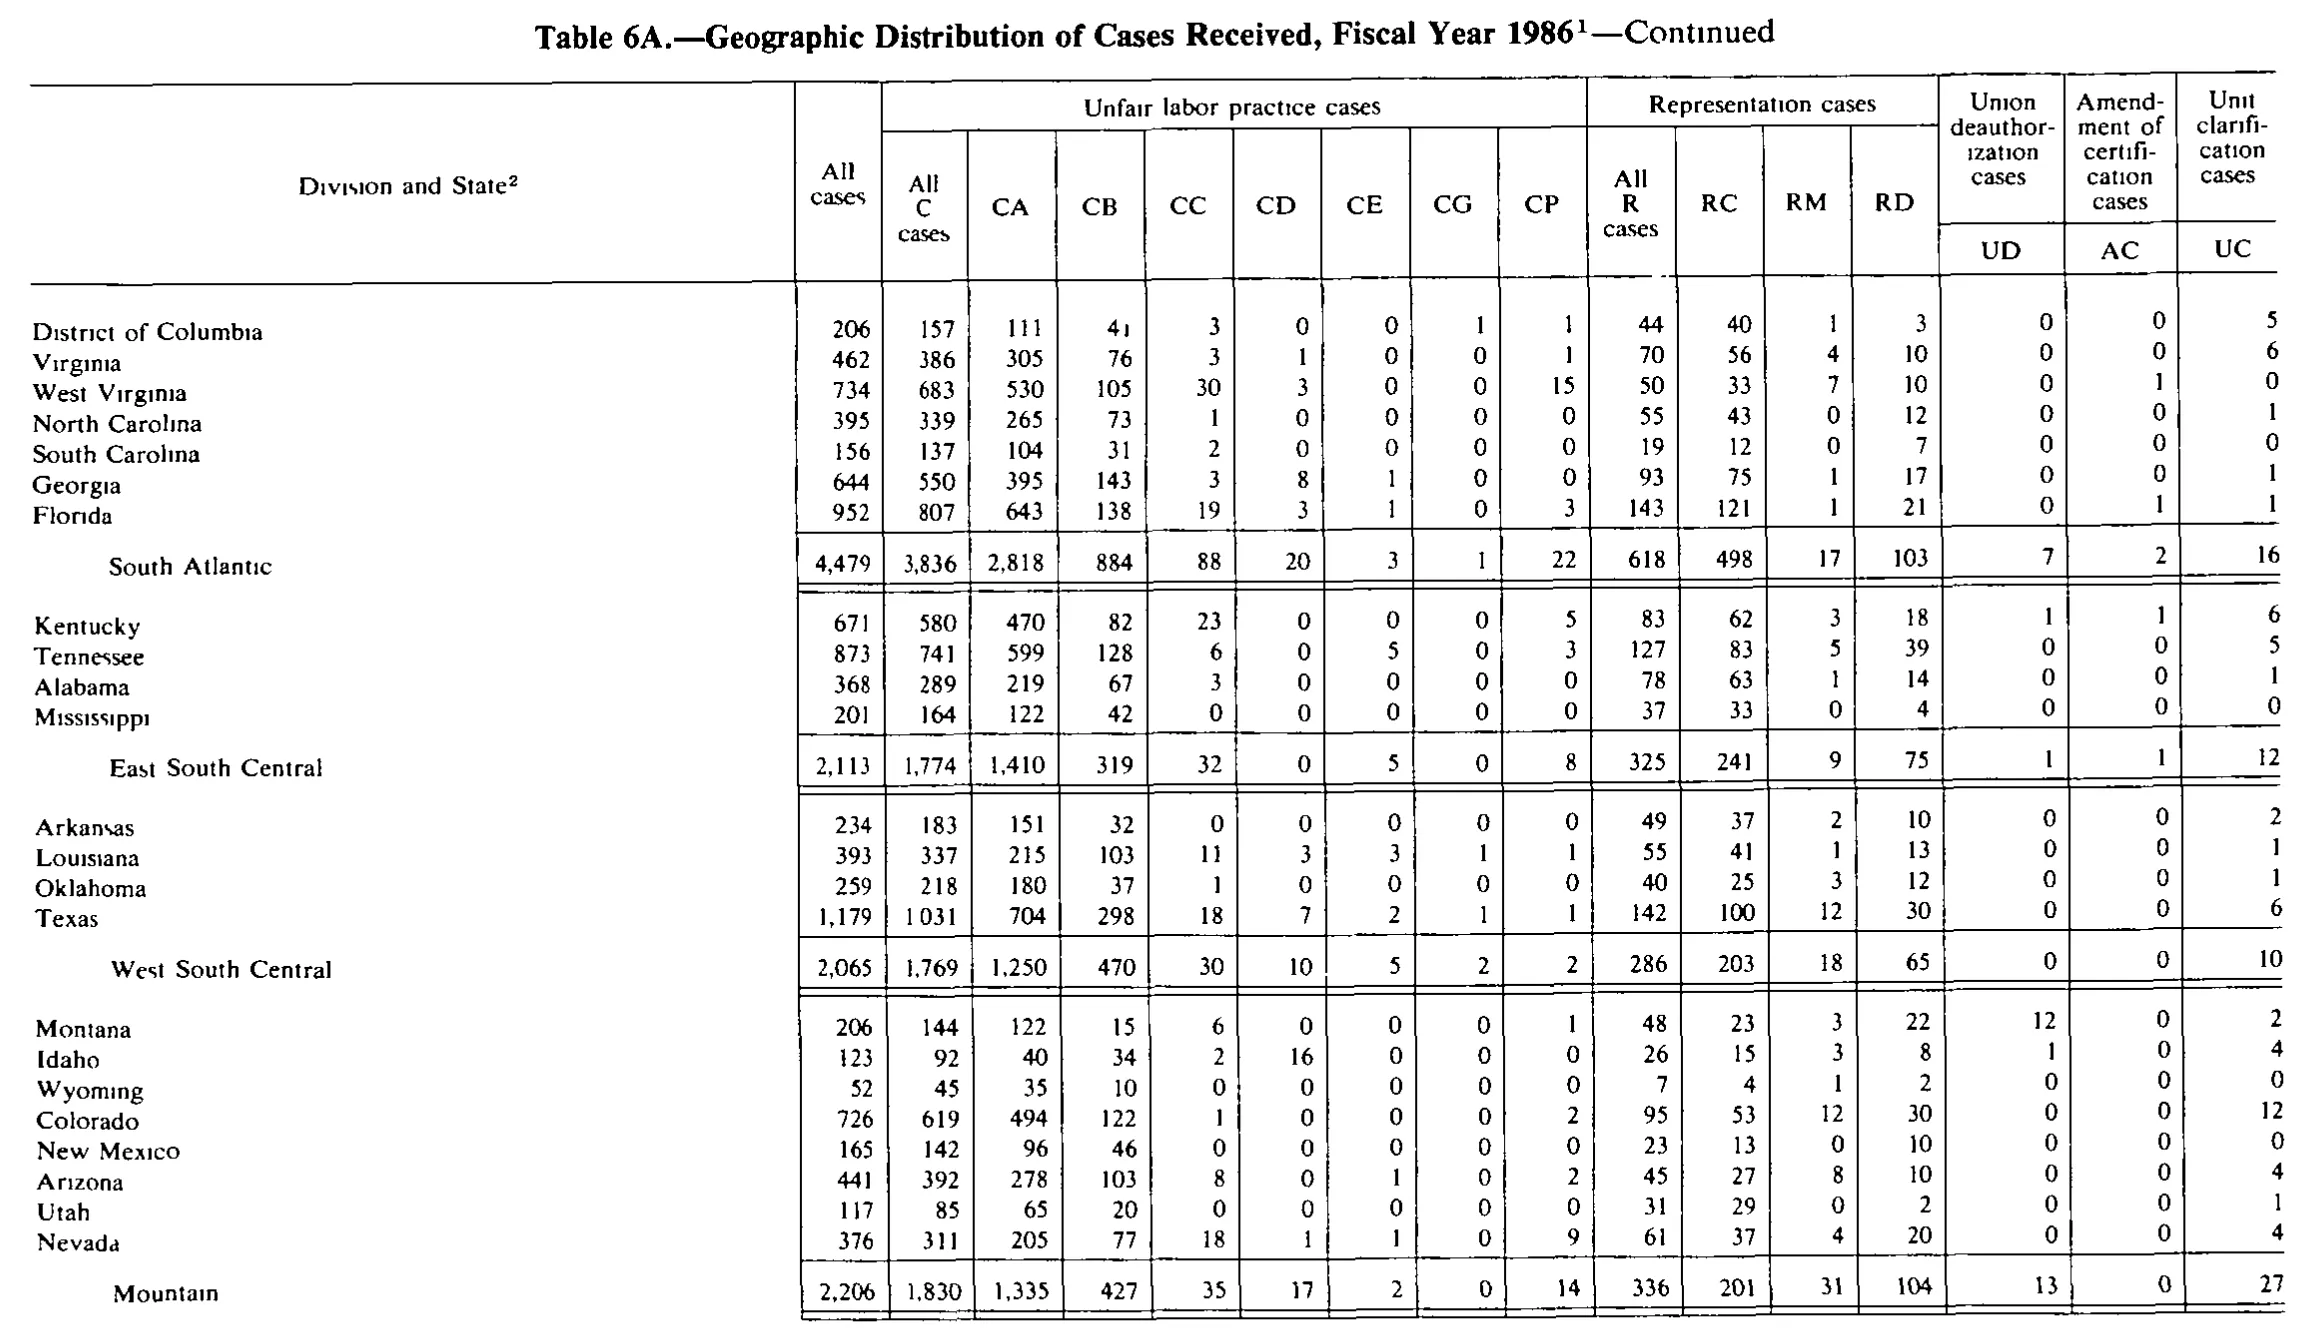
| District of Columbia | 206 | 157 | 111 | 41 | 3 | 0 | 0 | 1 | 1 | 44 | 40 | 1 | 3 | 0 | 0 | 5 |
| Virginia | 462 | 386 | 305 | 76 | 3 | 1 | 0 | 0 | 1 | 70 | 56 | 4 | 10 | 0 | 0 | 6 |
| West Virginia | 734 | 683 | 530 | 105 | 30 | 3 | 0 | 0 | 15 | 50 | 33 | 7 | 10 | 0 | 1 | 0 |
| North Carolina | 395 | 339 | 265 | 73 | 1 | 0 | 0 | 0 | 0 | 55 | 43 | 0 | 12 | 0 | 0 | 1 |
| South Carolina | 156 | 137 | 104 | 31 | 2 | 0 | 0 | 0 | 0 | 19 | 12 | 0 | 7 | 0 | 0 | 0 |
| Georgia | 644 | 550 | 395 | 143 | 3 | 8 | 1 | 0 | 0 | 93 | 75 | 1 | 17 | 0 | 0 | 1 |
| Florida | 952 | 807 | 643 | 138 | 19 | 3 | 1 | 0 | 3 | 143 | 121 | 1 | 21 | 0 | 1 | 1 |
| South Atlantic | 4,479 | 3,836 | 2,818 | 884 | 88 | 20 | 3 | 1 | 22 | 618 | 498 | 17 | 103 | 7 | 2 | 16 |
| Kentucky | 671 | 580 | 470 | 82 | 23 | 0 | 0 | 0 | 5 | 83 | 62 | 3 | 18 | 1 | 1 | 6 |
| Tennessee | 873 | 741 | 599 | 128 | 6 | 0 | 5 | 0 | 3 | 127 | 83 | 5 | 39 | 0 | 0 | 5 |
| Alabama | 368 | 289 | 219 | 67 | 3 | 0 | 0 | 0 | 0 | 78 | 63 | 1 | 14 | 0 | 0 | 1 |
| Mississippi | 201 | 164 | 122 | 42 | 0 | 0 | 0 | 0 | 0 | 37 | 33 | 0 | 4 | 0 | 0 | 0 |
| East South Central | 2,113 | 1,774 | 1,410 | 319 | 32 | 0 | 5 | 0 | 8 | 325 | 241 | 9 | 75 | 1 | 1 | 12 |
| Arkansas | 234 | 183 | 151 | 32 | 0 | 0 | 0 | 0 | 0 | 49 | 37 | 2 | 10 | 0 | 0 | 2 |
| Louisiana | 393 | 337 | 215 | 103 | 11 | 3 | 3 | 1 | 1 | 55 | 41 | 1 | 13 | 0 | 0 | 1 |
| Oklahoma | 259 | 218 | 180 | 37 | 1 | 0 | 0 | 0 | 0 | 40 | 25 | 3 | 12 | 0 | 0 | 1 |
| Texas | 1,179 | 1,031 | 704 | 298 | 18 | 7 | 2 | 1 | 1 | 142 | 100 | 12 | 30 | 0 | 0 | 6 |
| West South Central | 2,065 | 1,769 | 1,250 | 470 | 30 | 10 | 5 | 2 | 2 | 286 | 203 | 18 | 65 | 0 | 0 | 10 |
| Montana | 206 | 144 | 122 | 15 | 6 | 0 | 0 | 0 | 1 | 48 | 23 | 3 | 22 | 12 | 0 | 2 |
| Idaho | 123 | 92 | 40 | 34 | 2 | 16 | 0 | 0 | 0 | 26 | 15 | 3 | 8 | 1 | 0 | 4 |
| Wyoming | 52 | 45 | 35 | 10 | 0 | 0 | 0 | 0 | 0 | 7 | 4 | 1 | 2 | 0 | 0 | 0 |
| Colorado | 726 | 619 | 494 | 122 | 1 | 0 | 0 | 0 | 2 | 95 | 53 | 12 | 30 | 0 | 0 | 12 |
| New Mexico | 165 | 142 | 96 | 46 | 0 | 0 | 0 | 0 | 0 | 23 | 13 | 0 | 10 | 0 | 0 | 0 |
| Arizona | 441 | 392 | 278 | 103 | 8 | 0 | 1 | 0 | 2 | 45 | 27 | 8 | 10 | 0 | 0 | 4 |
| Utah | 117 | 85 | 65 | 20 | 0 | 0 | 0 | 0 | 0 | 31 | 29 | 0 | 2 | 0 | 0 | 1 |
| Nevada | 376 | 311 | 205 | 77 | 18 | 1 | 1 | 0 | 9 | 61 | 37 | 4 | 20 | 0 | 0 | 4 |
| Mountain | 2,206 | 1,830 | 1,335 | 427 | 35 | 17 | 2 | 0 | 14 | 336 | 201 | 31 | 104 | 13 | 0 | 27 |
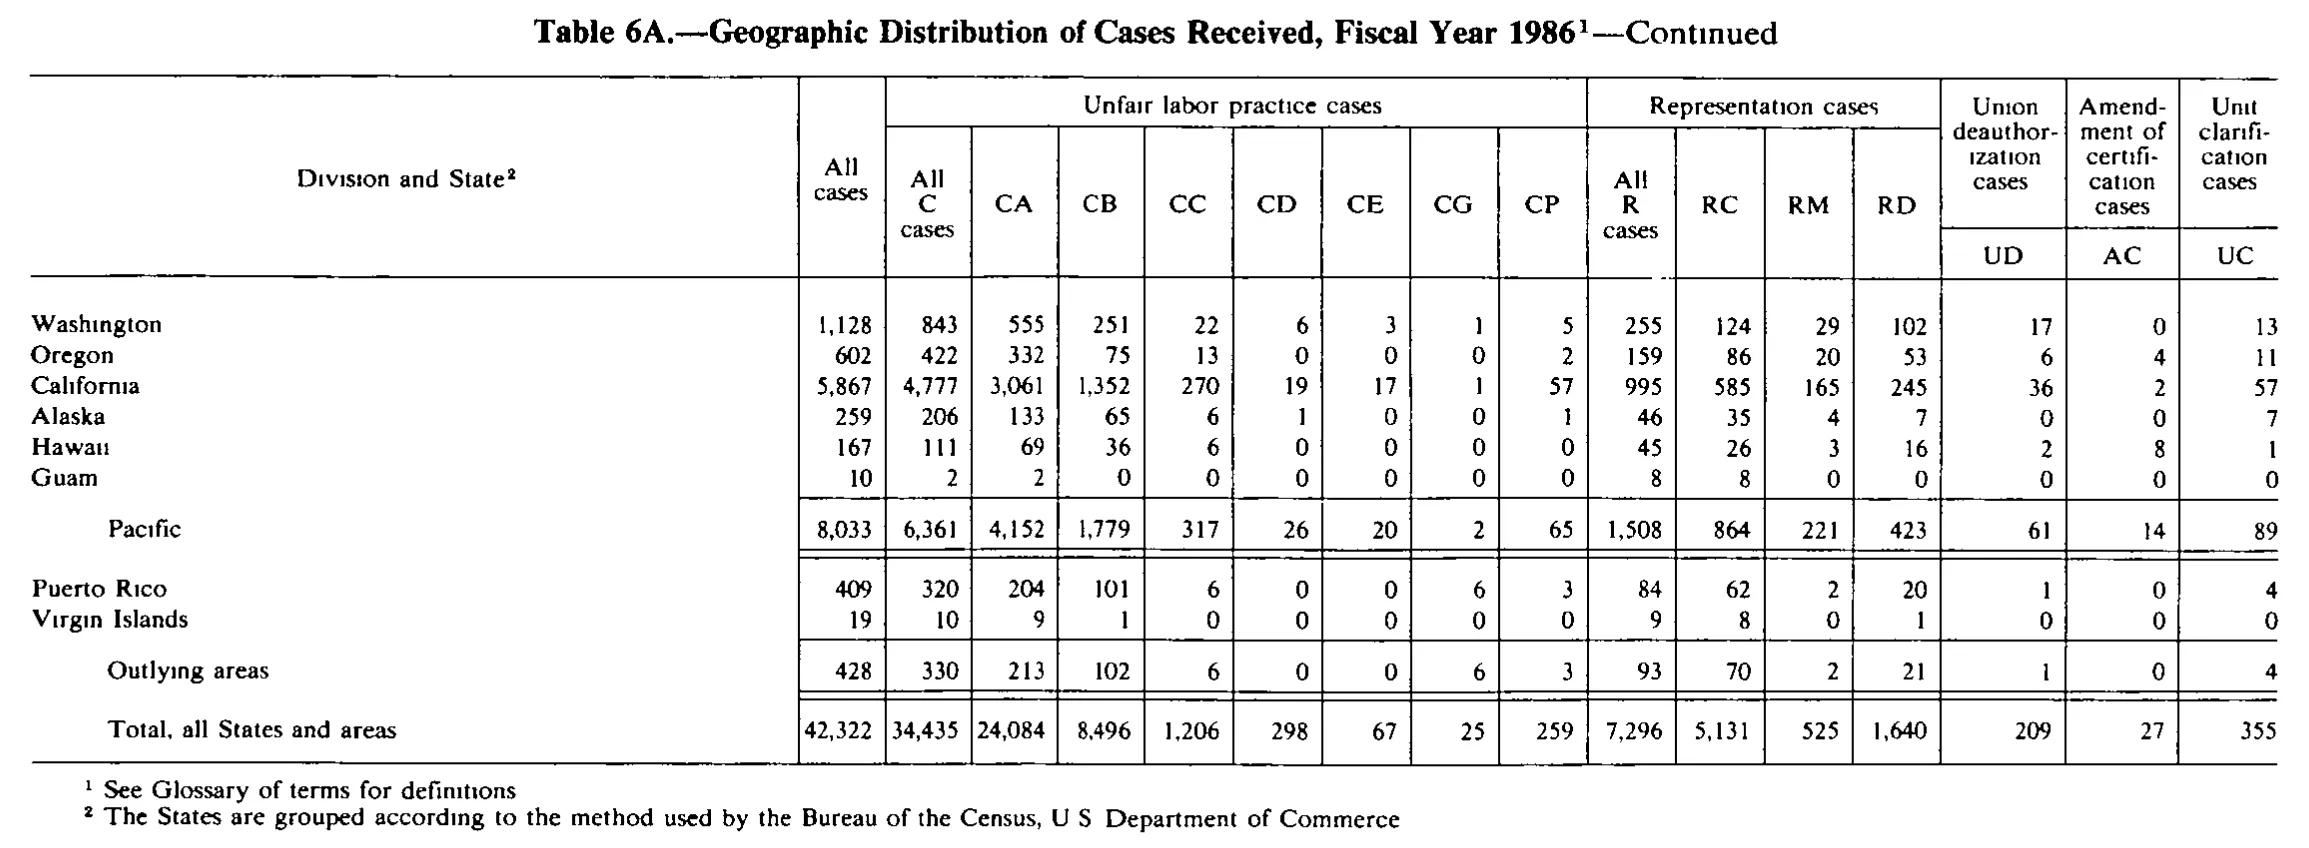
| Washington | 1,128 | 843 | 555 | 251 | 22 | 6 | 3 | 1 | 5 | 255 | 124 | 29 | 102 | 17 | 0 | 13 |
| Oregon | 602 | 422 | 332 | 75 | 13 | 0 | 0 | 0 | 2 | 159 | 86 | 20 | 53 | 6 | 4 | 11 |
| California | 5,867 | 4,777 | 3,061 | 1,352 | 270 | 19 | 17 | 1 | 57 | 995 | 585 | 165 | 245 | 36 | 2 | 57 |
| Alaska | 259 | 206 | 133 | 65 | 6 | 1 | 0 | 0 | 1 | 46 | 35 | 4 | 7 | 0 | 0 | 7 |
| Hawaii | 167 | 111 | 69 | 36 | 6 | 0 | 0 | 0 | 0 | 45 | 26 | 3 | 16 | 2 | 8 | 1 |
| Guam | 10 | 2 | 2 | 0 | 0 | 0 | 0 | 0 | 0 | 8 | 8 | 0 | 0 | 0 | 0 | 0 |
| Pacific | 8,033 | 6,361 | 4,152 | 1,779 | 317 | 26 | 20 | 2 | 65 | 1,508 | 864 | 221 | 423 | 61 | 14 | 89 |
| Puerto Rico | 409 | 320 | 204 | 101 | 6 | 0 | 0 | 6 | 3 | 84 | 62 | 2 | 20 | 1 | 0 | 4 |
| Virgin Islands | 19 | 10 | 9 | 1 | 0 | 0 | 0 | 0 | 0 | 9 | 8 | 0 | 1 | 0 | 0 | 0 |
| Outlying areas | 428 | 330 | 213 | 102 | 6 | 0 | 0 | 6 | 3 | 93 | 70 | 2 | 21 | 1 | 0 | 4 |
| Total, all States and areas | 42,322 | 34,435 | 24,084 | 8,496 | 1,206 | 298 | 67 | 25 | 259 | 7,296 | 5,131 | 525 | 1,640 | 209 | 27 | 355 |
- 1 See Glossary of terms for definitions.
- 2 The States are grouped according to the method used by the Bureau of the Census, U.S. Department of Commerce.
804 of 804 figures sit in a row or column sum that works out.
Reader’s notes
p. 237. The crop ends mid-table: the last printed row is Maryland, and the South Atlantic division and all remaining divisions/states (plus any outlying-area and U.S. total lines and the footnote texts for markers 1 and 2) continue on the following page. No footnote texts are printed on this image, so `footnotes` is empty; the marker ^2 on the stub heading "Division and State" is retained. Scan/typesetting notes: - In several cells the digit-grouping comma is faint or dropped, printing as a blank space: "1 556" (New England, CA), "3 767" (New York, All cases), "4 351" and "1 702" (Middle Atlantic, CA and CB), "1 461" (Middle Atlantic, All R cases), "8 240" and "5 739" (East North Central, All C cases and CA), "1 784" (East North Central, All R cases). All are transcribed with the comma. Each is confirmed by its column sum. - East North Central, AC column: the glyph is degraded and reads like a lowercase "o"; it is a 6 (the column sum 2+2+1+1+0 = 6 confirms it). - Region lines (New England, Middle Atlantic, East North Central, West North Central) are indented subtotal rows in the stub; the indentation is not reproduced. - The third header level (UD, AC, UC) is printed only under the last three columns; the headings above it and the stub/"All cases"/C- and R-column headings are tall cells spanning the levels, so they are repeated per the instructions. - All rows were cross-checked: every state row's C-case and all-cases components sum to the printed totals, and every division subtotal equals the sum of its states in all 16 numeric columns. No printed total appears to be in error.
p. 238. 17 columns: stub, All cases, 8 unfair-labor-practice columns (All C cases, CA, CB, CC, CD, CE, CG, CP), 4 representation columns (All R cases, RC, RM, RD), UD, AC, UC. The last three columns carry a two-level heading (spelled-out name over the code letters), so the heading has three printed levels. This is a "—Continued" page: the South Atlantic division's first states (Delaware, Maryland) are printed on the preceding page, so the "South Atlantic" subtotal row is larger than the sum of the seven state rows shown here. That is not a misprint. Every other subtotal (East South Central, West South Central, Mountain) adds exactly to the state rows above it, and every state row's components add to its own All C / All R / All cases figures, which cross-checks the whole grid. Texas, "All C cases": printed as "1 031" — the digit-grouping comma did not print (or is lost in the scan) and appears as a space. Transcribed as "1,031"; the row and column totals confirm the value is 1,031. Footnote markers 1 (in the caption) and 2 (on the stub heading "Division and State") are referenced, but no footnote text is printed within this crop, so `footnotes` is empty. The scan is a 1-bit halftone with slightly broken serifs in the stub labels; all digits were legible and none are doubtful.
p. 239. Final page of a continued table; it carries full column headings, which are transcribed. Seventeen columns: stub, "All cases", eight unfair-labor-practice columns (All C cases, CA, CB, CC, CD, CE, CG, CP), four representation columns (All R cases, RC, RM, RD), and three single columns whose two-level headings are UD, AC, UC. "Pacific", "Outlying areas" and "Total, all States and areas" are indented subtotal/total lines set off by rules; they are transcribed as ordinary rows with their printed labels. The footnote marker 2 is attached to the stub heading "Division and State"; marker 1 is attached to the caption, which is omitted per instructions. All printed rows and columns cross-foot exactly (e.g. Pacific 8,033 = 1,128+602+5,867+259+167+10; grand total 42,322 = 34,435+7,296+209+27+355), so no misprints are suspected. Hawaii AC = 8 is high relative to neighbors but is confirmed by the Pacific AC subtotal of 14. The 300-ppi bitonal scan drops fine dots: i-dots and sentence/abbreviation periods are largely invisible, so the footnotes are rendered with the conventional periods ("definitions.", "U.S. Department of Commerce."), which appear as bare gaps in the image.
Source image
Source data: U.S. NLRB Annual Reports (public domain). Reconstruction by NLRB Stats Archive. Read by claude-opus-5 (effort max, prompt extract_v1) from the 300-dpi scan; stitched by page. Updated October 2026.