NLRB Stats Archive › Annual Reports › FY1985 › Proceedings Decided by Circuit Courts of Appeals on Petitions for Enforcement and/or Review of Board Orders, Fiscal Year 1985, Compared With 5-Year Cumulative Totals, Fiscal Years 1980 Through 1984
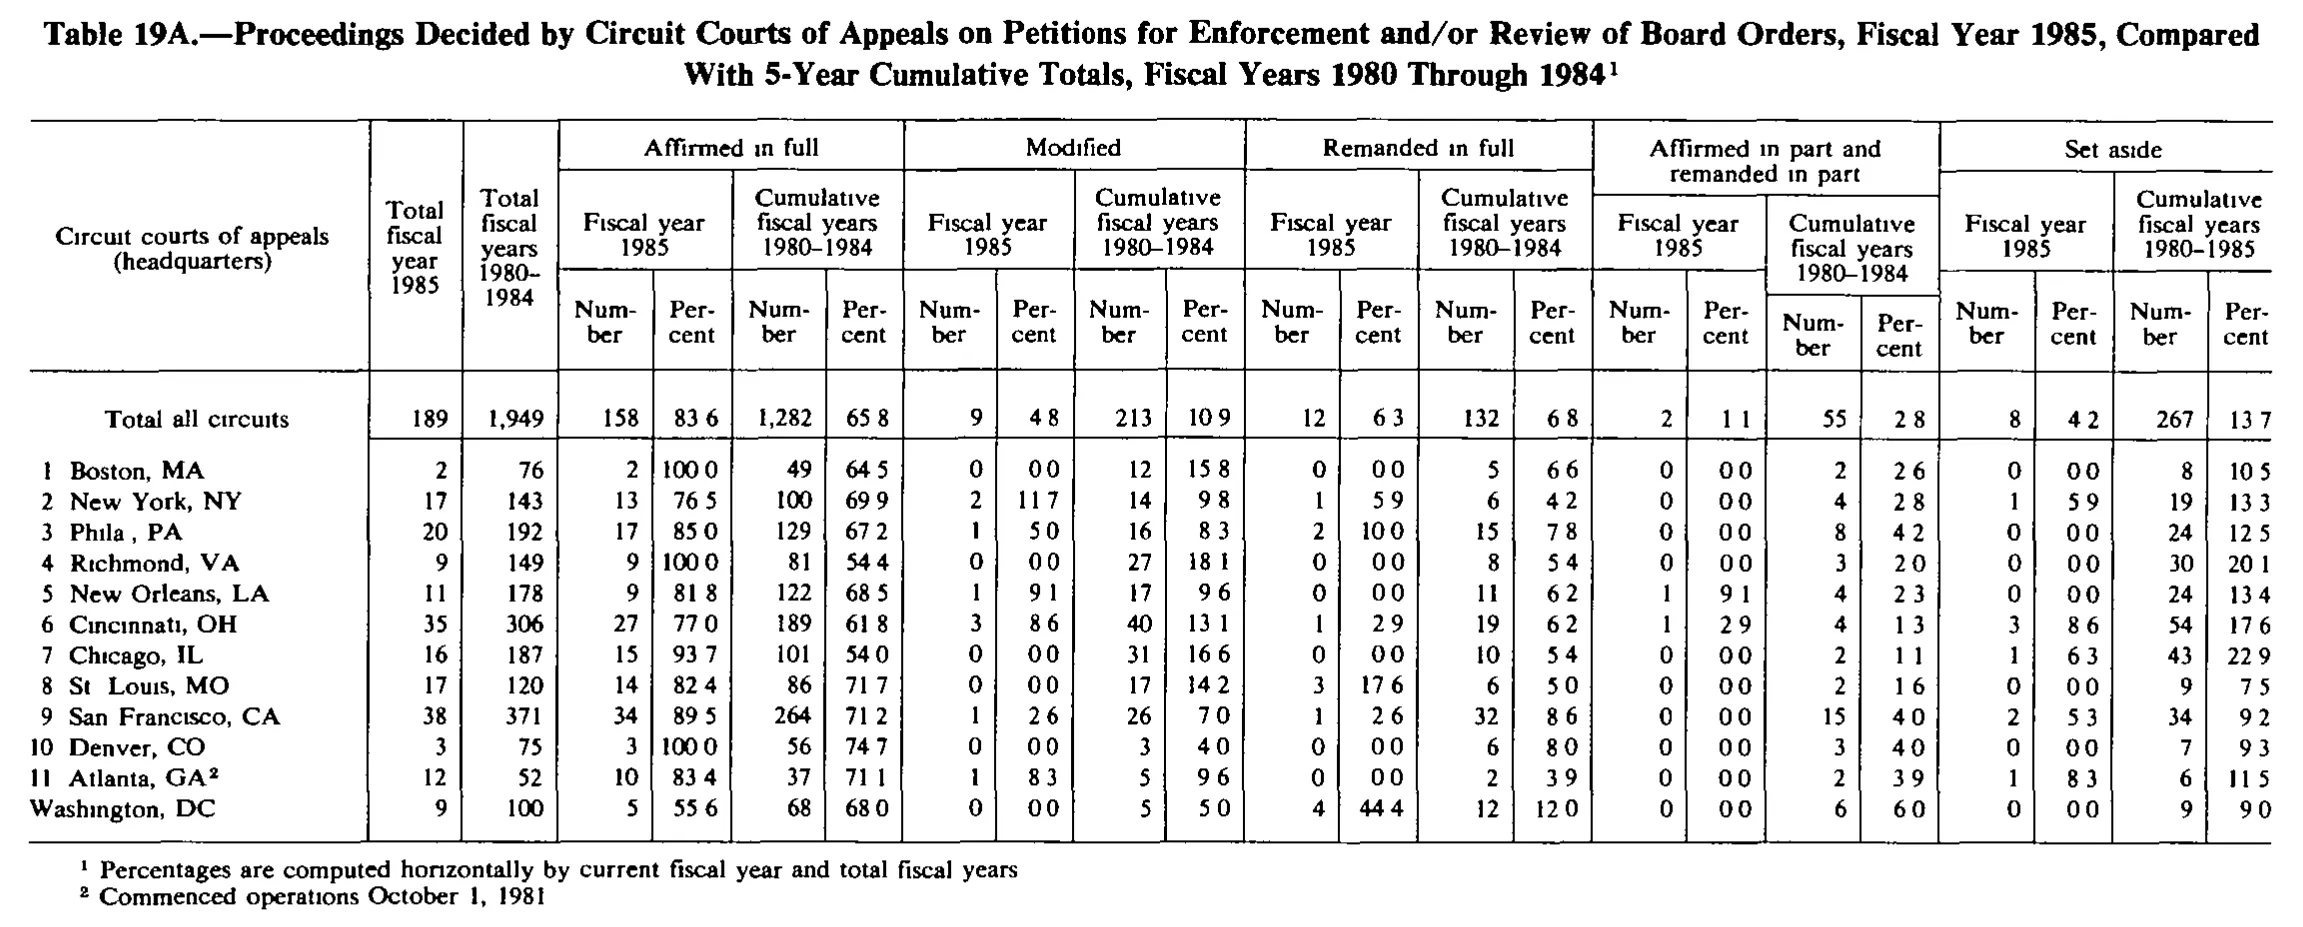
Proceedings Decided by Circuit Courts of Appeals on Petitions for Enforcement and/or Review of Board Orders, Fiscal Year 1985, Compared With 5-Year Cumulative Totals, Fiscal Years 1980 Through 1984
| Circuit courts of appeals (headquarters) | Total fiscal year 1985 | Total fiscal years 1980-1984 | Affirmed in full | Modified | Remanded in full | Affirmed in part and remanded in part | Set aside | |||||||||||||||
|---|---|---|---|---|---|---|---|---|---|---|---|---|---|---|---|---|---|---|---|---|---|---|
| Circuit courts of appeals (headquarters) | Total fiscal year 1985 | Total fiscal years 1980-1984 | Fiscal year 1985 | Cumulative fiscal years 1980-1984 | Fiscal year 1985 | Cumulative fiscal years 1980-1984 | Fiscal year 1985 | Cumulative fiscal years 1980-1984 | Fiscal year 1985 | Cumulative fiscal years 1980-1984 | Fiscal year 1985 | Cumulative fiscal years 1980-1985 | ||||||||||
| Circuit courts of appeals (headquarters) | Total fiscal year 1985 | Total fiscal years 1980-1984 | Number | Percent | Number | Percent | Number | Percent | Number | Percent | Number | Percent | Number | Percent | Number | Percent | Number | Percent | Number | Percent | Number | Percent |
| Total all circuits | 189 | 1,949 | 158 | 83.6 | 1,282 | 65.8 | 9 | 4.8 | 213 | 10.9 | 12 | 6.3 | 132 | 6.8 | 2 | 1.1 | 55 | 2.8 | 8 | 4.2 | 267 | 13.7 |
| 1 Boston, MA | 2 | 76 | 2 | 100.0 | 49 | 64.5 | 0 | 0.0 | 12 | 15.8 | 0 | 0.0 | 5 | 6.6 | 0 | 0.0 | 2 | 2.6 | 0 | 0.0 | 8 | 10.5 |
| 2 New York, NY | 17 | 143 | 13 | 76.5 | 100 | 69.9 | 2 | 11.7 | 14 | 9.8 | 1 | 5.9 | 6 | 4.2 | 0 | 0.0 | 4 | 2.8 | 1 | 5.9 | 19 | 13.3 |
| 3 Phila., PA | 20 | 192 | 17 | 85.0 | 129 | 67.2 | 1 | 5.0 | 16 | 8.3 | 2 | 10.0 | 15 | 7.8 | 0 | 0.0 | 8 | 4.2 | 0 | 0.0 | 24 | 12.5 |
| 4 Richmond, VA | 9 | 149 | 9 | 100.0 | 81 | 54.4 | 0 | 0.0 | 27 | 18.1 | 0 | 0.0 | 8 | 5.4 | 0 | 0.0 | 3 | 2.0 | 0 | 0.0 | 30 | 20.1 |
| 5 New Orleans, LA | 11 | 178 | 9 | 81.8 | 122 | 68.5 | 1 | 9.1 | 17 | 9.6 | 0 | 0.0 | 11 | 6.2 | 1 | 9.1 | 4 | 2.3 | 0 | 0.0 | 24 | 13.4 |
| 6 Cincinnati, OH | 35 | 306 | 27 | 77.0 | 189 | 61.8 | 3 | 8.6 | 40 | 13.1 | 1 | 2.9 | 19 | 6.2 | 1 | 2.9 | 4 | 1.3 | 3 | 8.6 | 54 | 17.6 |
| 7 Chicago, IL | 16 | 187 | 15 | 93.7 | 101 | 54.0 | 0 | 0.0 | 31 | 16.6 | 0 | 0.0 | 10 | 5.4 | 0 | 0.0 | 2 | 1.1 | 1 | 6.3 | 43 | 22.9 |
| 8 St. Louis, MO | 17 | 120 | 14 | 82.4 | 86 | 71.7 | 0 | 0.0 | 17 | 14.2 | 3 | 17.6 | 6 | 5.0 | 0 | 0.0 | 2 | 1.6 | 0 | 0.0 | 9 | 7.5 |
| 9 San Francisco, CA | 38 | 371 | 34 | 89.5 | 264 | 71.2 | 1 | 2.6 | 26 | 7.0 | 1 | 2.6 | 32 | 8.6 | 0 | 0.0 | 15 | 4.0 | 2 | 5.3 | 34 | 9.2 |
| 10 Denver, CO | 3 | 75 | 3 | 100.0 | 56 | 74.7 | 0 | 0.0 | 3 | 4.0 | 0 | 0.0 | 6 | 8.0 | 0 | 0.0 | 3 | 4.0 | 0 | 0.0 | 7 | 9.3 |
| 11 Atlanta, GA | 12 | 52 | 10 | 83.4 | 37 | 71.1 | 1 | 8.3 | 5 | 9.6 | 0 | 0.0 | 2 | 3.9 | 0 | 0.0 | 2 | 3.9 | 1 | 8.3 | 6 | 11.5 |
| Washington, DC | 9 | 100 | 5 | 55.6 | 68 | 68.0 | 0 | 0.0 | 5 | 5.0 | 4 | 44.4 | 12 | 12.0 | 0 | 0.0 | 6 | 6.0 | 0 | 0.0 | 9 | 9.0 |
- 1 Percentages are computed horizontally by current fiscal year and total fiscal years
- 2 Commenced operations October 1, 1981
127 of 127 figures sit in a row or column sum that works out.
Reader’s notes
p. 211. 23 columns: stub, two "Total" columns, then five outcome groups of four columns each (Number/Percent for fiscal year 1985 and for the cumulative years). Decimal points: the scan drops most periods, so every percent prints as e.g. "83 6", "100 0", "0 0". These are decimal fractions (158/189 = 83.6 percent, etc.), and I have written them with decimal points: "83.6", "100.0", "0.0". The same loss of periods affects the abbreviations "Phila , PA" and "St Louis, MO", which I have written "Phila., PA" and "St. Louis, MO". Suspected misprint in a heading: the last group ("Set aside") has its cumulative column headed "Cumulative fiscal years 1980-1985", while the other four groups and the table's total column read "1980-1984". The Set aside cumulative figures (267) sum into the 1,949 total for 1980-1984, so "1985" appears to be a typesetting error; transcribed as printed. Doubtful cell: row "11 Atlanta, GA^2", column Affirmed in full / Fiscal year 1985 / Percent, reads "83 4" in the scan, transcribed "83.4"; 10/12 = 83.3 percent, so either the print is in error or the final glyph is a 3 degraded to look like a 4. Two other Atlanta percents ("3.9" for 2/52 = 3.85) are likewise a tenth above the value a straight rounding would give. Arithmetic cross-checks all pass: the twelve circuit rows sum to the printed "Total all circuits" line in both Total columns (189 and 1,949) and in every outcome Number column (1,282 / 213 / 132 / 55 / 267), and each row's five outcome Numbers sum to that row's Total for both periods. Footnote marker 1 is attached to the caption (excluded per instructions) and defines the percentage basis.
Source image
Source data: U.S. NLRB Annual Reports (public domain). Reconstruction by NLRB Stats Archive. Read by claude-opus-5 (effort max, prompt extract_v1) from the 300-dpi scan; stitched by page. Updated October 2026.