NLRB Stats Archive › Annual Reports › FY1985 › Size of Units in Representation Elections in Cases Closed, Fiscal Year 1985
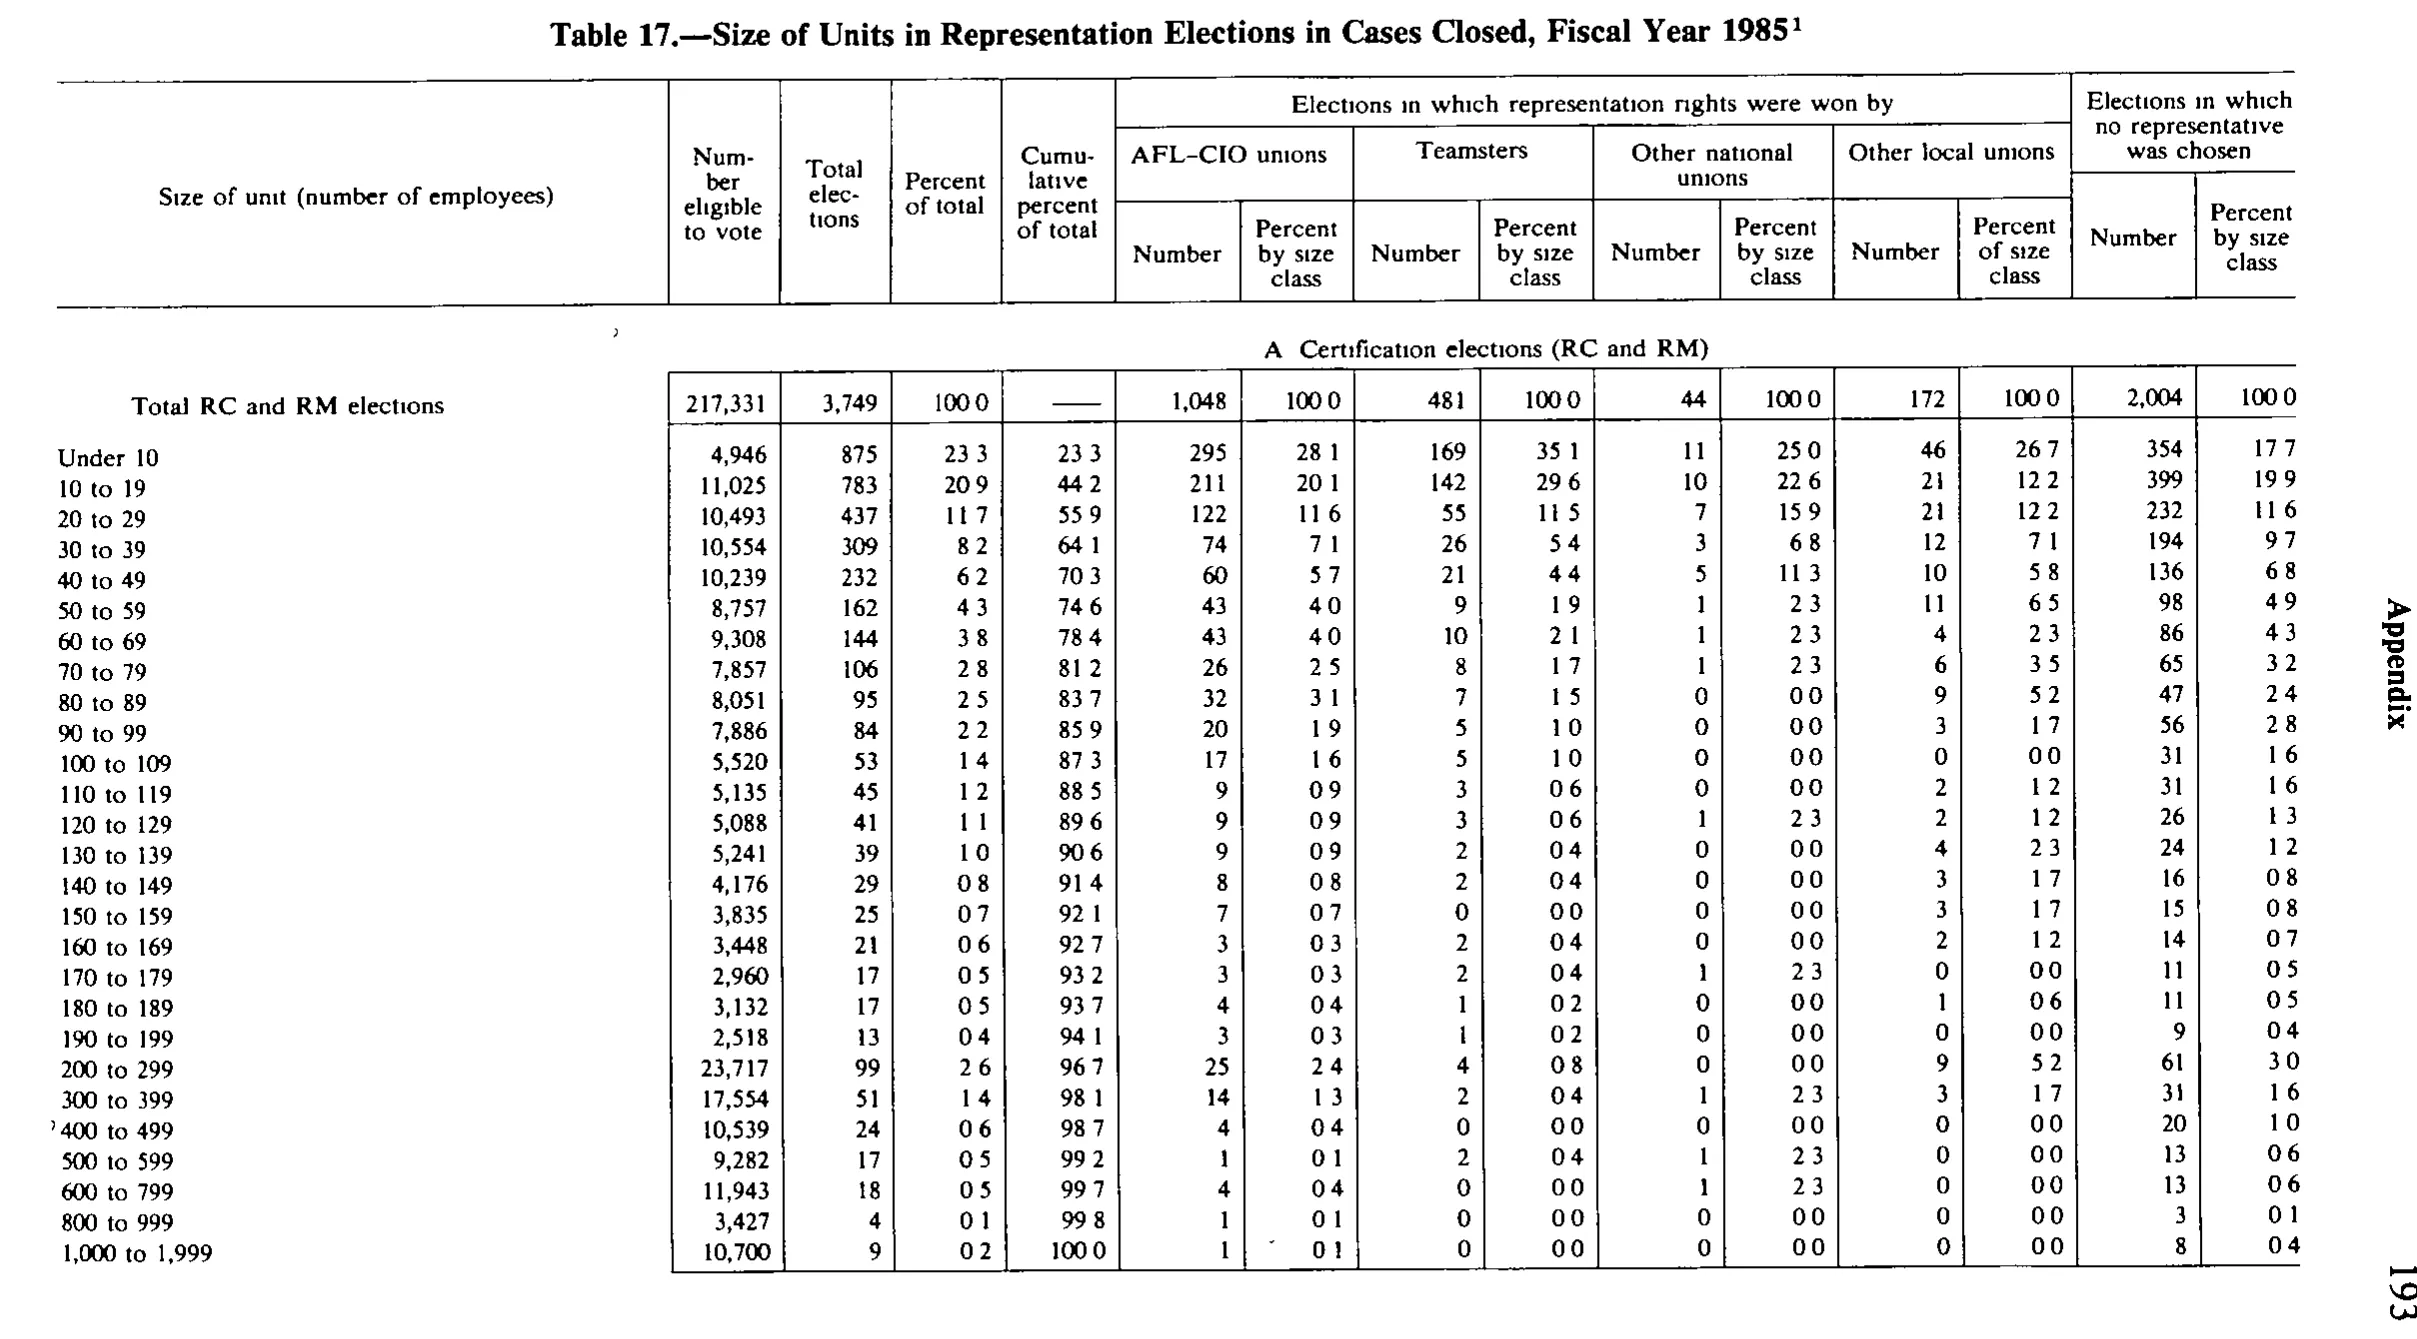
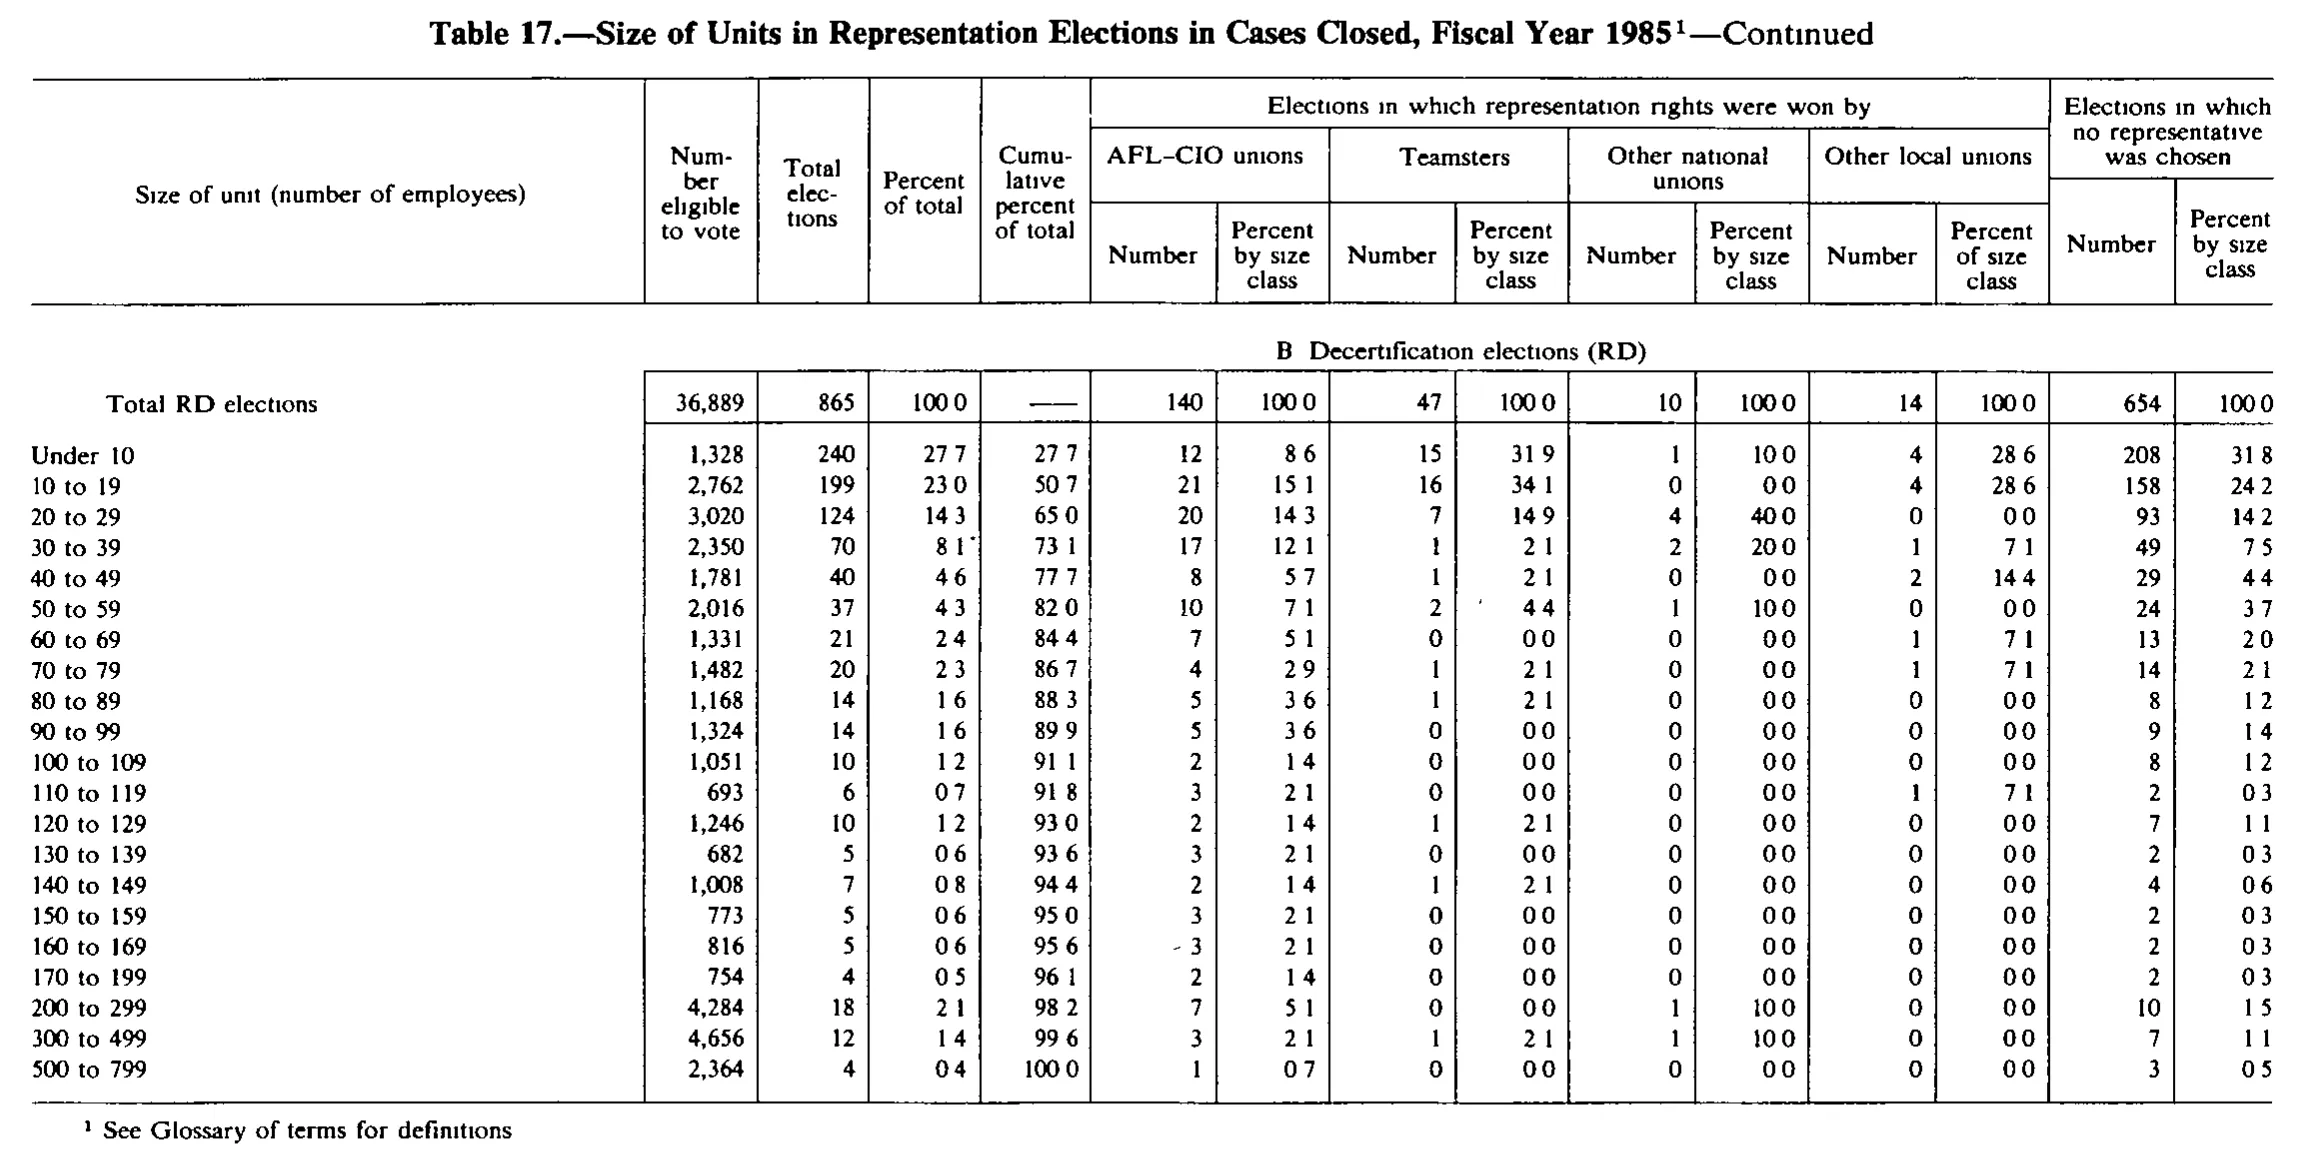
Size of Units in Representation Elections in Cases Closed, Fiscal Year 1985
Stitched from pp. 206–207.
| Size of unit (number of employees) | Number eligible to vote | Total elections | Percent of total | Cumulative percent of total | Elections in which representation rights were won by | Elections in which no representative was chosen | ||||||||
|---|---|---|---|---|---|---|---|---|---|---|---|---|---|---|
| Size of unit (number of employees) | Number eligible to vote | Total elections | Percent of total | Cumulative percent of total | AFL-CIO unions | Teamsters | Other national unions | Other local unions | Elections in which no representative was chosen | |||||
| Size of unit (number of employees) | Number eligible to vote | Total elections | Percent of total | Cumulative percent of total | Number | Percent by size class | Number | Percent by size class | Number | Percent by size class | Number | Percent of size class | Number | Percent by size class |
| A. Certification elections (RC and RM) | ||||||||||||||
| Total RC and RM elections | 217,331 | 3,749 | 100.0 | 1,048 | 100.0 | 481 | 100.0 | 44 | 100.0 | 172 | 100.0 | 2,004 | 100.0 | |
| Under 10 | 4,946 | 875 | 23.3 | 23.3 | 295 | 28.1 | 169 | 35.1 | 11 | 25.0 | 46 | 26.7 | 354 | 17.7 |
| 10 to 19 | 11,025 | 783 | 20.9 | 44.2 | 211 | 20.1 | 142 | 29.6 | 10 | 22.6 | 21 | 12.2 | 399 | 19.9 |
| 20 to 29 | 10,493 | 437 | 11.7 | 55.9 | 122 | 11.6 | 55 | 11.5 | 7 | 15.9 | 21 | 12.2 | 232 | 11.6 |
| 30 to 39 | 10,554 | 309 | 8.2 | 64.1 | 74 | 7.1 | 26 | 5.4 | 3 | 6.8 | 12 | 7.1 | 194 | 9.7 |
| 40 to 49 | 10,239 | 232 | 6.2 | 70.3 | 60 | 5.7 | 21 | 4.4 | 5 | 11.3 | 10 | 5.8 | 136 | 6.8 |
| 50 to 59 | 8,757 | 162 | 4.3 | 74.6 | 43 | 4.0 | 9 | 1.9 | 1 | 2.3 | 11 | 6.5 | 98 | 4.9 |
| 60 to 69 | 9,308 | 144 | 3.8 | 78.4 | 43 | 4.0 | 10 | 2.1 | 1 | 2.3 | 4 | 2.3 | 86 | 4.3 |
| 70 to 79 | 7,857 | 106 | 2.8 | 81.2 | 26 | 2.5 | 8 | 1.7 | 1 | 2.3 | 6 | 3.5 | 65 | 3.2 |
| 80 to 89 | 8,051 | 95 | 2.5 | 83.7 | 32 | 3.1 | 7 | 1.5 | 0 | 0.0 | 9 | 5.2 | 47 | 2.4 |
| 90 to 99 | 7,886 | 84 | 2.2 | 85.9 | 20 | 1.9 | 5 | 1.0 | 0 | 0.0 | 3 | 1.7 | 56 | 2.8 |
| 100 to 109 | 5,520 | 53 | 1.4 | 87.3 | 17 | 1.6 | 5 | 1.0 | 0 | 0.0 | 0 | 0.0 | 31 | 1.6 |
| 110 to 119 | 5,135 | 45 | 1.2 | 88.5 | 9 | 0.9 | 3 | 0.6 | 0 | 0.0 | 2 | 1.2 | 31 | 1.6 |
| 120 to 129 | 5,088 | 41 | 1.1 | 89.6 | 9 | 0.9 | 3 | 0.6 | 1 | 2.3 | 2 | 1.2 | 26 | 1.3 |
| 130 to 139 | 5,241 | 39 | 1.0 | 90.6 | 9 | 0.9 | 2 | 0.4 | 0 | 0.0 | 4 | 2.3 | 24 | 1.2 |
| 140 to 149 | 4,176 | 29 | 0.8 | 91.4 | 8 | 0.8 | 2 | 0.4 | 0 | 0.0 | 3 | 1.7 | 16 | 0.8 |
| 150 to 159 | 3,835 | 25 | 0.7 | 92.1 | 7 | 0.7 | 0 | 0.0 | 0 | 0.0 | 3 | 1.7 | 15 | 0.8 |
| 160 to 169 | 3,448 | 21 | 0.6 | 92.7 | 3 | 0.3 | 2 | 0.4 | 0 | 0.0 | 2 | 1.2 | 14 | 0.7 |
| 170 to 179 | 2,960 | 17 | 0.5 | 93.2 | 3 | 0.3 | 2 | 0.4 | 1 | 2.3 | 0 | 0.0 | 11 | 0.5 |
| 180 to 189 | 3,132 | 17 | 0.5 | 93.7 | 4 | 0.4 | 1 | 0.2 | 0 | 0.0 | 1 | 0.6 | 11 | 0.5 |
| 190 to 199 | 2,518 | 13 | 0.4 | 94.1 | 3 | 0.3 | 1 | 0.2 | 0 | 0.0 | 0 | 0.0 | 9 | 0.4 |
| 200 to 299 | 23,717 | 99 | 2.6 | 96.7 | 25 | 2.4 | 4 | 0.8 | 0 | 0.0 | 9 | 5.2 | 61 | 3.0 |
| 300 to 399 | 17,554 | 51 | 1.4 | 98.1 | 14 | 1.3 | 2 | 0.4 | 1 | 2.3 | 3 | 1.7 | 31 | 1.6 |
| 400 to 499 | 10,539 | 24 | 0.6 | 98.7 | 4 | 0.4 | 0 | 0.0 | 0 | 0.0 | 0 | 0.0 | 20 | 1.0 |
| 500 to 599 | 9,282 | 17 | 0.5 | 99.2 | 1 | 0.1 | 2 | 0.4 | 1 | 2.3 | 0 | 0.0 | 13 | 0.6 |
| 600 to 799 | 11,943 | 18 | 0.5 | 99.7 | 4 | 0.4 | 0 | 0.0 | 1 | 2.3 | 0 | 0.0 | 13 | 0.6 |
| 800 to 999 | 3,427 | 4 | 0.1 | 99.8 | 1 | 0.1 | 0 | 0.0 | 0 | 0.0 | 0 | 0.0 | 3 | 0.1 |
| 1,000 to 1,999 | 10,700 | 9 | 0.2 | 100.0 | 1 | 0.1 | 0 | 0.0 | 0 | 0.0 | 0 | 0.0 | 8 | 0.4 |
| B. Decertification elections (RD) | ||||||||||||||
| Total RD elections | 36,889 | 865 | 100.0 | 140 | 100.0 | 47 | 100.0 | 10 | 100.0 | 14 | 100.0 | 654 | 100.0 | |
| Under 10 | 1,328 | 240 | 27.7 | 27.7 | 12 | 8.6 | 15 | 31.9 | 1 | 10.0 | 4 | 28.6 | 208 | 31.8 |
| 10 to 19 | 2,762 | 199 | 23.0 | 50.7 | 21 | 15.1 | 16 | 34.1 | 0 | 0.0 | 4 | 28.6 | 158 | 24.2 |
| 20 to 29 | 3,020 | 124 | 14.3 | 65.0 | 20 | 14.3 | 7 | 14.9 | 4 | 40.0 | 0 | 0.0 | 93 | 14.2 |
| 30 to 39 | 2,350 | 70 | 8.1 | 73.1 | 17 | 12.1 | 1 | 2.1 | 2 | 20.0 | 1 | 7.1 | 49 | 7.5 |
| 40 to 49 | 1,781 | 40 | 4.6 | 77.7 | 8 | 5.7 | 1 | 2.1 | 0 | 0.0 | 2 | 14.4 | 29 | 4.4 |
| 50 to 59 | 2,016 | 37 | 4.3 | 82.0 | 10 | 7.1 | 2 | 4.4 | 1 | 10.0 | 0 | 0.0 | 24 | 3.7 |
| 60 to 69 | 1,331 | 21 | 2.4 | 84.4 | 7 | 5.1 | 0 | 0.0 | 0 | 0.0 | 1 | 7.1 | 13 | 2.0 |
| 70 to 79 | 1,482 | 20 | 2.3 | 86.7 | 4 | 2.9 | 1 | 2.1 | 0 | 0.0 | 1 | 7.1 | 14 | 2.1 |
| 80 to 89 | 1,168 | 14 | 1.6 | 88.3 | 5 | 3.6 | 1 | 2.1 | 0 | 0.0 | 0 | 0.0 | 8 | 1.2 |
| 90 to 99 | 1,324 | 14 | 1.6 | 89.9 | 5 | 3.6 | 0 | 0.0 | 0 | 0.0 | 0 | 0.0 | 9 | 1.4 |
| 100 to 109 | 1,051 | 10 | 1.2 | 91.1 | 2 | 1.4 | 0 | 0.0 | 0 | 0.0 | 0 | 0.0 | 8 | 1.2 |
| 110 to 119 | 693 | 6 | 0.7 | 91.8 | 3 | 2.1 | 0 | 0.0 | 0 | 0.0 | 1 | 7.1 | 2 | 0.3 |
| 120 to 129 | 1,246 | 10 | 1.2 | 93.0 | 2 | 1.4 | 1 | 2.1 | 0 | 0.0 | 0 | 0.0 | 7 | 1.1 |
| 130 to 139 | 682 | 5 | 0.6 | 93.6 | 3 | 2.1 | 0 | 0.0 | 0 | 0.0 | 0 | 0.0 | 2 | 0.3 |
| 140 to 149 | 1,008 | 7 | 0.8 | 94.4 | 2 | 1.4 | 1 | 2.1 | 0 | 0.0 | 0 | 0.0 | 4 | 0.6 |
| 150 to 159 | 773 | 5 | 0.6 | 95.0 | 3 | 2.1 | 0 | 0.0 | 0 | 0.0 | 0 | 0.0 | 2 | 0.3 |
| 160 to 169 | 816 | 5 | 0.6 | 95.6 | 3 | 2.1 | 0 | 0.0 | 0 | 0.0 | 0 | 0.0 | 2 | 0.3 |
| 170 to 199 | 754 | 4 | 0.5 | 96.1 | 2 | 1.4 | 0 | 0.0 | 0 | 0.0 | 0 | 0.0 | 2 | 0.3 |
| 200 to 299 | 4,284 | 18 | 2.1 | 98.2 | 7 | 5.1 | 0 | 0.0 | 1 | 10.0 | 0 | 0.0 | 10 | 1.5 |
| 300 to 499 | 4,656 | 12 | 1.4 | 99.6 | 3 | 2.1 | 1 | 2.1 | 1 | 10.0 | 0 | 0.0 | 7 | 1.1 |
| 500 to 799 | 2,364 | 4 | 0.4 | 100.0 | 1 | 0.7 | 0 | 0.0 | 0 | 0.0 | 0 | 0.0 | 3 | 0.5 |
- 1 See Glossary of terms for definitions.
284 of 284 figures sit in a row or column sum that works out.
Reader’s notes
p. 206. 15 columns. DECIMAL POINTS: this scan systematically drops the decimal point in the percent columns, so every percentage prints as e.g. "100 0", "23 3", "28 1". These are plainly one-decimal percentages (the cumulative column runs 23.3, 44.2, ... 100.0), so they are transcribed with a period. No other character is inferred. SECTION LINE: the panel heading reads "A Certification elections (RC and RM)" with the period after "A" lost to the same scan defect; transcribed as "A. Certification elections (RC and RM)". It is centred across the full table width and carries no values. CROP / CONTINUATION: the crop shows only panel A. A panel B (decertification elections) and the footnote keyed to the superscript 1 in the caption are not on this image, so `footnotes` is empty. Panel A is nevertheless complete: the "Total elections" column sums exactly to the printed 3,749 with the 27 size classes shown, so no size-class row is cut off at the bottom. "Total RC and RM elections", cumulative-percent column: the cell holds a dash rule ("——"), transcribed as "". HEADING WORDING: the sub-heading over "Other local unions" reads "Percent of size class", not "Percent by size class" as in the other four pairs. Transcribed as printed; likely a typesetting slip in the source. ARITHMETIC VERIFICATION (numbers not altered, only checked): every integer column sums exactly to its printed total — eligible to vote 217,331; total elections 3,749; AFL-CIO 1,048; Teamsters 481; other national 44; other local 172; no representative 2,004. In all 27 data rows the five outcome counts sum exactly to that row's "Total elections". This independently confirms the integer cells and their column placement. DOUBTFUL PERCENT CELLS: a few percent-by-size-class cells differ by 0.1 from a recomputation off the verified counts. Read twice and transcribed as printed, but flagged: AFL-CIO percent for "50 to 59" and "60 to 69" both print 4.0 where 43/1,048 = 4.10; Teamsters percent for "10 to 19" prints 29.6 (142/481 = 29.52) and for "20 to 29" prints 11.5 (55/481 = 11.43); other-national percent for "10 to 19" prints 22.6 (10/44 = 22.73) and for "40 to 49" prints 11.3 (5/44 = 11.36); other-local percent for "30 to 39" prints 7.1 (12/172 = 6.98) and for "50 to 59" prints 6.5 (11/172 = 6.40). The remaining ~20 cells in the no-representative column that sit 0.1 high (e.g. 2.4 for 47/2,004, 1.6 for 31/2,004) are consistent with the source rounding twice, so those are not in doubt. The glyphs in all listed cells were legible on both passes; the discrepancies look like source rounding/misprints rather than misreads. SCAN ARTEFACTS, not transcribed: a small comma-like speck sits in the blank band above the "A. Certification elections" line, and a small apostrophe-like speck sits in the left margin immediately before the row label "400 to 499". Neither is attached to text as a footnote marker; both are treated as dirt. The running head "Appendix" (rotated, right edge) and page number 193 are omitted as instructed.
p. 207. Scan/period rendering: in this image the small dots (decimal points and sentence periods) are largely lost, so percentages appear as e.g. "27 7", "100 0". They are printed decimals on the page and are transcribed as 27.7, 100.0, etc.; likewise the section label prints as "B Decertification elections (RD)" and is given as "B. Decertification elections (RD)". This is the "Continued" half of Table 17 (panel B, decertification elections); panel A and the table's column-heading page context are on the preceding page, but the headings are reprinted here and are transcribed. Cell-level remarks: (1) "Total RD elections", column "Cumulative percent of total" holds a dash rule and is given as "". (2) "160 to 169", AFL-CIO unions / Number: a stray hyphen-like mark precedes the digit ("- 3"); read as 3. (3) "30 to 39", Percent of total: a small stray tick follows the value; read as 8.1. (4) "50 to 59", Teamsters / Percent by size class: a stray mark precedes the value; read as 4.4. (5) Heading for the 13th column reads "Percent of size class" (Other local unions), unlike the "Percent by size class" used in the other union groups; kept as printed. Arithmetic check: all Number columns and "Number eligible to vote" sum exactly to the printed "Total RD elections" figures (36,889; 865; 140; 47; 10; 14; 654), and the cumulative percent column is consistent. A few "percent by size class" entries do not reproduce exactly from the printed counts (e.g. 21/140 printed as 15.1 rather than 15.0; 16/47 as 34.1; 7/140 and 7/14 group values likewise round one tenth high, and 2/14 is printed 14.4). These are transcribed as printed, not corrected.
Source image
Source data: U.S. NLRB Annual Reports (public domain). Reconstruction by NLRB Stats Archive. Read by claude-opus-5 (effort max, prompt extract_v1) from the 300-dpi scan; stitched by page. Updated October 2026.