NLRB Stats Archive › Annual Reports › FY1985 › Geographic Distribution of Collective-Bargaining Elections Held in Cases Closed, Fiscal Year 1985
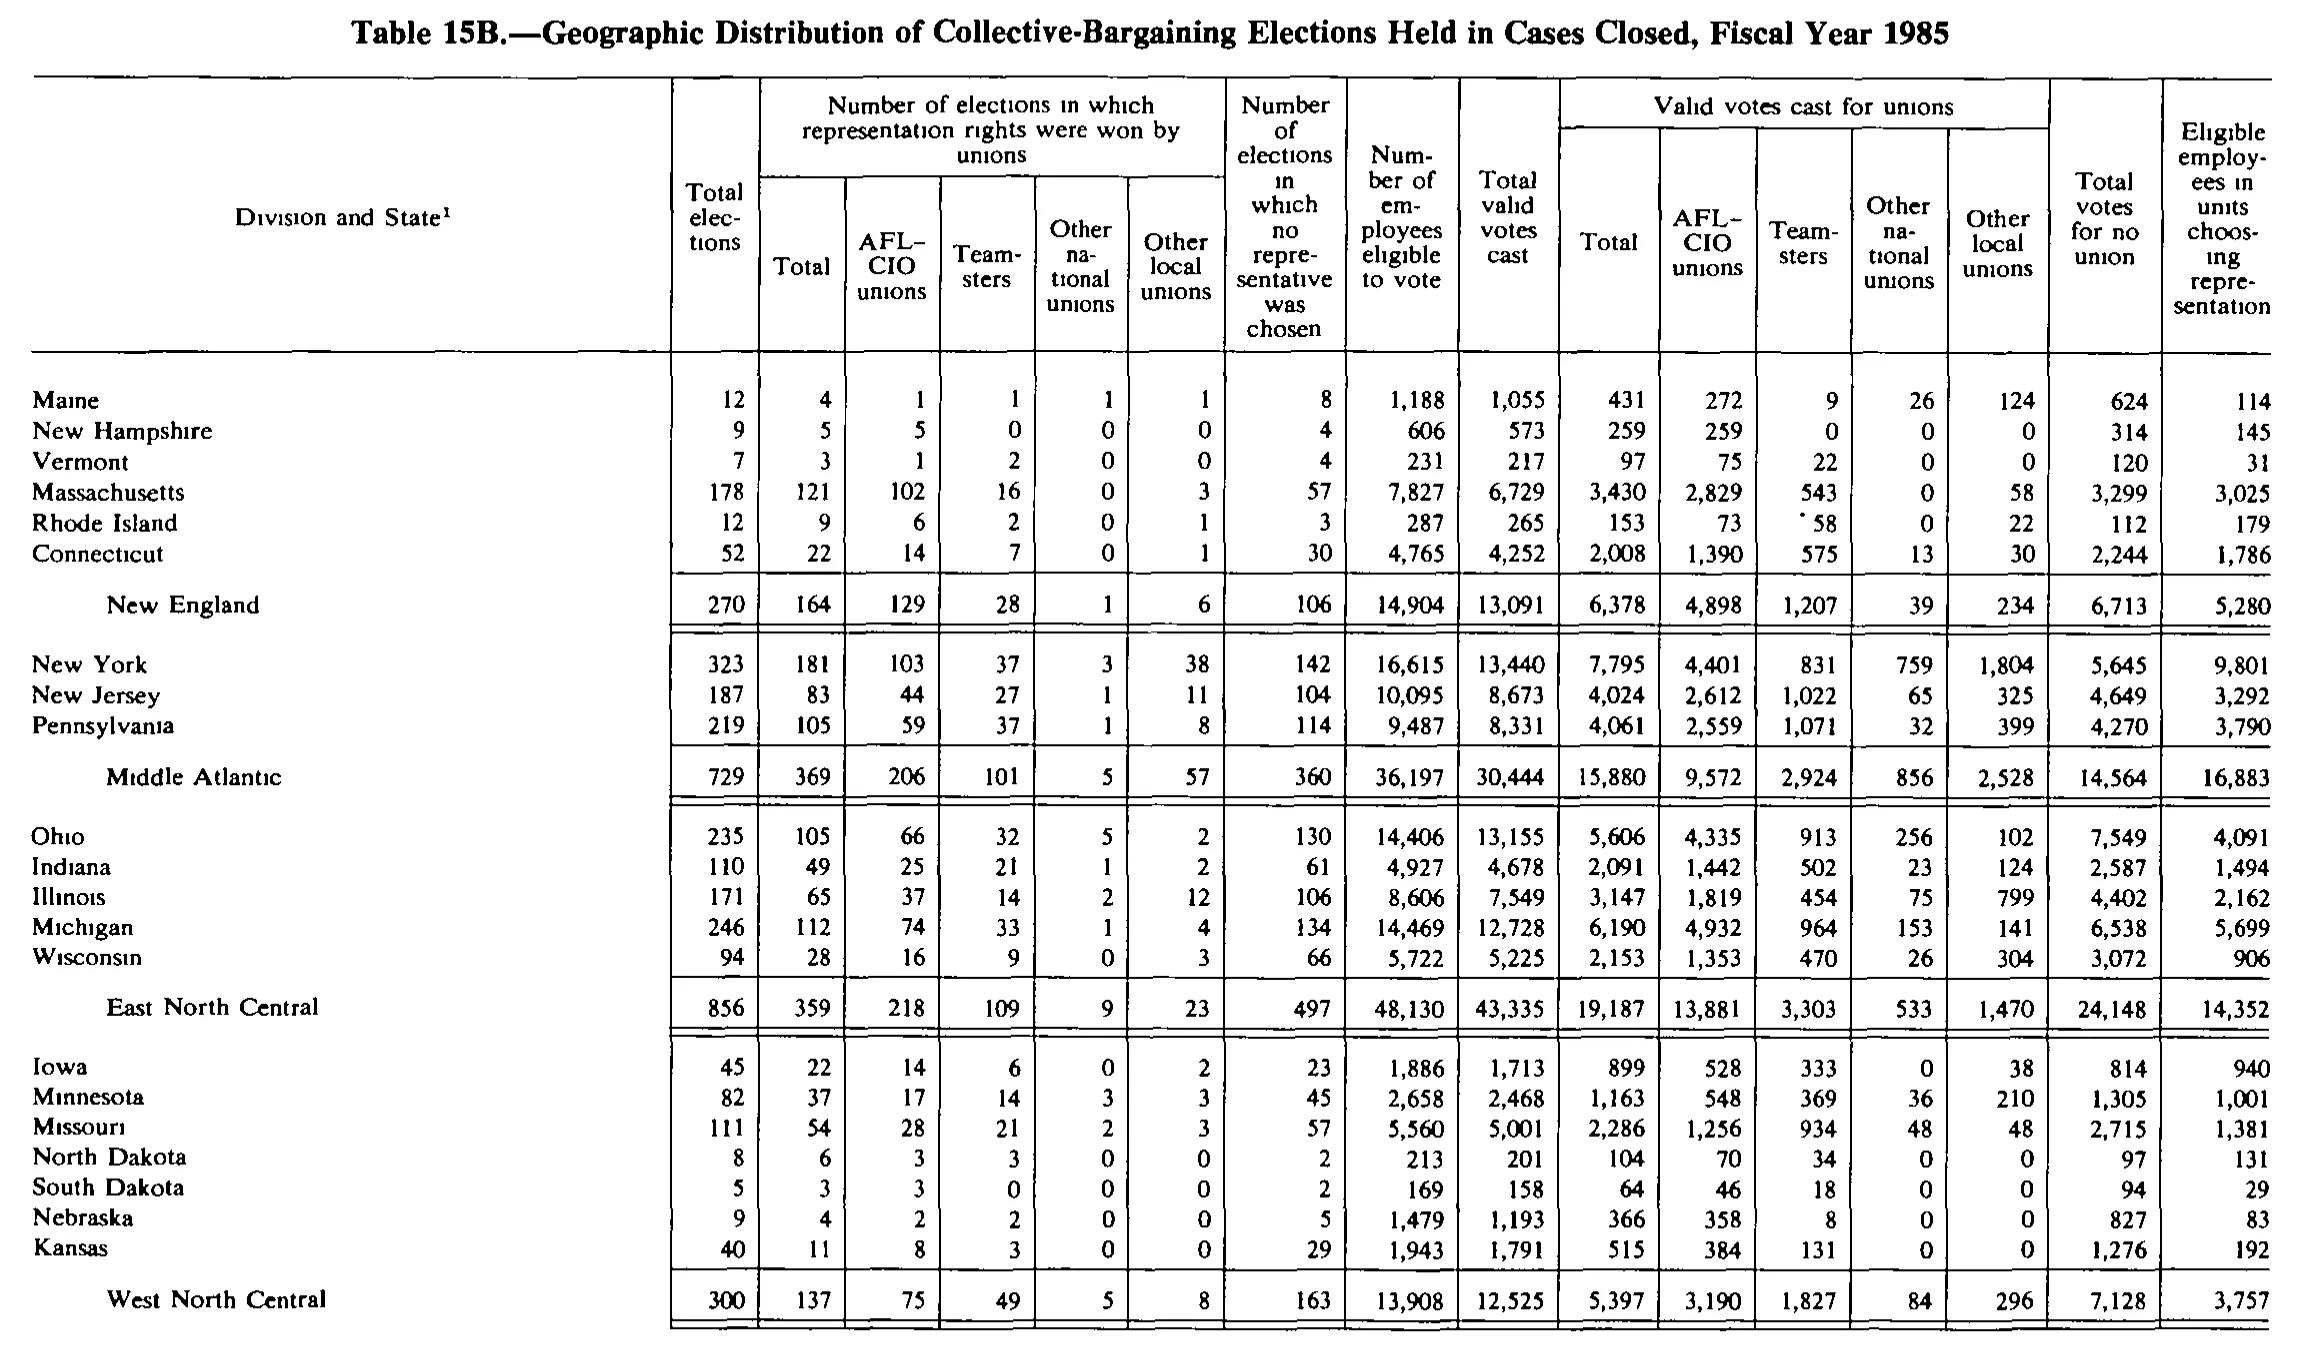
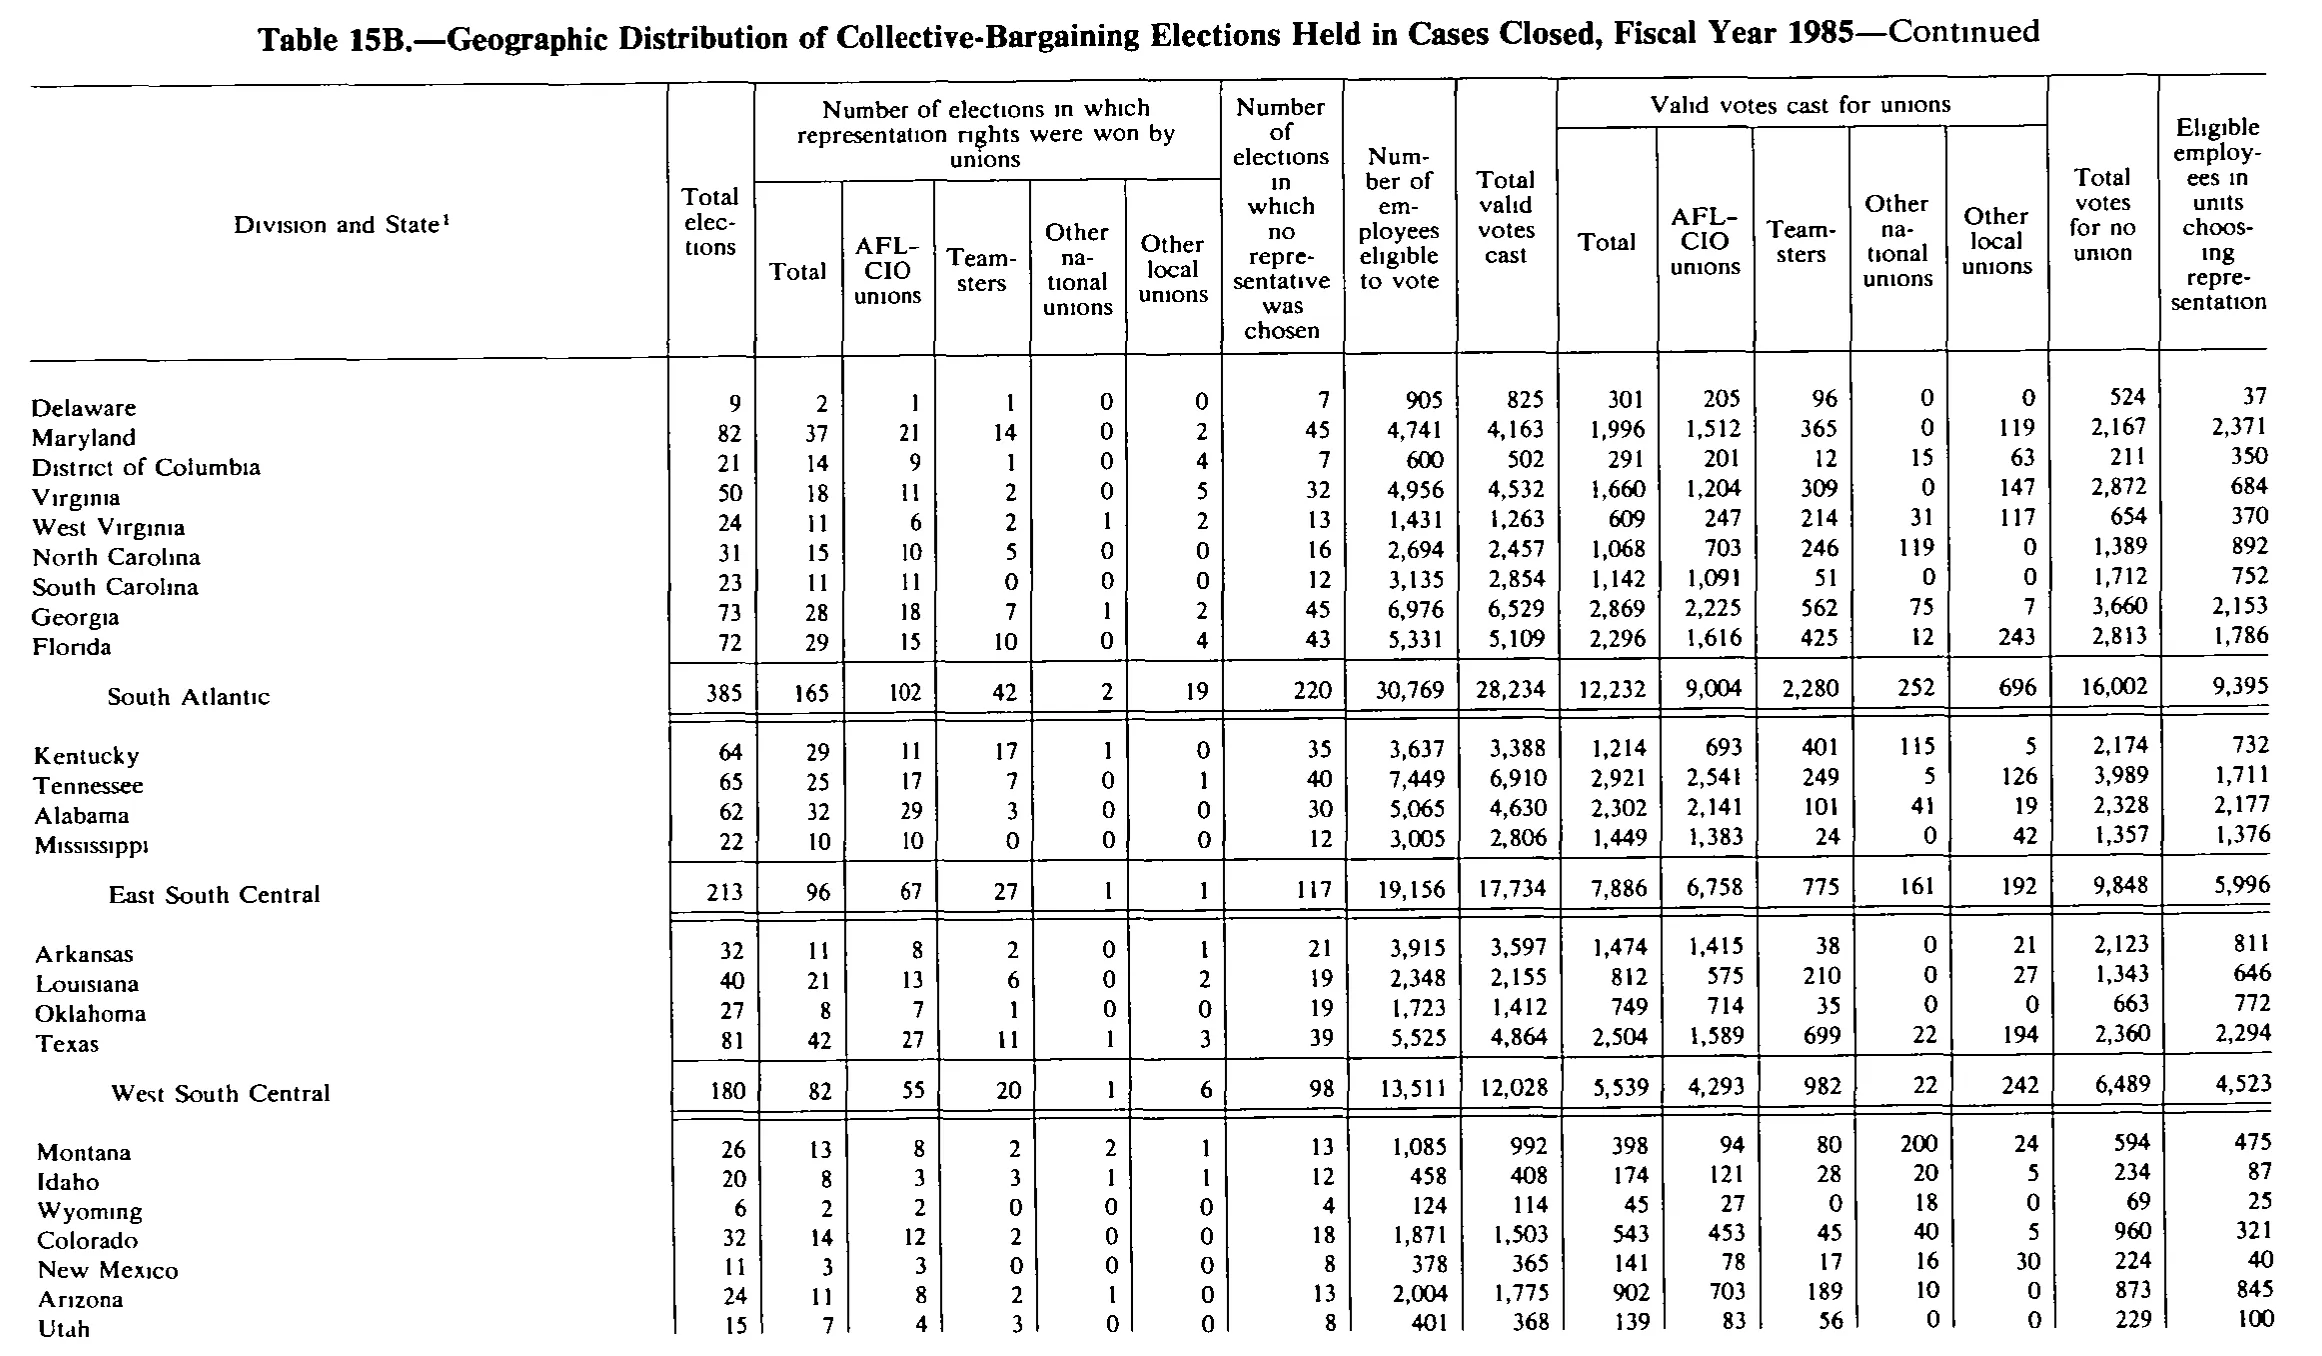
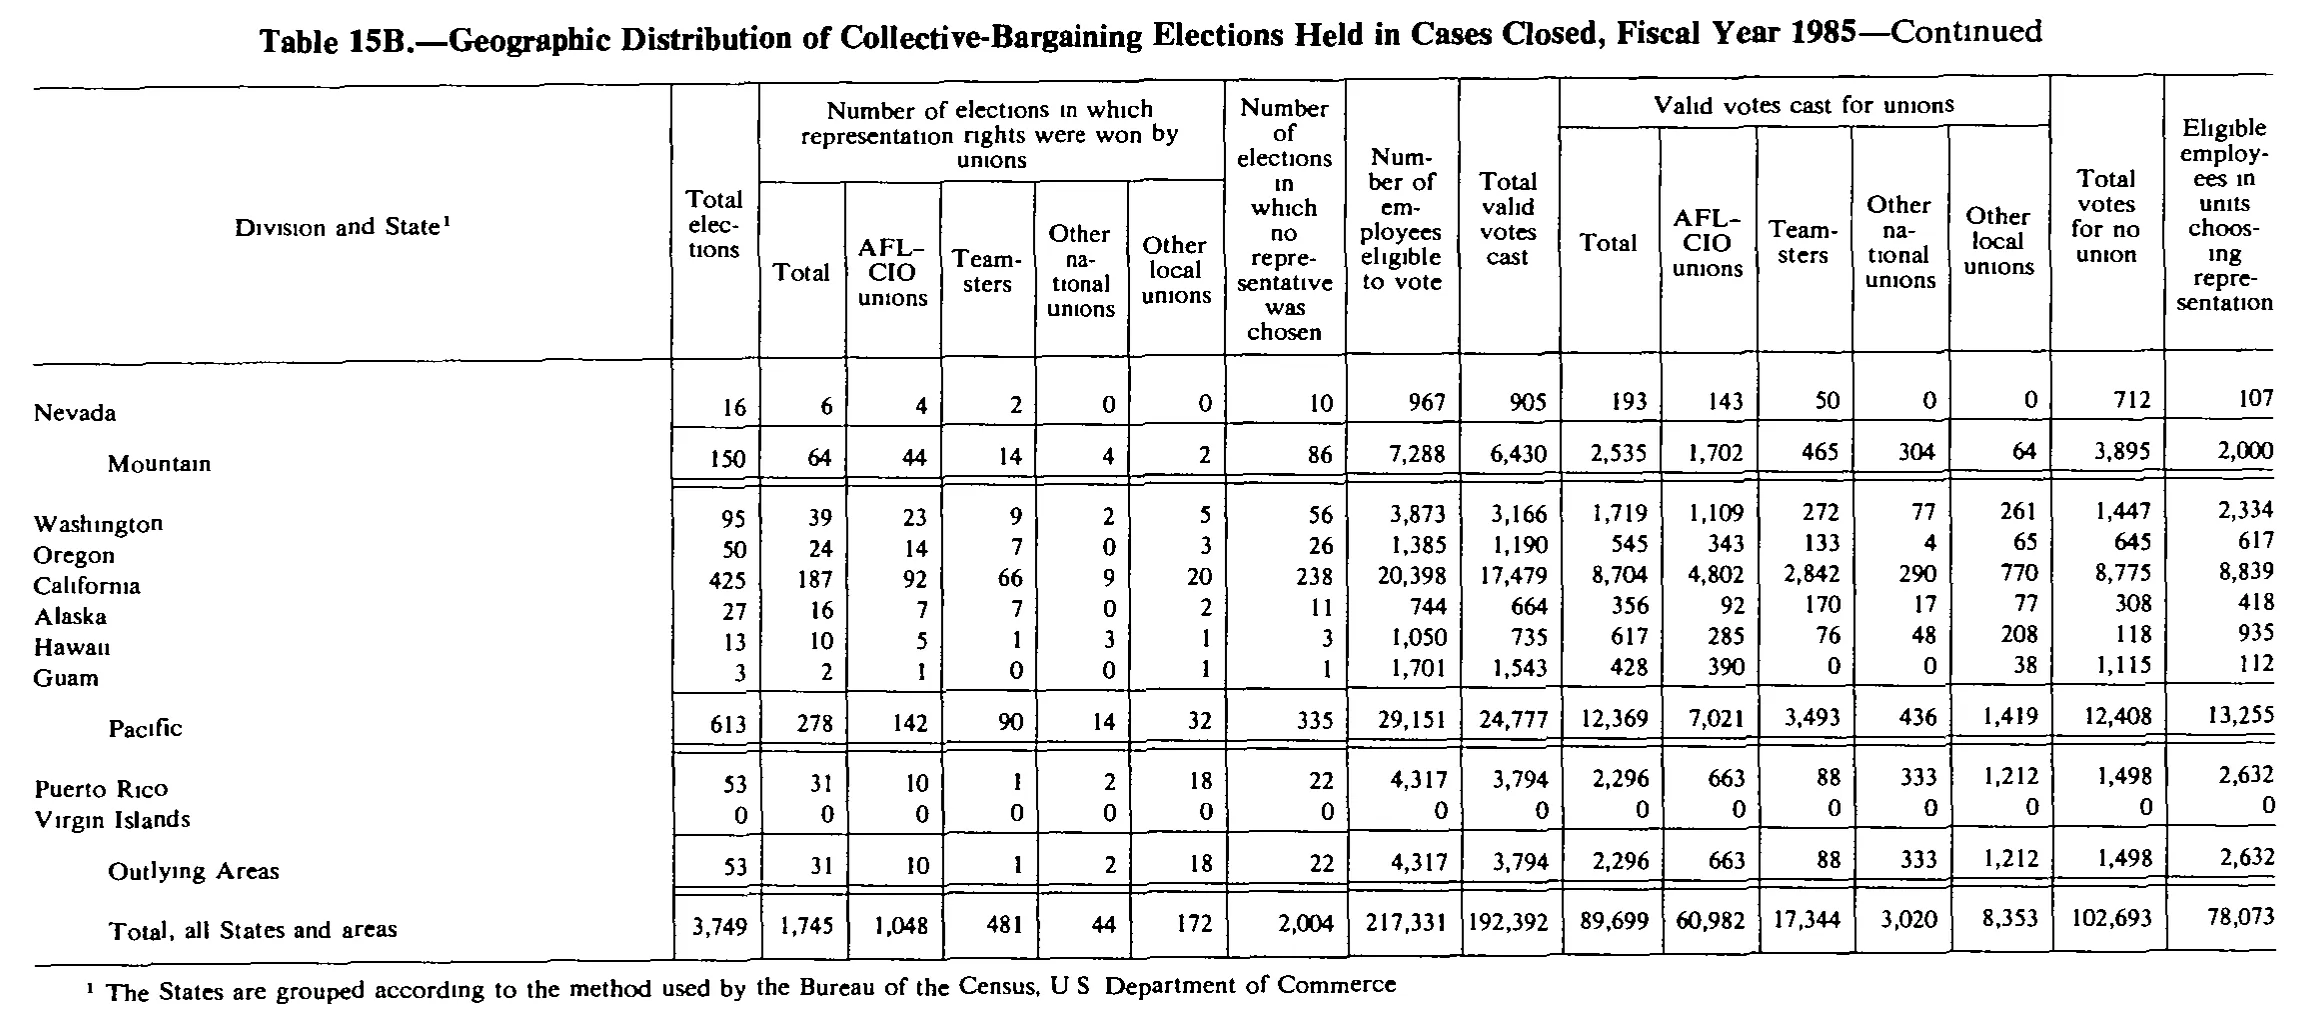
Geographic Distribution of Collective-Bargaining Elections Held in Cases Closed, Fiscal Year 1985
Stitched from pp. 197–199.
| Division and State | Total elections | Number of elections in which representation rights were won by unions | Number of elections in which no representative was chosen | Number of employees eligible to vote | Total valid votes cast | Valid votes cast for unions | Total votes for no union | Eligible employees in units choosing representation | ||||||||
|---|---|---|---|---|---|---|---|---|---|---|---|---|---|---|---|---|
| Division and State | Total elections | Total | AFL-CIO unions | Teamsters | Other national unions | Other local unions | Number of elections in which no representative was chosen | Number of employees eligible to vote | Total valid votes cast | Total | AFL-CIO unions | Teamsters | Other national unions | Other local unions | Total votes for no union | Eligible employees in units choosing representation |
| Maine | 12 | 4 | 1 | 1 | 1 | 1 | 8 | 1,188 | 1,055 | 431 | 272 | 9 | 26 | 124 | 624 | 114 |
| New Hampshire | 9 | 5 | 5 | 0 | 0 | 0 | 4 | 606 | 573 | 259 | 259 | 0 | 0 | 0 | 314 | 145 |
| Vermont | 7 | 3 | 1 | 2 | 0 | 0 | 4 | 231 | 217 | 97 | 75 | 22 | 0 | 0 | 120 | 31 |
| Massachusetts | 178 | 121 | 102 | 16 | 0 | 3 | 57 | 7,827 | 6,729 | 3,430 | 2,829 | 543 | 0 | 58 | 3,299 | 3,025 |
| Rhode Island | 12 | 9 | 6 | 2 | 0 | 1 | 3 | 287 | 265 | 153 | 73 | 58 | 0 | 22 | 112 | 179 |
| Connecticut | 52 | 22 | 14 | 7 | 0 | 1 | 30 | 4,765 | 4,252 | 2,008 | 1,390 | 575 | 13 | 30 | 2,244 | 1,786 |
| New England | 270 | 164 | 129 | 28 | 1 | 6 | 106 | 14,904 | 13,091 | 6,378 | 4,898 | 1,207 | 39 | 234 | 6,713 | 5,280 |
| New York | 323 | 181 | 103 | 37 | 3 | 38 | 142 | 16,615 | 13,440 | 7,795 | 4,401 | 831 | 759 | 1,804 | 5,645 | 9,801 |
| New Jersey | 187 | 83 | 44 | 27 | 1 | 11 | 104 | 10,095 | 8,673 | 4,024 | 2,612 | 1,022 | 65 | 325 | 4,649 | 3,292 |
| Pennsylvania | 219 | 105 | 59 | 37 | 1 | 8 | 114 | 9,487 | 8,331 | 4,061 | 2,559 | 1,071 | 32 | 399 | 4,270 | 3,790 |
| Middle Atlantic | 729 | 369 | 206 | 101 | 5 | 57 | 360 | 36,197 | 30,444 | 15,880 | 9,572 | 2,924 | 856 | 2,528 | 14,564 | 16,883 |
| Ohio | 235 | 105 | 66 | 32 | 5 | 2 | 130 | 14,406 | 13,155 | 5,606 | 4,335 | 913 | 256 | 102 | 7,549 | 4,091 |
| Indiana | 110 | 49 | 25 | 21 | 1 | 2 | 61 | 4,927 | 4,678 | 2,091 | 1,442 | 502 | 23 | 124 | 2,587 | 1,494 |
| Illinois | 171 | 65 | 37 | 14 | 2 | 12 | 106 | 8,606 | 7,549 | 3,147 | 1,819 | 454 | 75 | 799 | 4,402 | 2,162 |
| Michigan | 246 | 112 | 74 | 33 | 1 | 4 | 134 | 14,469 | 12,728 | 6,190 | 4,932 | 964 | 153 | 141 | 6,538 | 5,699 |
| Wisconsin | 94 | 28 | 16 | 9 | 0 | 3 | 66 | 5,722 | 5,225 | 2,153 | 1,353 | 470 | 26 | 304 | 3,072 | 906 |
| East North Central | 856 | 359 | 218 | 109 | 9 | 23 | 497 | 48,130 | 43,335 | 19,187 | 13,881 | 3,303 | 533 | 1,470 | 24,148 | 14,352 |
| Iowa | 45 | 22 | 14 | 6 | 0 | 2 | 23 | 1,886 | 1,713 | 899 | 528 | 333 | 0 | 38 | 814 | 940 |
| Minnesota | 82 | 37 | 17 | 14 | 3 | 3 | 45 | 2,658 | 2,468 | 1,163 | 548 | 369 | 36 | 210 | 1,305 | 1,001 |
| Missouri | 111 | 54 | 28 | 21 | 2 | 3 | 57 | 5,560 | 5,001 | 2,286 | 1,256 | 934 | 48 | 48 | 2,715 | 1,381 |
| North Dakota | 8 | 6 | 3 | 3 | 0 | 0 | 2 | 213 | 201 | 104 | 70 | 34 | 0 | 0 | 97 | 131 |
| South Dakota | 5 | 3 | 3 | 0 | 0 | 0 | 2 | 169 | 158 | 64 | 46 | 18 | 0 | 0 | 94 | 29 |
| Nebraska | 9 | 4 | 2 | 2 | 0 | 0 | 5 | 1,479 | 1,193 | 366 | 358 | 8 | 0 | 0 | 827 | 83 |
| Kansas | 40 | 11 | 8 | 3 | 0 | 0 | 29 | 1,943 | 1,791 | 515 | 384 | 131 | 0 | 0 | 1,276 | 192 |
| West North Central | 300 | 137 | 75 | 49 | 5 | 8 | 163 | 13,908 | 12,525 | 5,397 | 3,190 | 1,827 | 84 | 296 | 7,128 | 3,757 |
| Delaware | 9 | 2 | 1 | 1 | 0 | 0 | 7 | 905 | 825 | 301 | 205 | 96 | 0 | 0 | 524 | 37 |
| Maryland | 82 | 37 | 21 | 14 | 0 | 2 | 45 | 4,741 | 4,163 | 1,996 | 1,512 | 365 | 0 | 119 | 2,167 | 2,371 |
| District of Columbia | 21 | 14 | 9 | 1 | 0 | 4 | 7 | 600 | 502 | 291 | 201 | 12 | 15 | 63 | 211 | 350 |
| Virginia | 50 | 18 | 11 | 2 | 0 | 5 | 32 | 4,956 | 4,532 | 1,660 | 1,204 | 309 | 0 | 147 | 2,872 | 684 |
| West Virginia | 24 | 11 | 6 | 2 | 1 | 2 | 13 | 1,431 | 1,263 | 609 | 247 | 214 | 31 | 117 | 654 | 370 |
| North Carolina | 31 | 15 | 10 | 5 | 0 | 0 | 16 | 2,694 | 2,457 | 1,068 | 703 | 246 | 119 | 0 | 1,389 | 892 |
| South Carolina | 23 | 11 | 11 | 0 | 0 | 0 | 12 | 3,135 | 2,854 | 1,142 | 1,091 | 51 | 0 | 0 | 1,712 | 752 |
| Georgia | 73 | 28 | 18 | 7 | 1 | 2 | 45 | 6,976 | 6,529 | 2,869 | 2,225 | 562 | 75 | 7 | 3,660 | 2,153 |
| Florida | 72 | 29 | 15 | 10 | 0 | 4 | 43 | 5,331 | 5,109 | 2,296 | 1,616 | 425 | 12 | 243 | 2,813 | 1,786 |
| South Atlantic | 385 | 165 | 102 | 42 | 2 | 19 | 220 | 30,769 | 28,234 | 12,232 | 9,004 | 2,280 | 252 | 696 | 16,002 | 9,395 |
| Kentucky | 64 | 29 | 11 | 17 | 1 | 0 | 35 | 3,637 | 3,388 | 1,214 | 693 | 401 | 115 | 5 | 2,174 | 732 |
| Tennessee | 65 | 25 | 17 | 7 | 0 | 1 | 40 | 7,449 | 6,910 | 2,921 | 2,541 | 249 | 5 | 126 | 3,989 | 1,711 |
| Alabama | 62 | 32 | 29 | 3 | 0 | 0 | 30 | 5,065 | 4,630 | 2,302 | 2,141 | 101 | 41 | 19 | 2,328 | 2,177 |
| Mississippi | 22 | 10 | 10 | 0 | 0 | 0 | 12 | 3,005 | 2,806 | 1,449 | 1,383 | 24 | 0 | 42 | 1,357 | 1,376 |
| East South Central | 213 | 96 | 67 | 27 | 1 | 1 | 117 | 19,156 | 17,734 | 7,886 | 6,758 | 775 | 161 | 192 | 9,848 | 5,996 |
| Arkansas | 32 | 11 | 8 | 2 | 0 | 1 | 21 | 3,915 | 3,597 | 1,474 | 1,415 | 38 | 0 | 21 | 2,123 | 811 |
| Louisiana | 40 | 21 | 13 | 6 | 0 | 2 | 19 | 2,348 | 2,155 | 812 | 575 | 210 | 0 | 27 | 1,343 | 646 |
| Oklahoma | 27 | 8 | 7 | 1 | 0 | 0 | 19 | 1,723 | 1,412 | 749 | 714 | 35 | 0 | 0 | 663 | 772 |
| Texas | 81 | 42 | 27 | 11 | 1 | 3 | 39 | 5,525 | 4,864 | 2,504 | 1,589 | 699 | 22 | 194 | 2,360 | 2,294 |
| West South Central | 180 | 82 | 55 | 20 | 1 | 6 | 98 | 13,511 | 12,028 | 5,539 | 4,293 | 982 | 22 | 242 | 6,489 | 4,523 |
| Montana | 26 | 13 | 8 | 2 | 2 | 1 | 13 | 1,085 | 992 | 398 | 94 | 80 | 200 | 24 | 594 | 475 |
| Idaho | 20 | 8 | 3 | 3 | 1 | 1 | 12 | 458 | 408 | 174 | 121 | 28 | 20 | 5 | 234 | 87 |
| Wyoming | 6 | 2 | 2 | 0 | 0 | 0 | 4 | 124 | 114 | 45 | 27 | 0 | 18 | 0 | 69 | 25 |
| Colorado | 32 | 14 | 12 | 2 | 0 | 0 | 18 | 1,871 | 1,503 | 543 | 453 | 45 | 40 | 5 | 960 | 321 |
| New Mexico | 11 | 3 | 3 | 0 | 0 | 0 | 8 | 378 | 365 | 141 | 78 | 17 | 16 | 30 | 224 | 40 |
| Arizona | 24 | 11 | 8 | 2 | 1 | 0 | 13 | 2,004 | 1,775 | 902 | 703 | 189 | 10 | 0 | 873 | 845 |
| Utah | 15 | 7 | 4 | 3 | 0 | 0 | 8 | 401 | 368 | 139 | 83 | 56 | 0 | 0 | 229 | 100 |
| Nevada | 16 | 6 | 4 | 2 | 0 | 0 | 10 | 967 | 905 | 193 | 143 | 50 | 0 | 0 | 712 | 107 |
| Mountain | 150 | 64 | 44 | 14 | 4 | 2 | 86 | 7,288 | 6,430 | 2,535 | 1,702 | 465 | 304 | 64 | 3,895 | 2,000 |
| Washington | 95 | 39 | 23 | 9 | 2 | 5 | 56 | 3,873 | 3,166 | 1,719 | 1,109 | 272 | 77 | 261 | 1,447 | 2,334 |
| Oregon | 50 | 24 | 14 | 7 | 0 | 3 | 26 | 1,385 | 1,190 | 545 | 343 | 133 | 4 | 65 | 645 | 617 |
| California | 425 | 187 | 92 | 66 | 9 | 20 | 238 | 20,398 | 17,479 | 8,704 | 4,802 | 2,842 | 290 | 770 | 8,775 | 8,839 |
| Alaska | 27 | 16 | 7 | 7 | 0 | 2 | 11 | 744 | 664 | 356 | 92 | 170 | 17 | 77 | 308 | 418 |
| Hawaii | 13 | 10 | 5 | 1 | 3 | 1 | 3 | 1,050 | 735 | 617 | 285 | 76 | 48 | 208 | 118 | 935 |
| Guam | 3 | 2 | 1 | 0 | 0 | 1 | 1 | 1,701 | 1,543 | 428 | 390 | 0 | 0 | 38 | 1,115 | 112 |
| Pacific | 613 | 278 | 142 | 90 | 14 | 32 | 335 | 29,151 | 24,777 | 12,369 | 7,021 | 3,493 | 436 | 1,419 | 12,408 | 13,255 |
| Puerto Rico | 53 | 31 | 10 | 1 | 2 | 18 | 22 | 4,317 | 3,794 | 2,296 | 663 | 88 | 333 | 1,212 | 1,498 | 2,632 |
| Virgin Islands | 0 | 0 | 0 | 0 | 0 | 0 | 0 | 0 | 0 | 0 | 0 | 0 | 0 | 0 | 0 | 0 |
| Outlying Areas | 53 | 31 | 10 | 1 | 2 | 18 | 22 | 4,317 | 3,794 | 2,296 | 663 | 88 | 333 | 1,212 | 1,498 | 2,632 |
| Total, all States and areas | 3,749 | 1,745 | 1,048 | 481 | 44 | 172 | 2,004 | 217,331 | 192,392 | 89,699 | 60,982 | 17,344 | 3,020 | 8,353 | 102,693 | 78,073 |
- 1 The States are grouped according to the method used by the Bureau of the Census, U S Department of Commerce
929 of 929 figures sit in a row or column sum that works out.
Reader’s notes
p. 197. 17 columns: stub, "Total elections", five columns under "Number of elections in which representation rights were won by unions", three tall single columns, five columns under "Valid votes cast for unions", and two final tall columns. The division names (New England, Middle Atlantic, East North Central, West North Central) are indented subtotal rows set off by rules, transcribed with their own values. The crop ends after the West North Central subtotal line; the table continues on the following page (remaining divisions and the U.S. total are not on this image). No footnote text is printed on this crop, so `footnotes` is empty even though the stub heading carries a raised 1 ("Division and State^1"); the note's text must appear at the end of the table on a later page. In the Rhode Island row, the "Valid votes cast for unions / Teamsters" cell shows a small stray ink speck immediately left of the figure; the value itself reads 58 and is confirmed by the row arithmetic (73+58+0+22=153). All internal arithmetic checks out: in every state row the union subcolumns sum to the union "Total", total elections equals union wins plus no-representative elections, the vote subcolumns sum to the vote "Total", and total valid votes equals union votes plus votes for no union; each division subtotal equals the sum of its states in all 16 numeric columns. No printed figure appears to be a misprint.
p. 198. The crop is a continuation page (caption ends "—Continued"), 17 columns. The stub heading carries a raised footnote marker 1 ("Division and State^1"), but no footnote text is printed on this crop — it appears on the table's first page, so `footnotes` is empty. The table is cut off at the bottom: the Mountain division is incomplete, ending with Utah (the last row printed, sitting at the very bottom edge but fully legible). Nevada, the Mountain subtotal, the Pacific division and the grand total continue on the following page. The three division subtotal rows (South Atlantic, East South Central, West South Central) are printed indented and set off by rules; their labels are transcribed as printed. Every row was checked arithmetically and is internally consistent: total elections = won by unions + no representative chosen; the union "Total" equals AFL-CIO + Teamsters + other national + other local in both the election-count and the vote panels; total valid votes cast = votes for unions + votes for no union; and each division subtotal equals the sum of its constituent states in all 16 numeric columns. No misprints or doubtful cells were found.
p. 199. This is a continuation page (caption reads "—Continued"): the body opens with Nevada, the last State of the Mountain division, so the earlier Mountain States appear on the preceding page. Column headings are reprinted in full on this page and are transcribed above. The scan is a 1-bit halftone and the figure "1" is set with a serifless glyph that can read as a lowercase "l" (e.g. Guam "Teamsters"/"Other local unions" area, Puerto Rico "Teamsters" = 1, Outlying Areas "Teamsters" = 1); these are transcribed as the digit 1. Guam shows 1,701 employees eligible to vote and 1,543 valid votes cast against only 3 elections, which is unusually large for the number of elections, but the row is internally consistent (428 + 1,115 = 1,543) and is transcribed exactly as printed. All divisional subtotals (Mountain, Pacific, Outlying Areas) and the grand total were checked against the component rows and against the union/no-union splits; every check agreed with the printed figures, so no suspected misprints were found.
Source image
Source data: U.S. NLRB Annual Reports (public domain). Reconstruction by NLRB Stats Archive. Read by claude-opus-5 (effort max, prompt extract_v1) from the 300-dpi scan; stitched by page. Updated October 2026.