NLRB Stats Archive › Annual Reports › FY1985 › Standard Federal Administrative Regional Distribution of Cases Received, Fiscal Year 1985
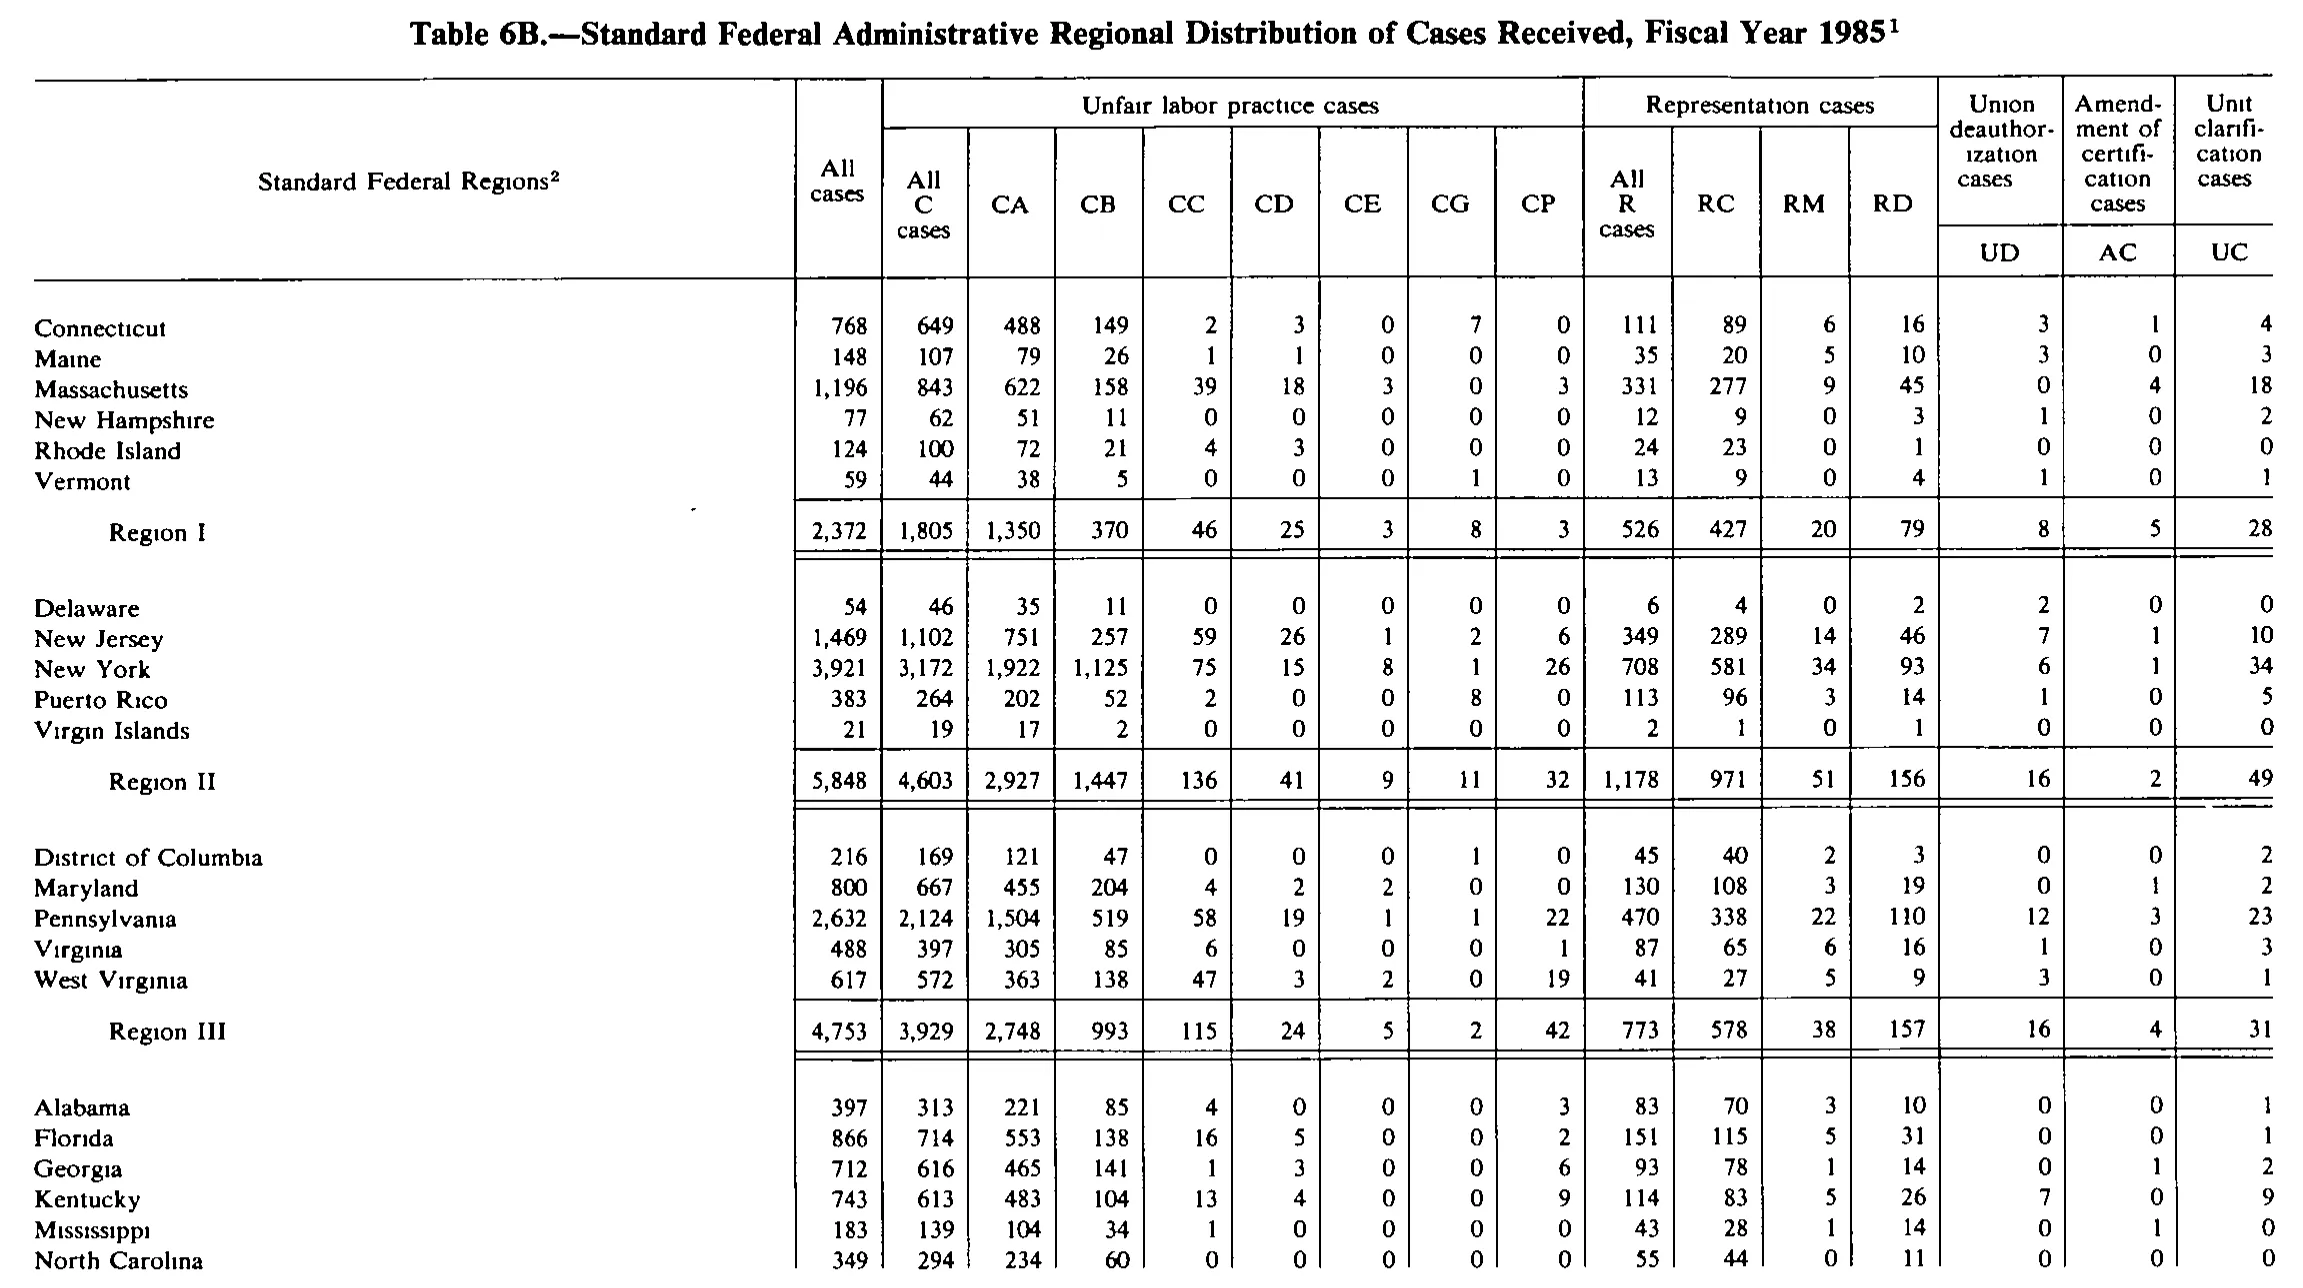
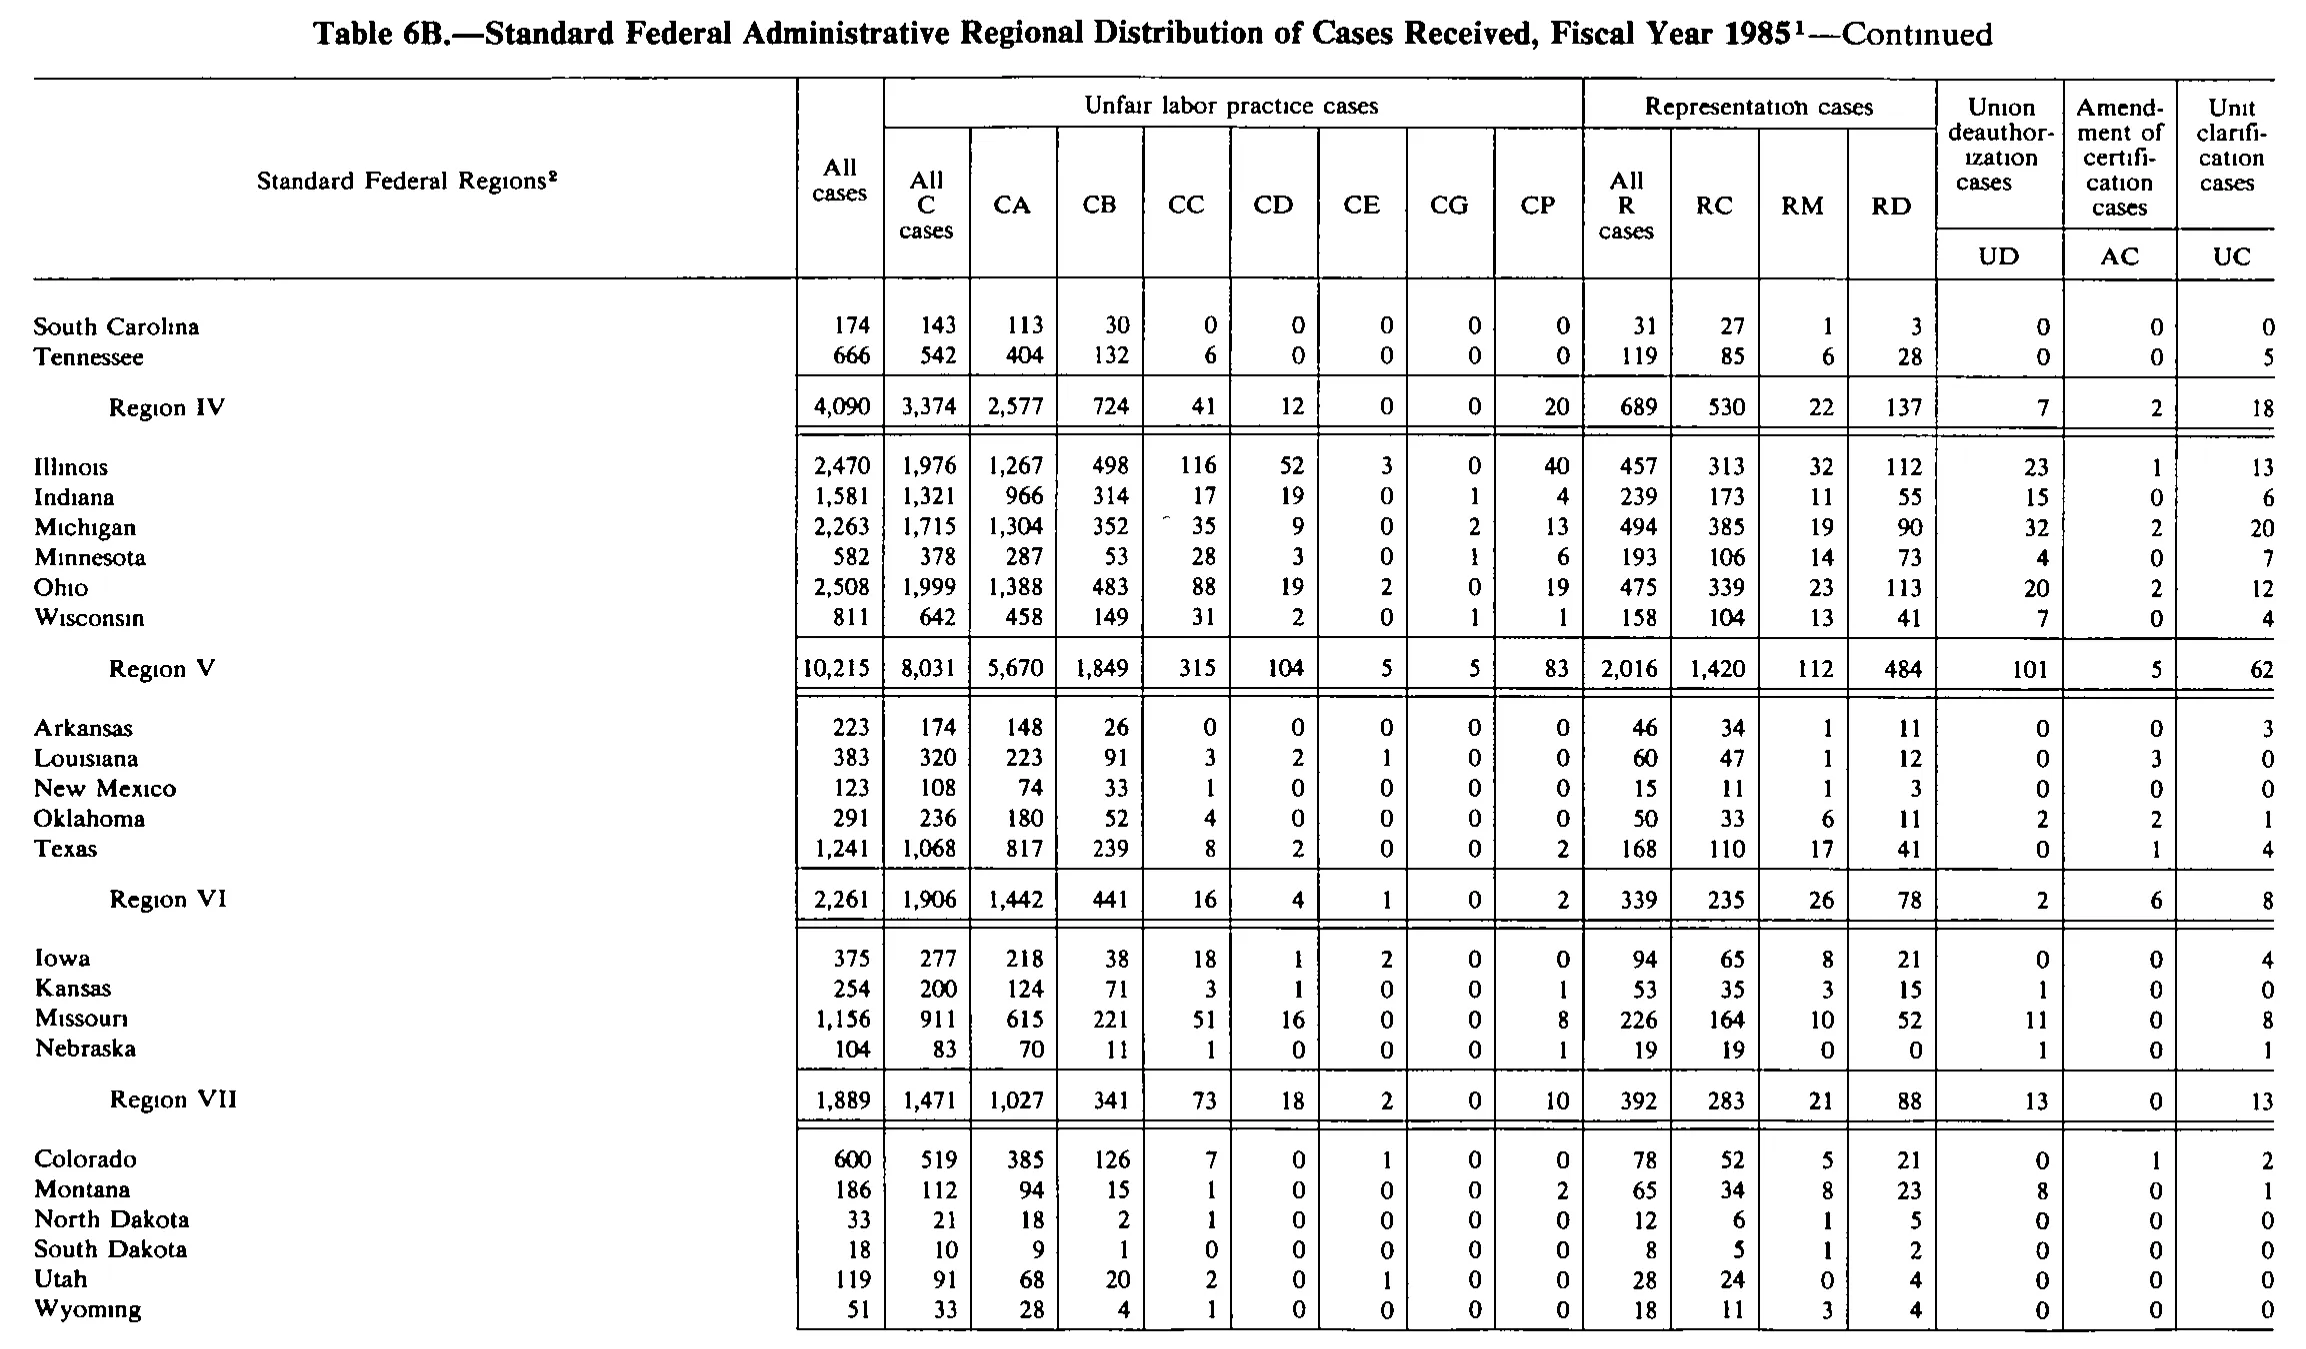
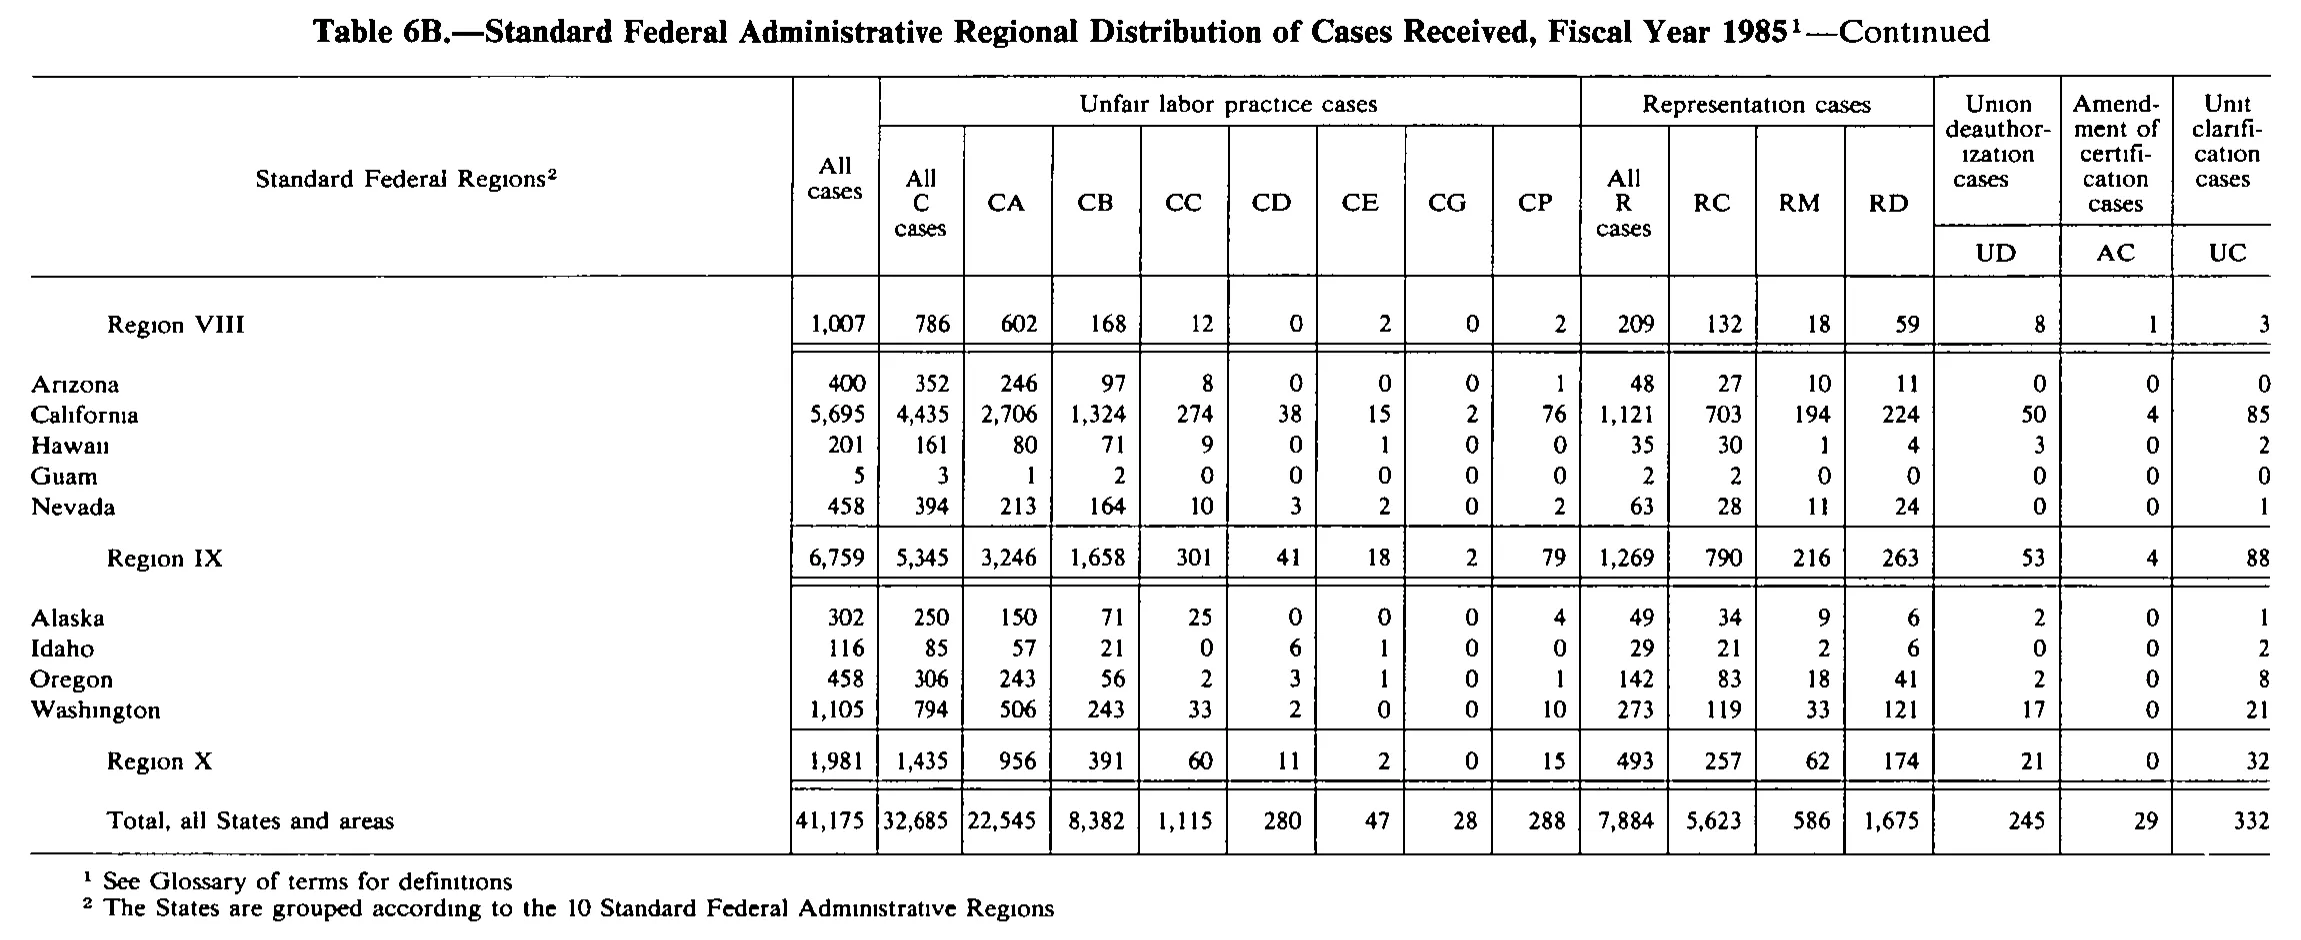
Standard Federal Administrative Regional Distribution of Cases Received, Fiscal Year 1985
Stitched from pp. 172–174.
| Standard Federal Regions | All cases | Unfair labor practice cases | Representation cases | Union deauthorization cases | Amendment of certification cases | Unit clarification cases | ||||||||||
|---|---|---|---|---|---|---|---|---|---|---|---|---|---|---|---|---|
| Standard Federal Regions | All cases | All C cases | CA | CB | CC | CD | CE | CG | CP | All R cases | RC | RM | RD | Union deauthorization cases | Amendment of certification cases | Unit clarification cases |
| Standard Federal Regions | All cases | All C cases | CA | CB | CC | CD | CE | CG | CP | All R cases | RC | RM | RD | UD | AC | UC |
| Connecticut | 768 | 649 | 488 | 149 | 2 | 3 | 0 | 7 | 0 | 111 | 89 | 6 | 16 | 3 | 1 | 4 |
| Maine | 148 | 107 | 79 | 26 | 1 | 1 | 0 | 0 | 0 | 35 | 20 | 5 | 10 | 3 | 0 | 3 |
| Massachusetts | 1,196 | 843 | 622 | 158 | 39 | 18 | 3 | 0 | 3 | 331 | 277 | 9 | 45 | 0 | 4 | 18 |
| New Hampshire | 77 | 62 | 51 | 11 | 0 | 0 | 0 | 0 | 0 | 12 | 9 | 0 | 3 | 1 | 0 | 2 |
| Rhode Island | 124 | 100 | 72 | 21 | 4 | 3 | 0 | 0 | 0 | 24 | 23 | 0 | 1 | 0 | 0 | 0 |
| Vermont | 59 | 44 | 38 | 5 | 0 | 0 | 0 | 1 | 0 | 13 | 9 | 0 | 4 | 1 | 0 | 1 |
| Region I | 2,372 | 1,805 | 1,350 | 370 | 46 | 25 | 3 | 8 | 3 | 526 | 427 | 20 | 79 | 8 | 5 | 28 |
| Delaware | 54 | 46 | 35 | 11 | 0 | 0 | 0 | 0 | 0 | 6 | 4 | 0 | 2 | 2 | 0 | 0 |
| New Jersey | 1,469 | 1,102 | 751 | 257 | 59 | 26 | 1 | 2 | 6 | 349 | 289 | 14 | 46 | 7 | 1 | 10 |
| New York | 3,921 | 3,172 | 1,922 | 1,125 | 75 | 15 | 8 | 1 | 26 | 708 | 581 | 34 | 93 | 6 | 1 | 34 |
| Puerto Rico | 383 | 264 | 202 | 52 | 2 | 0 | 0 | 8 | 0 | 113 | 96 | 3 | 14 | 1 | 0 | 5 |
| Virgin Islands | 21 | 19 | 17 | 2 | 0 | 0 | 0 | 0 | 0 | 2 | 1 | 0 | 1 | 0 | 0 | 0 |
| Region II | 5,848 | 4,603 | 2,927 | 1,447 | 136 | 41 | 9 | 11 | 32 | 1,178 | 971 | 51 | 156 | 16 | 2 | 49 |
| District of Columbia | 216 | 169 | 121 | 47 | 0 | 0 | 0 | 1 | 0 | 45 | 40 | 2 | 3 | 0 | 0 | 2 |
| Maryland | 800 | 667 | 455 | 204 | 4 | 2 | 2 | 0 | 0 | 130 | 108 | 3 | 19 | 0 | 1 | 2 |
| Pennsylvania | 2,632 | 2,124 | 1,504 | 519 | 58 | 19 | 1 | 1 | 22 | 470 | 338 | 22 | 110 | 12 | 3 | 23 |
| Virginia | 488 | 397 | 305 | 85 | 6 | 0 | 0 | 0 | 1 | 87 | 65 | 6 | 16 | 1 | 0 | 3 |
| West Virginia | 617 | 572 | 363 | 138 | 47 | 3 | 2 | 0 | 19 | 41 | 27 | 5 | 9 | 3 | 0 | 1 |
| Region III | 4,753 | 3,929 | 2,748 | 993 | 115 | 24 | 5 | 2 | 42 | 773 | 578 | 38 | 157 | 16 | 4 | 31 |
| Alabama | 397 | 313 | 221 | 85 | 4 | 0 | 0 | 0 | 3 | 83 | 70 | 3 | 10 | 0 | 0 | 1 |
| Florida | 866 | 714 | 553 | 138 | 16 | 5 | 0 | 0 | 2 | 151 | 115 | 5 | 31 | 0 | 0 | 1 |
| Georgia | 712 | 616 | 465 | 141 | 1 | 3 | 0 | 0 | 6 | 93 | 78 | 1 | 14 | 0 | 1 | 2 |
| Kentucky | 743 | 613 | 483 | 104 | 13 | 4 | 0 | 0 | 9 | 114 | 83 | 5 | 26 | 7 | 0 | 9 |
| Mississippi | 183 | 139 | 104 | 34 | 1 | 0 | 0 | 0 | 0 | 43 | 28 | 1 | 14 | 0 | 1 | 0 |
| North Carolina | 349 | 294 | 234 | 60 | 0 | 0 | 0 | 0 | 0 | 55 | 44 | 0 | 11 | 0 | 0 | 0 |
| South Carolina | 174 | 143 | 113 | 30 | 0 | 0 | 0 | 0 | 0 | 31 | 27 | 1 | 3 | 0 | 0 | 0 |
| Tennessee | 666 | 542 | 404 | 132 | 6 | 0 | 0 | 0 | 0 | 119 | 85 | 6 | 28 | 0 | 0 | 5 |
| Region IV | 4,090 | 3,374 | 2,577 | 724 | 41 | 12 | 0 | 0 | 20 | 689 | 530 | 22 | 137 | 7 | 2 | 18 |
| Illinois | 2,470 | 1,976 | 1,267 | 498 | 116 | 52 | 3 | 0 | 40 | 457 | 313 | 32 | 112 | 23 | 1 | 13 |
| Indiana | 1,581 | 1,321 | 966 | 314 | 17 | 19 | 0 | 1 | 4 | 239 | 173 | 11 | 55 | 15 | 0 | 6 |
| Michigan | 2,263 | 1,715 | 1,304 | 352 | 35 | 9 | 0 | 2 | 13 | 494 | 385 | 19 | 90 | 32 | 2 | 20 |
| Minnesota | 582 | 378 | 287 | 53 | 28 | 3 | 0 | 1 | 6 | 193 | 106 | 14 | 73 | 4 | 0 | 7 |
| Ohio | 2,508 | 1,999 | 1,388 | 483 | 88 | 19 | 2 | 0 | 19 | 475 | 339 | 23 | 113 | 20 | 2 | 12 |
| Wisconsin | 811 | 642 | 458 | 149 | 31 | 2 | 0 | 1 | 1 | 158 | 104 | 13 | 41 | 7 | 0 | 4 |
| Region V | 10,215 | 8,031 | 5,670 | 1,849 | 315 | 104 | 5 | 5 | 83 | 2,016 | 1,420 | 112 | 484 | 101 | 5 | 62 |
| Arkansas | 223 | 174 | 148 | 26 | 0 | 0 | 0 | 0 | 0 | 46 | 34 | 1 | 11 | 0 | 0 | 3 |
| Louisiana | 383 | 320 | 223 | 91 | 3 | 2 | 1 | 0 | 0 | 60 | 47 | 1 | 12 | 0 | 3 | 0 |
| New Mexico | 123 | 108 | 74 | 33 | 1 | 0 | 0 | 0 | 0 | 15 | 11 | 1 | 3 | 0 | 0 | 0 |
| Oklahoma | 291 | 236 | 180 | 52 | 4 | 0 | 0 | 0 | 0 | 50 | 33 | 6 | 11 | 2 | 2 | 1 |
| Texas | 1,241 | 1,068 | 817 | 239 | 8 | 2 | 0 | 0 | 2 | 168 | 110 | 17 | 41 | 0 | 1 | 4 |
| Region VI | 2,261 | 1,906 | 1,442 | 441 | 16 | 4 | 1 | 0 | 2 | 339 | 235 | 26 | 78 | 2 | 6 | 8 |
| Iowa | 375 | 277 | 218 | 38 | 18 | 1 | 2 | 0 | 0 | 94 | 65 | 8 | 21 | 0 | 0 | 4 |
| Kansas | 254 | 200 | 124 | 71 | 3 | 1 | 0 | 0 | 1 | 53 | 35 | 3 | 15 | 1 | 0 | 0 |
| Missouri | 1,156 | 911 | 615 | 221 | 51 | 16 | 0 | 0 | 8 | 226 | 164 | 10 | 52 | 11 | 0 | 8 |
| Nebraska | 104 | 83 | 70 | 11 | 1 | 0 | 0 | 0 | 1 | 19 | 19 | 0 | 0 | 1 | 0 | 1 |
| Region VII | 1,889 | 1,471 | 1,027 | 341 | 73 | 18 | 2 | 0 | 10 | 392 | 283 | 21 | 88 | 13 | 0 | 13 |
| Colorado | 600 | 519 | 385 | 126 | 7 | 0 | 1 | 0 | 0 | 78 | 52 | 5 | 21 | 0 | 1 | 2 |
| Montana | 186 | 112 | 94 | 15 | 1 | 0 | 0 | 0 | 2 | 65 | 34 | 8 | 23 | 8 | 0 | 1 |
| North Dakota | 33 | 21 | 18 | 2 | 1 | 0 | 0 | 0 | 0 | 12 | 6 | 1 | 5 | 0 | 0 | 0 |
| South Dakota | 18 | 10 | 9 | 1 | 0 | 0 | 0 | 0 | 0 | 8 | 5 | 1 | 2 | 0 | 0 | 0 |
| Utah | 119 | 91 | 68 | 20 | 2 | 0 | 1 | 0 | 0 | 28 | 24 | 0 | 4 | 0 | 0 | 0 |
| Wyoming | 51 | 33 | 28 | 4 | 1 | 0 | 0 | 0 | 0 | 18 | 11 | 3 | 4 | 0 | 0 | 0 |
| Region VIII | 1,007 | 786 | 602 | 168 | 12 | 0 | 2 | 0 | 2 | 209 | 132 | 18 | 59 | 8 | 1 | 3 |
| Arizona | 400 | 352 | 246 | 97 | 8 | 0 | 0 | 0 | 1 | 48 | 27 | 10 | 11 | 0 | 0 | 0 |
| California | 5,695 | 4,435 | 2,706 | 1,324 | 274 | 38 | 15 | 2 | 76 | 1,121 | 703 | 194 | 224 | 50 | 4 | 85 |
| Hawaii | 201 | 161 | 80 | 71 | 9 | 0 | 1 | 0 | 0 | 35 | 30 | 1 | 4 | 3 | 0 | 2 |
| Guam | 5 | 3 | 1 | 2 | 0 | 0 | 0 | 0 | 0 | 2 | 2 | 0 | 0 | 0 | 0 | 0 |
| Nevada | 458 | 394 | 213 | 164 | 10 | 3 | 2 | 0 | 2 | 63 | 28 | 11 | 24 | 0 | 0 | 1 |
| Region IX | 6,759 | 5,345 | 3,246 | 1,658 | 301 | 41 | 18 | 2 | 79 | 1,269 | 790 | 216 | 263 | 53 | 4 | 88 |
| Alaska | 302 | 250 | 150 | 71 | 25 | 0 | 0 | 0 | 4 | 49 | 34 | 9 | 6 | 2 | 0 | 1 |
| Idaho | 116 | 85 | 57 | 21 | 0 | 6 | 1 | 0 | 0 | 29 | 21 | 2 | 6 | 0 | 0 | 2 |
| Oregon | 458 | 306 | 243 | 56 | 2 | 3 | 1 | 0 | 1 | 142 | 83 | 18 | 41 | 2 | 0 | 8 |
| Washington | 1,105 | 794 | 506 | 243 | 33 | 2 | 0 | 0 | 10 | 273 | 119 | 33 | 121 | 17 | 0 | 21 |
| Region X | 1,981 | 1,435 | 956 | 391 | 60 | 11 | 2 | 0 | 15 | 493 | 257 | 62 | 174 | 21 | 0 | 32 |
| Total, all States and areas | 41,175 | 32,685 | 22,545 | 8,382 | 1,115 | 280 | 47 | 28 | 288 | 7,884 | 5,623 | 586 | 1,675 | 245 | 29 | 332 |
- 1 See Glossary of terms for definitions
- 2 The States are grouped according to the 10 Standard Federal Administrative Regions
798 of 798 figures sit in a row or column sum that works out.
Reader’s notes
p. 172. The table has 17 printed columns: the stub, "All cases", eight columns under "Unfair labor practice cases" (All C cases, CA, CB, CC, CD, CE, CG, CP), four under "Representation cases" (All R cases, RC, RM, RD), and three tall single columns whose spanner headings sit over the code lines UD, AC and UC. The crop ends in the middle of the Region IV block: the last printed line on the image is North Carolina, so the remaining Region IV states and the Region IV subtotal, all later regions, and any footnote texts (the caption carries a raised 1 and the stub heading a raised 2) are not on this image. No footnotes are printed under the visible portion, so the footnote list is empty. The UC (rightmost) cells of the last two rows, Mississippi and North Carolina, sit right at the cropped bottom edge and are faint; I read both as 0, which is what each row's own components require (Mississippi 139 + 43 + 0 + 1 = 183; North Carolina 294 + 55 + 0 + 0 = 349). If a reader needs certainty on those two cells, re-crop with a few more millimetres of the page. Blank spacer lines between region blocks carry no label or values and are not transcribed as rows. Every other row and every region subtotal checks out internally (component columns sum to the "All C cases" / "All R cases" totals, and those plus UD, AC and UC sum to "All cases"), and each Region I-III subtotal equals the sum of its member states in every column; no misprints were found.
p. 173. Continuation page of Table 6B; no footnote texts are printed on this crop even though markers 1 (caption) and 2 (stub heading "Standard Federal Regions") are referenced, so `footnotes` is empty. The crop begins mid-table: the first two rows (South Carolina, Tennessee) are the tail of the Region IV block whose earlier states appear on the preceding page. The crop also ends mid-block: Wyoming is the last printed row and the Region VIII total line that would close that block is cut off below the image edge. The three header levels are: the spanner row, the code row (All C cases / CA ... RD), and the bottom box holding UD, AC, UC; the stub heading, "All cases", and the last three headings span all levels and are repeated accordingly. The headings "All C cases", "All R cases", "Union deauthorization cases", "Amendment of certification cases" and "Unit clarification cases" are printed stacked and hyphenated ("deauthor-/ization", "Amend-/ment of/certifi-/cation", "clarifi-/cation") and have been joined and de-hyphenated. A small stray tick mark appears in the scan just above the "35" in the Michigan CC column; it is print noise, not a footnote marker, and was not transcribed. Every row's ULP columns sum to its "All C cases" value and the component columns sum to "All cases", and each Region total equals the sum of its states, so no misprints were detected.
p. 174. This is a continuation page ("—Continued" in the caption): the body opens with the "Region VIII" subtotal line, so the individual States making up Region VIII appear on the preceding page and are not on this crop. The column headings are reprinted here, so they are transcribed. Column structure: 17 columns — stub, "All cases", eight columns under "Unfair labor practice cases" (All C cases, CA, CB, CC, CD, CE, CG, CP), four under "Representation cases" (All R cases, RC, RM, RD), then three tall single-column headings whose code lines (UD, AC, UC) sit in a third heading band; the middle headings span that band, so they are repeated in header level 3. Arithmetic verification: every State row's "All cases" equals All C + All R + UD + AC + UC, each "All C cases" equals CA…CP, each "All R cases" equals RC+RM+RD, and the Region IX and Region X subtotals equal the sum of their listed States in all 16 value columns. The Region VIII and grand-total lines are likewise internally consistent across columns. No printed figure appears to be a misprint. The scan is slightly soft on dotted/dieresis characters (e.g. "Arizona", "Hawaii", "Region VIII" read cleanly but with faint i-dots); no value cell was doubtful.
Source image
Source data: U.S. NLRB Annual Reports (public domain). Reconstruction by NLRB Stats Archive. Read by claude-opus-5 (effort max, prompt extract_v1) from the 300-dpi scan; stitched by page. Updated October 2026.