NLRB Stats Archive › Annual Reports › FY1984 › Distribution of Unfair Labor Practice Situations Received, by Number of Employees in Establishments, Fiscal Year 1984
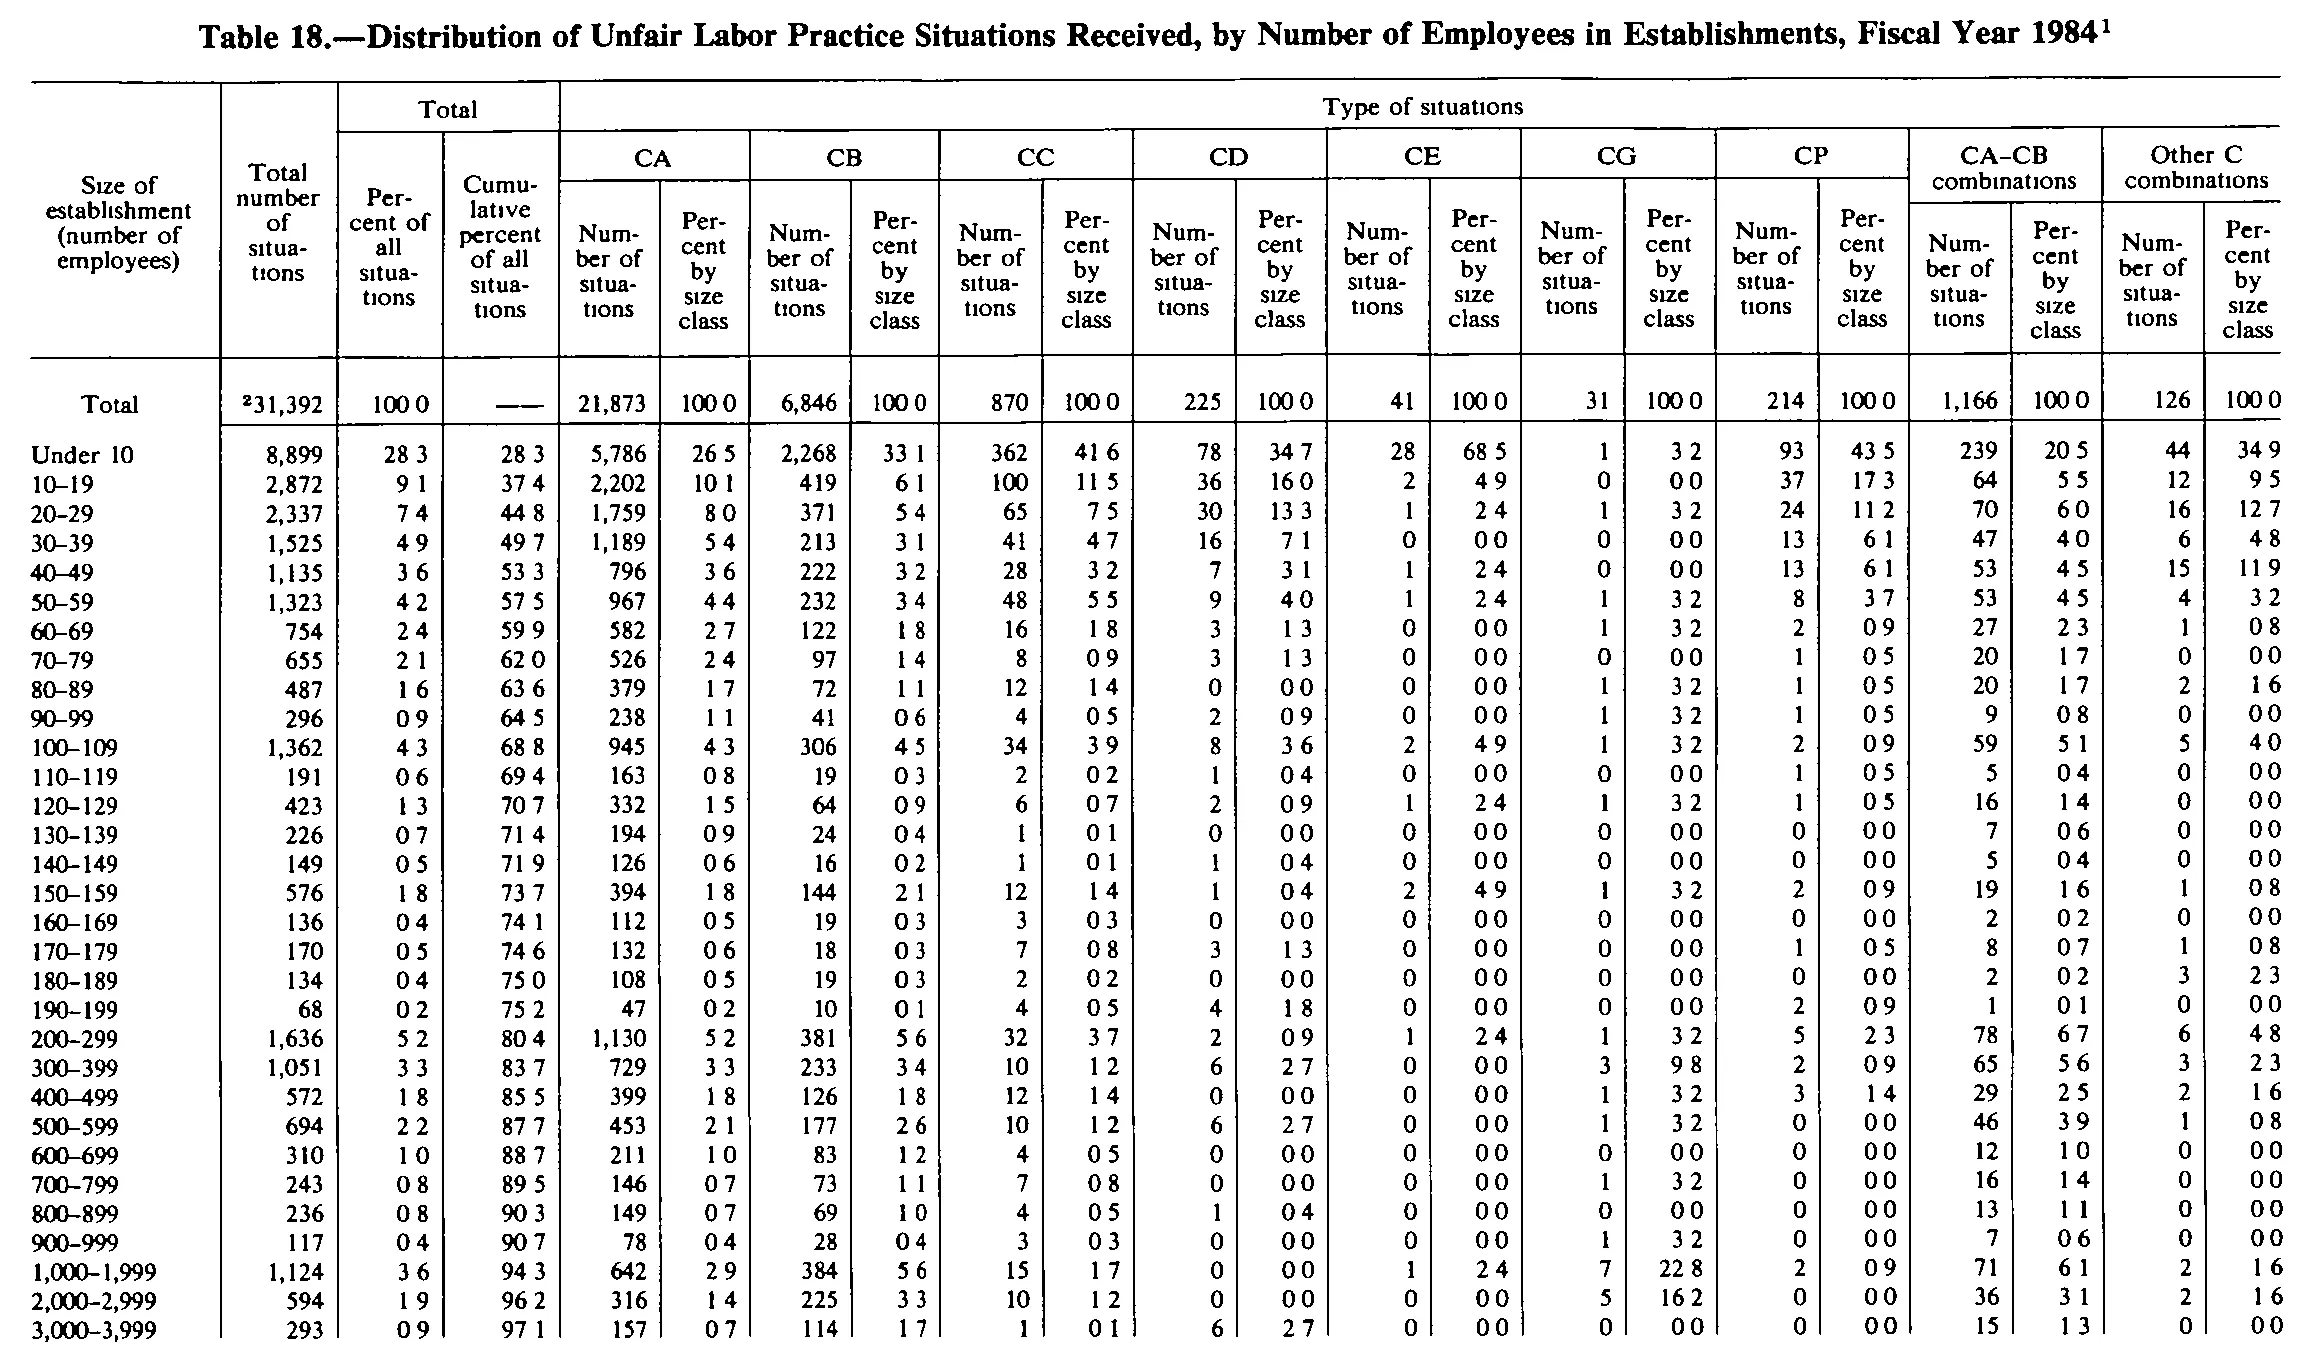
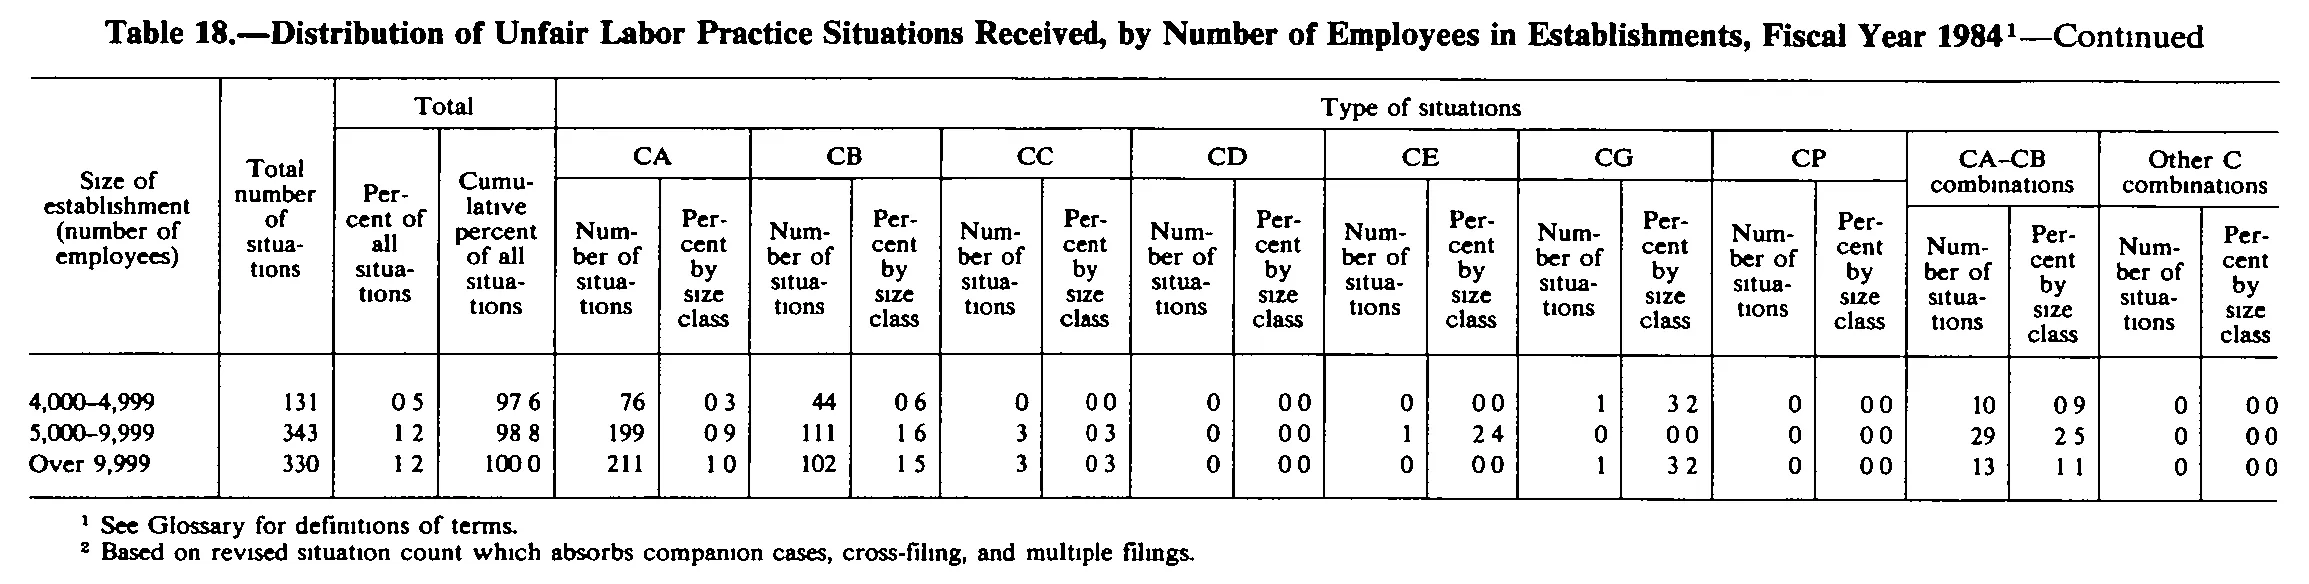
Distribution of Unfair Labor Practice Situations Received, by Number of Employees in Establishments, Fiscal Year 1984
Stitched from pp. 240–241.
| Size of establishment (number of employees) | Total number of situations | Total | Type of situations | ||||||||||||||||||
|---|---|---|---|---|---|---|---|---|---|---|---|---|---|---|---|---|---|---|---|---|---|
| Size of establishment (number of employees) | Total number of situations | Percent of all situations | Cumulative percent of all situations | CA | CB | CC | CD | CE | CG | CP | CA–CB combinations | Other C combinations | |||||||||
| Size of establishment (number of employees) | Total number of situations | Percent of all situations | Cumulative percent of all situations | Number of situations | Percent by size class | Number of situations | Percent by size class | Number of situations | Percent by size class | Number of situations | Percent by size class | Number of situations | Percent by size class | Number of situations | Percent by size class | Number of situations | Percent by size class | Number of situations | Percent by size class | Number of situations | Percent by size class |
| Total | 31,392 | 100.0 | 21,873 | 100.0 | 6,846 | 100.0 | 870 | 100.0 | 225 | 100.0 | 41 | 100.0 | 31 | 100.0 | 214 | 100.0 | 1,166 | 100.0 | 126 | 100.0 | |
| Under 10 | 8,899 | 28.3 | 28.3 | 5,786 | 26.5 | 2,268 | 33.1 | 362 | 41.6 | 78 | 34.7 | 28 | 68.5 | 1 | 3.2 | 93 | 43.5 | 239 | 20.5 | 44 | 34.9 |
| 10–19 | 2,872 | 9.1 | 37.4 | 2,202 | 10.1 | 419 | 6.1 | 100 | 11.5 | 36 | 16.0 | 2 | 4.9 | 0 | 0.0 | 37 | 17.3 | 64 | 5.5 | 12 | 9.5 |
| 20–29 | 2,337 | 7.4 | 44.8 | 1,759 | 8.0 | 371 | 5.4 | 65 | 7.5 | 30 | 13.3 | 1 | 2.4 | 1 | 3.2 | 24 | 11.2 | 70 | 6.0 | 16 | 12.7 |
| 30–39 | 1,525 | 4.9 | 49.7 | 1,189 | 5.4 | 213 | 3.1 | 41 | 4.7 | 16 | 7.1 | 0 | 0.0 | 0 | 0.0 | 13 | 6.1 | 47 | 4.0 | 6 | 4.8 |
| 40–49 | 1,135 | 3.6 | 53.3 | 796 | 3.6 | 222 | 3.2 | 28 | 3.2 | 7 | 3.1 | 1 | 2.4 | 0 | 0.0 | 13 | 6.1 | 53 | 4.5 | 15 | 11.9 |
| 50–59 | 1,323 | 4.2 | 57.5 | 967 | 4.4 | 232 | 3.4 | 48 | 5.5 | 9 | 4.0 | 1 | 2.4 | 1 | 3.2 | 8 | 3.7 | 53 | 4.5 | 4 | 3.2 |
| 60–69 | 754 | 2.4 | 59.9 | 582 | 2.7 | 122 | 1.8 | 16 | 1.8 | 3 | 1.3 | 0 | 0.0 | 1 | 3.2 | 2 | 0.9 | 27 | 2.3 | 1 | 0.8 |
| 70–79 | 655 | 2.1 | 62.0 | 526 | 2.4 | 97 | 1.4 | 8 | 0.9 | 3 | 1.3 | 0 | 0.0 | 0 | 0.0 | 1 | 0.5 | 20 | 1.7 | 0 | 0.0 |
| 80–89 | 487 | 1.6 | 63.6 | 379 | 1.7 | 72 | 1.1 | 12 | 1.4 | 0 | 0.0 | 0 | 0.0 | 1 | 3.2 | 1 | 0.5 | 20 | 1.7 | 2 | 1.6 |
| 90–99 | 296 | 0.9 | 64.5 | 238 | 1.1 | 41 | 0.6 | 4 | 0.5 | 2 | 0.9 | 0 | 0.0 | 1 | 3.2 | 1 | 0.5 | 9 | 0.8 | 0 | 0.0 |
| 100–109 | 1,362 | 4.3 | 68.8 | 945 | 4.3 | 306 | 4.5 | 34 | 3.9 | 8 | 3.6 | 2 | 4.9 | 1 | 3.2 | 2 | 0.9 | 59 | 5.1 | 5 | 4.0 |
| 110–119 | 191 | 0.6 | 69.4 | 163 | 0.8 | 19 | 0.3 | 2 | 0.2 | 1 | 0.4 | 0 | 0.0 | 0 | 0.0 | 1 | 0.5 | 5 | 0.4 | 0 | 0.0 |
| 120–129 | 423 | 1.3 | 70.7 | 332 | 1.5 | 64 | 0.9 | 6 | 0.7 | 2 | 0.9 | 1 | 2.4 | 1 | 3.2 | 1 | 0.5 | 16 | 1.4 | 0 | 0.0 |
| 130–139 | 226 | 0.7 | 71.4 | 194 | 0.9 | 24 | 0.4 | 1 | 0.1 | 0 | 0.0 | 0 | 0.0 | 0 | 0.0 | 0 | 0.0 | 7 | 0.6 | 0 | 0.0 |
| 140–149 | 149 | 0.5 | 71.9 | 126 | 0.6 | 16 | 0.2 | 1 | 0.1 | 1 | 0.4 | 0 | 0.0 | 0 | 0.0 | 0 | 0.0 | 5 | 0.4 | 0 | 0.0 |
| 150–159 | 576 | 1.8 | 73.7 | 394 | 1.8 | 144 | 2.1 | 12 | 1.4 | 1 | 0.4 | 2 | 4.9 | 1 | 3.2 | 2 | 0.9 | 19 | 1.6 | 1 | 0.8 |
| 160–169 | 136 | 0.4 | 74.1 | 112 | 0.5 | 19 | 0.3 | 3 | 0.3 | 0 | 0.0 | 0 | 0.0 | 0 | 0.0 | 0 | 0.0 | 2 | 0.2 | 0 | 0.0 |
| 170–179 | 170 | 0.5 | 74.6 | 132 | 0.6 | 18 | 0.3 | 7 | 0.8 | 3 | 1.3 | 0 | 0.0 | 0 | 0.0 | 1 | 0.5 | 8 | 0.7 | 1 | 0.8 |
| 180–189 | 134 | 0.4 | 75.0 | 108 | 0.5 | 19 | 0.3 | 2 | 0.2 | 0 | 0.0 | 0 | 0.0 | 0 | 0.0 | 0 | 0.0 | 2 | 0.2 | 3 | 2.3 |
| 190–199 | 68 | 0.2 | 75.2 | 47 | 0.2 | 10 | 0.1 | 4 | 0.5 | 4 | 1.8 | 0 | 0.0 | 0 | 0.0 | 2 | 0.9 | 1 | 0.1 | 0 | 0.0 |
| 200–299 | 1,636 | 5.2 | 80.4 | 1,130 | 5.2 | 381 | 5.6 | 32 | 3.7 | 2 | 0.9 | 1 | 2.4 | 1 | 3.2 | 5 | 2.3 | 78 | 6.7 | 6 | 4.8 |
| 300–399 | 1,051 | 3.3 | 83.7 | 729 | 3.3 | 233 | 3.4 | 10 | 1.2 | 6 | 2.7 | 0 | 0.0 | 3 | 9.8 | 2 | 0.9 | 65 | 5.6 | 3 | 2.3 |
| 400–499 | 572 | 1.8 | 85.5 | 399 | 1.8 | 126 | 1.8 | 12 | 1.4 | 0 | 0.0 | 0 | 0.0 | 1 | 3.2 | 3 | 1.4 | 29 | 2.5 | 2 | 1.6 |
| 500–599 | 694 | 2.2 | 87.7 | 453 | 2.1 | 177 | 2.6 | 10 | 1.2 | 6 | 2.7 | 0 | 0.0 | 1 | 3.2 | 0 | 0.0 | 46 | 3.9 | 1 | 0.8 |
| 600–699 | 310 | 1.0 | 88.7 | 211 | 1.0 | 83 | 1.2 | 4 | 0.5 | 0 | 0.0 | 0 | 0.0 | 0 | 0.0 | 0 | 0.0 | 12 | 1.0 | 0 | 0.0 |
| 700–799 | 243 | 0.8 | 89.5 | 146 | 0.7 | 73 | 1.1 | 7 | 0.8 | 0 | 0.0 | 0 | 0.0 | 1 | 3.2 | 0 | 0.0 | 16 | 1.4 | 0 | 0.0 |
| 800–899 | 236 | 0.8 | 90.3 | 149 | 0.7 | 69 | 1.0 | 4 | 0.5 | 1 | 0.4 | 0 | 0.0 | 0 | 0.0 | 0 | 0.0 | 13 | 1.1 | 0 | 0.0 |
| 900–999 | 117 | 0.4 | 90.7 | 78 | 0.4 | 28 | 0.4 | 3 | 0.3 | 0 | 0.0 | 0 | 0.0 | 1 | 3.2 | 0 | 0.0 | 7 | 0.6 | 0 | 0.0 |
| 1,000–1,999 | 1,124 | 3.6 | 94.3 | 642 | 2.9 | 384 | 5.6 | 15 | 1.7 | 0 | 0.0 | 1 | 2.4 | 7 | 22.8 | 2 | 0.9 | 71 | 6.1 | 2 | 1.6 |
| 2,000–2,999 | 594 | 1.9 | 96.2 | 316 | 1.4 | 225 | 3.3 | 10 | 1.2 | 0 | 0.0 | 0 | 0.0 | 5 | 16.2 | 0 | 0.0 | 36 | 3.1 | 2 | 1.6 |
| 3,000–3,999 | 293 | 0.9 | 97.1 | 157 | 0.7 | 114 | 1.7 | 1 | 0.1 | 6 | 2.7 | 0 | 0.0 | 0 | 0.0 | 0 | 0.0 | 15 | 1.3 | 0 | 0.0 |
| 4,000–4,999 | 131 | 0.5 | 97.6 | 76 | 0.3 | 44 | 0.6 | 0 | 0.0 | 0 | 0.0 | 0 | 0.0 | 1 | 3.2 | 0 | 0.0 | 10 | 0.9 | 0 | 0.0 |
| 5,000–9,999 | 343 | 1.2 | 98.8 | 199 | 0.9 | 111 | 1.6 | 3 | 0.3 | 0 | 0.0 | 1 | 2.4 | 0 | 0.0 | 0 | 0.0 | 29 | 2.5 | 0 | 0.0 |
| Over 9,999 | 330 | 1.2 | 100.0 | 211 | 1.0 | 102 | 1.5 | 3 | 0.3 | 0 | 0.0 | 0 | 0.0 | 1 | 3.2 | 0 | 0.0 | 13 | 1.1 | 0 | 0.0 |
- 1 See Glossary for definitions of terms.
- 2 Based on revised situation count which absorbs companion cases, cross-filing, and multiple filings.
268 of 268 figures sit in a row or column sum that works out.
Reader’s notes
p. 240. CROP IS INCOMPLETE AT THE BOTTOM. The body is cut off immediately below the "3,000-3,999" row (cumulative percent only reaches 97.1), so the remaining size classes (4,000+ etc.) and any closing rule are not on this image. No footnote block is visible, hence `footnotes` is empty — the footnote texts for the caption marker 1 and for the marker 2 on the Total column-1 value are presumably printed on the continuation. DECIMAL POINTS. This is a 1-bit scan in which the periods in the one-decimal percentages have largely dropped out, so every percent cell images as e.g. "100 0", "28 3", "68 5". These are unambiguously the printed one-decimal percentages (the cumulative-percent column rises monotonically 28.3 -> 97.1, and nearly every "number / column total" recomputes to the printed value), so I have written them with the decimal point: "100.0", "28.3". No other normalization was applied. Column structure: 22 columns. Col 0 stub; col 1 "Total number of situations"; cols 2-3 under the spanner "Total"; cols 4-21 under the spanner "Type of situations", in pairs (Number of situations / Percent by size class) for CA, CB, CC, CD, CE, CG, CP, CA-CB combinations, Other C combinations. Total row, cumulative-percent column (col 3) is printed as a long dash rule, transcribed as "". Marker: the Total row's first value is printed with a small raised 2 in front of it; transcribed as "31,392^2". CELLS WHERE THE PRINTED VALUE DISAGREES WITH ARITHMETIC (transcribed as printed, not corrected). Every percent-by-size-class column recomputes exactly against its column total except four cells, all in the two narrowest columns, and all read the same way on two separate passes: - row "Under 10", CE "Percent by size class": printed 68.5; 28/41 = 68.3. - row "300-399", CG "Percent by size class": printed 9.8; 3/31 = 9.7. - row "1,000-1,999", CG "Percent by size class": printed 22.8; 7/31 = 22.6. - row "2,000-2,999", CG "Percent by size class": printed 16.2; 5/31 = 16.1. These are the four cells in the table I am least certain of (a 5/3 and a 8/6 confusion at this resolution would reconcile all four), but the glyphs as imaged read 5, 8, 8, 2 and I have left them as printed. Dashes in the range labels and in "CA-CB combinations" are typeset as en dashes and transcribed as such.
p. 241. Crop is the continuation page of Table 18; it reprints the full column headings but carries only the last three size classes (4,000–4,999 through Over 9,999). The earlier size classes and the table's total line are on the preceding page. Decimal points: in every percent column the decimal separator is nearly invisible at this scan resolution, so the cells read as "0 5", "97 6", "100 0", etc. These are percentages (the cumulative column runs 97.6, 98.8, 100.0), so I transcribed them with the decimal point: e.g. "0.5", "97.6", "100.0". No digits were altered. Column structure: 22 columns. "Total number of situations" is a tall stub-side heading spanning all three levels; "Total" spans the Percent-of-all and Cumulative-percent columns; "Type of situations" spans the remaining 18 columns (CA, CB, CC, CD, CE, CG, CP, CA–CB combinations, Other C combinations, each with a "Number of situations" and a "Percent by size class" column). En dashes are used in "4,000–4,999", "5,000–9,999" and "CA–CB combinations" as printed. Footnote marker 2 is not referenced anywhere on this crop (its anchor is on the preceding page), but footnote 2 is printed under the table here, so both footnotes are included. All digit values are crisp and unambiguous; no illegible or doubtful numeric cells.
Source image
Source data: U.S. NLRB Annual Reports (public domain). Reconstruction by NLRB Stats Archive. Read by claude-opus-5 (effort max, prompt extract_v1) from the 300-dpi scan; stitched by page. Updated October 2026.