NLRB Stats Archive › Annual Reports › FY1984 › Final outcome of representation elections in RC cases closed
Final outcome of representation elections in RC cases closed
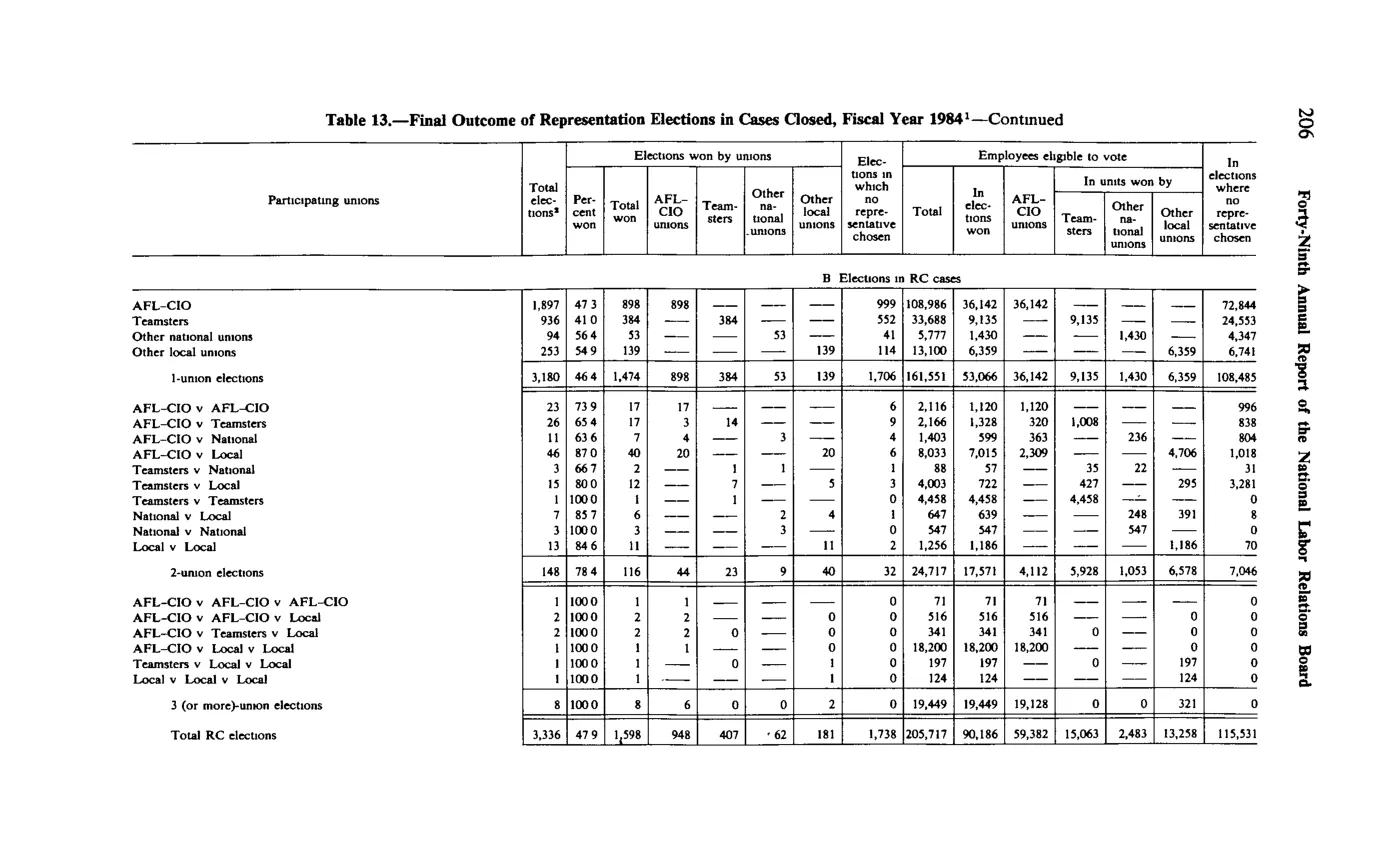
| Participating unions | Total elections | Percent won | Elections won by unions Total won | Elections won by unions AFL-CIO unions | Elections won by unions Teamsters | Elections won by unions Other national unions | Elections won by unions Other local unions | Elections in which no representative chosen | Employees eligible to vote Total | Employees eligible to vote In units won by AFL-CIO unions | Employees eligible to vote In units won by Teamsters | Employees eligible to vote In units won by Other national unions | Employees eligible to vote In units won by Other local unions | Employees eligible to vote In elections where no representative chosen | |
|---|---|---|---|---|---|---|---|---|---|---|---|---|---|---|---|
| AFL-CIO (1-union RC) | 1,897 | 47.3 | 898 | 898 | 999 | 108,986 | 36,142 | 72,844 | |||||||
| Teamsters (1-union RC) | 936 | 41 | 384 | 384 | 552 | 33,688 | 9,135 | 24,553 | |||||||
| Other national unions (1-union RC) | 94 | 56.4 | 53 | 53 | 41 | 5,777 | 1,430 | 4,347 | |||||||
| Other local unions (1-union RC) | 253 | 54.9 | 139 | 139 | 114 | 13,100 | 6,359 | 6,741 | |||||||
| 1-union RC elections — subtotal | 3,180 | 46.4 | 1,474 | 898 | 384 | 53 | 139 | 1,706 | 161,551 | 53,066 | 36,142 | 9,135 | 1,430 | 6,359 | 108,485 |
| 2-union RC elections — subtotal | 148 | 78.4 | 116 | 44 | 23 | 9 | 40 | 32 | 24,717 | 17,571 | 4,112 | 5,928 | 1,053 | 6,578 | 7,046 |
| 3 (or more)-union RC elections — total | 8 | 100 | 8 | 6 | 2 | 0 | 19,449 | 19,128 | 321 | 0 | |||||
| Total RC elections | 3,336 | 47.9 | 1,598 | 948 | 407 | 62 | 181 | 1,738 | 205,717 | 90,186 | 59,382 | 15,063 | 2,483 | 13,258 | 115,531 |
| 2-union RC |
Source image
Source data: U.S. NLRB Annual Reports (public domain). Reconstruction by NLRB Stats Archive. Updated June 2026.