NLRB Stats Archive › Annual Reports › FY1984 › Standard Federal Administrative Regional Distribution of Cases Received, Fiscal Year 1984
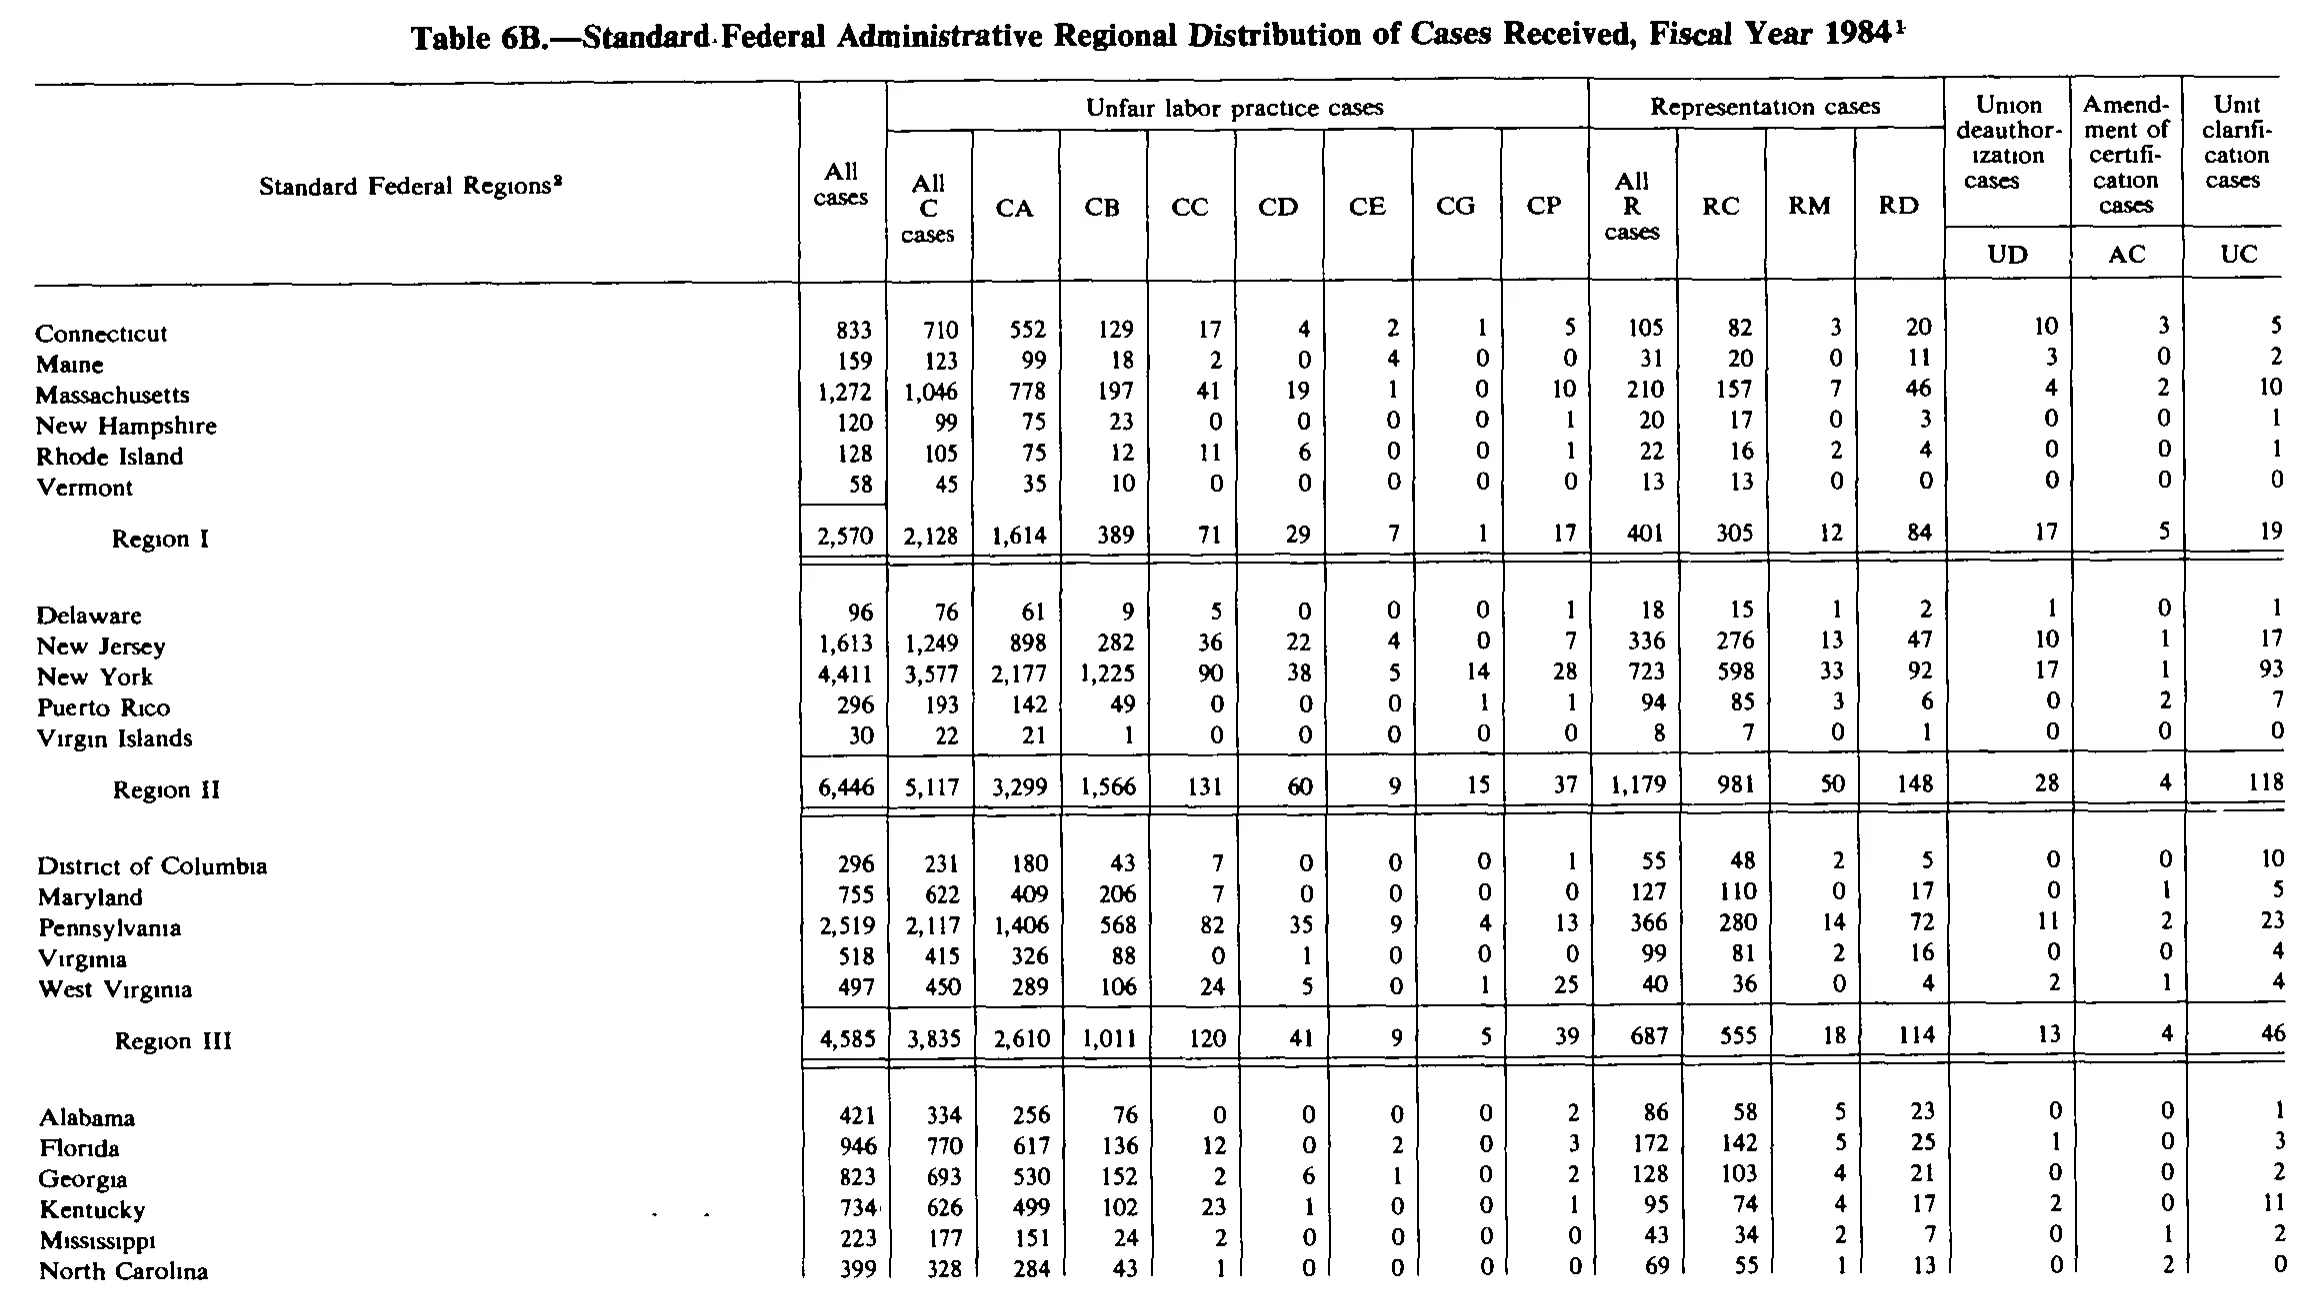
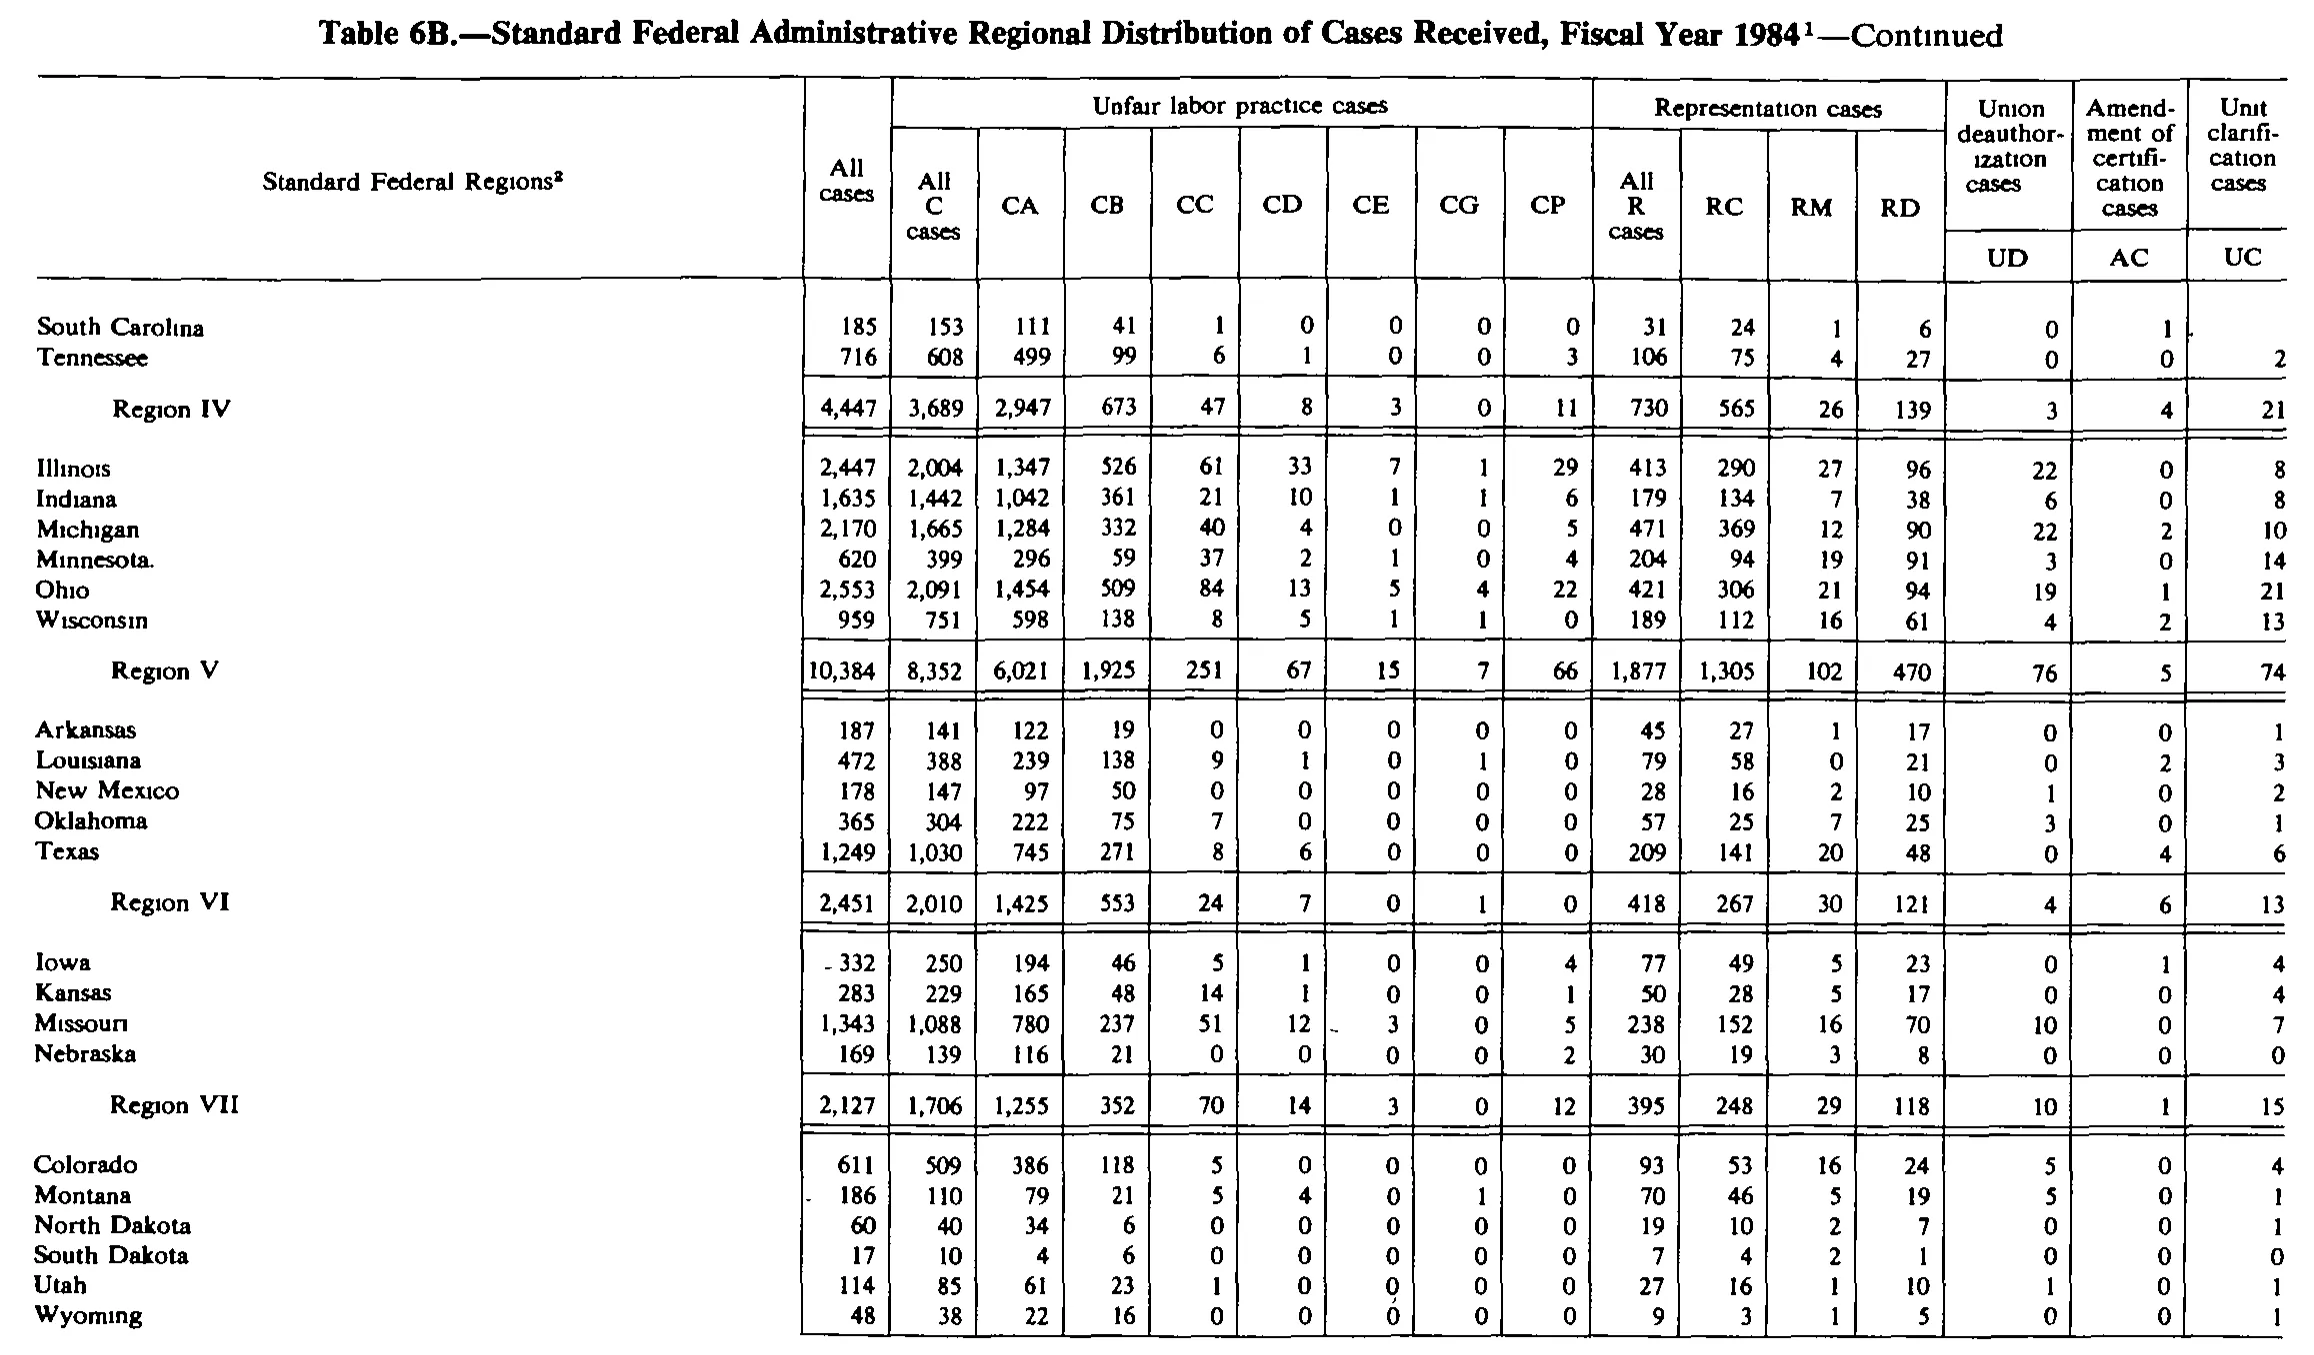
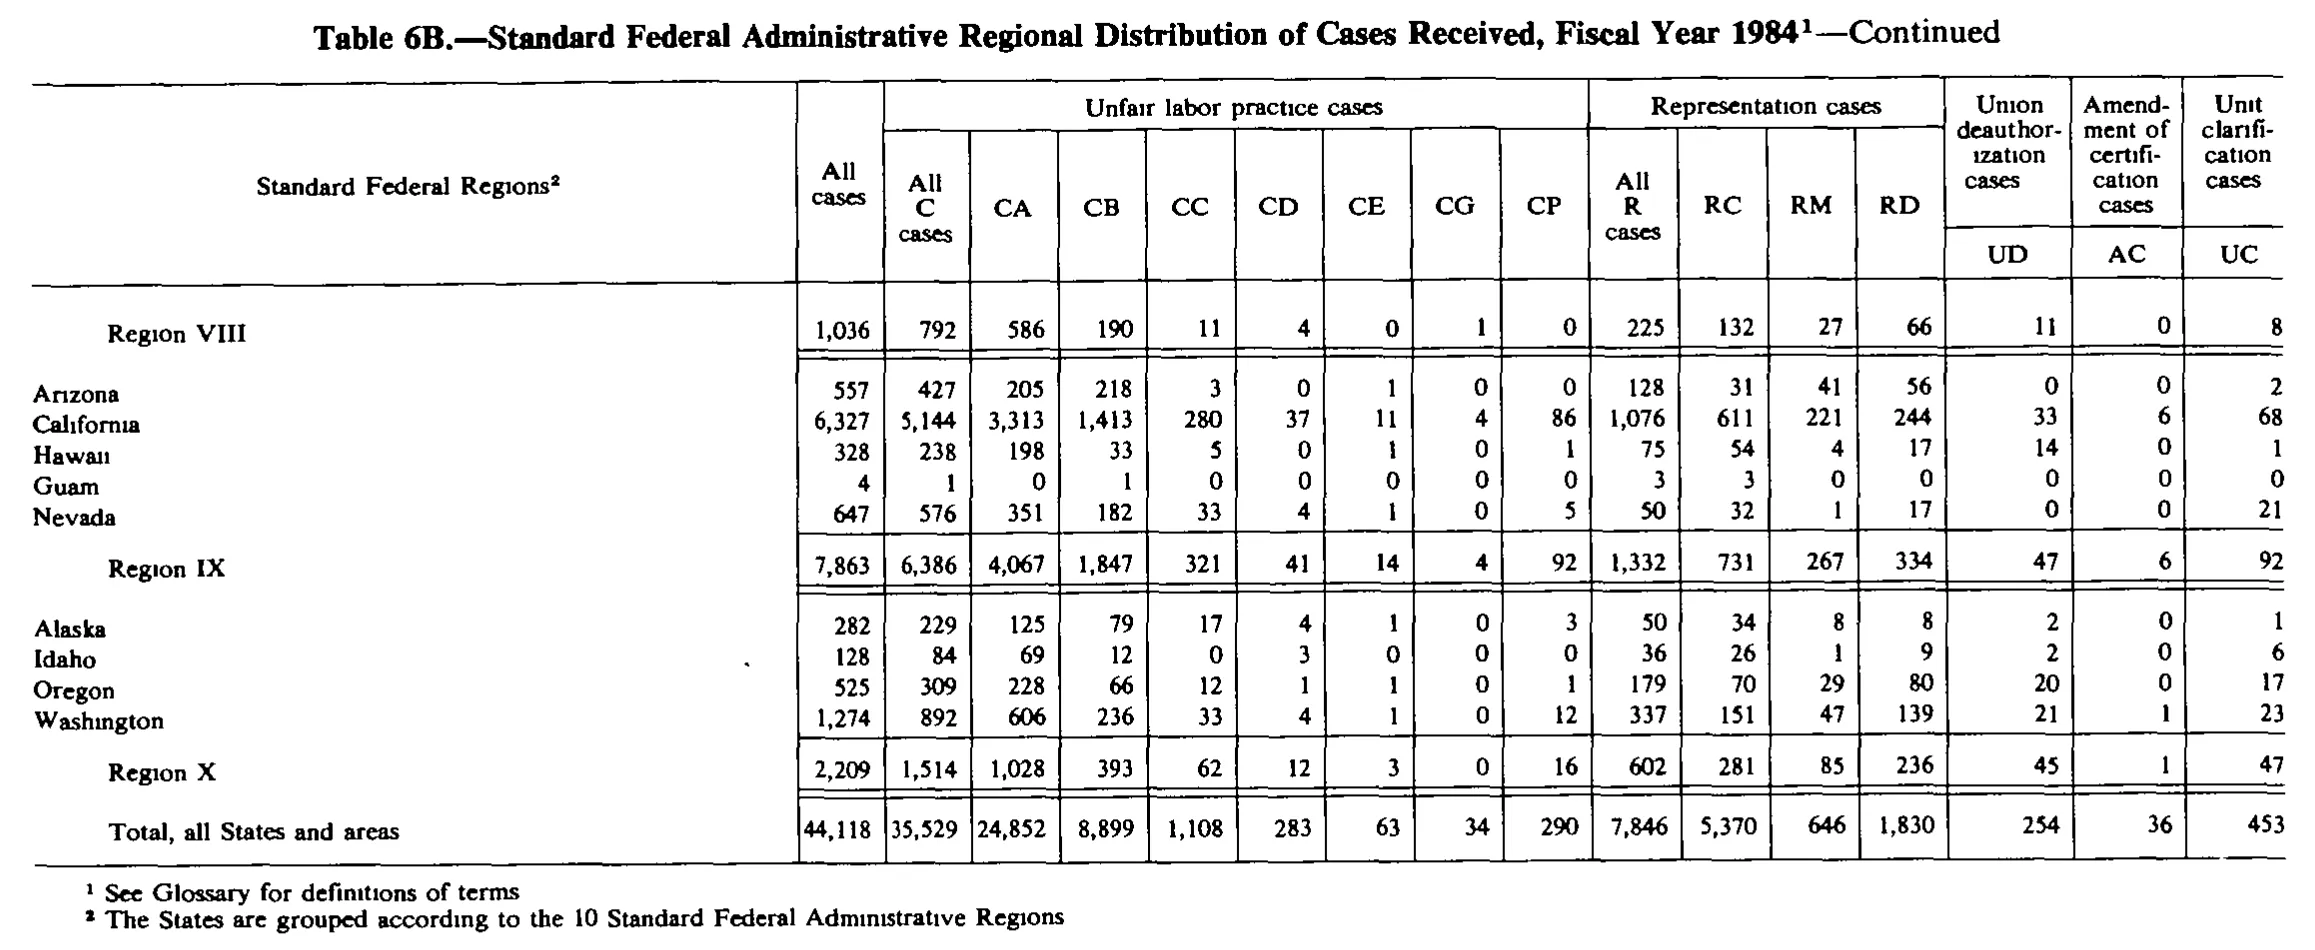
Standard Federal Administrative Regional Distribution of Cases Received, Fiscal Year 1984
Stitched from pp. 202–204.
| Standard Federal Regions | All cases | Unfair labor practice cases | Representation cases | Union deauthorization cases | Amendment of certification cases | Unit clarification cases | ||||||||||
|---|---|---|---|---|---|---|---|---|---|---|---|---|---|---|---|---|
| Standard Federal Regions | All cases | All C cases | CA | CB | CC | CD | CE | CG | CP | All R cases | RC | RM | RD | Union deauthorization cases | Amendment of certification cases | Unit clarification cases |
| Standard Federal Regions | All cases | All C cases | CA | CB | CC | CD | CE | CG | CP | All R cases | RC | RM | RD | UD | AC | UC |
| Connecticut | 833 | 710 | 552 | 129 | 17 | 4 | 2 | 1 | 5 | 105 | 82 | 3 | 20 | 10 | 3 | 5 |
| Maine | 159 | 123 | 99 | 18 | 2 | 0 | 4 | 0 | 0 | 31 | 20 | 0 | 11 | 3 | 0 | 2 |
| Massachusetts | 1,272 | 1,046 | 778 | 197 | 41 | 19 | 1 | 0 | 10 | 210 | 157 | 7 | 46 | 4 | 2 | 10 |
| New Hampshire | 120 | 99 | 75 | 23 | 0 | 0 | 0 | 0 | 1 | 20 | 17 | 0 | 3 | 0 | 0 | 1 |
| Rhode Island | 128 | 105 | 75 | 12 | 11 | 6 | 0 | 0 | 1 | 22 | 16 | 2 | 4 | 0 | 0 | 1 |
| Vermont | 58 | 45 | 35 | 10 | 0 | 0 | 0 | 0 | 0 | 13 | 13 | 0 | 0 | 0 | 0 | 0 |
| Region I | 2,570 | 2,128 | 1,614 | 389 | 71 | 29 | 7 | 1 | 17 | 401 | 305 | 12 | 84 | 17 | 5 | 19 |
| Delaware | 96 | 76 | 61 | 9 | 5 | 0 | 0 | 0 | 1 | 18 | 15 | 1 | 2 | 1 | 0 | 1 |
| New Jersey | 1,613 | 1,249 | 898 | 282 | 36 | 22 | 4 | 0 | 7 | 336 | 276 | 13 | 47 | 10 | 1 | 17 |
| New York | 4,411 | 3,577 | 2,177 | 1,225 | 90 | 38 | 5 | 14 | 28 | 723 | 598 | 33 | 92 | 17 | 1 | 93 |
| Puerto Rico | 296 | 193 | 142 | 49 | 0 | 0 | 0 | 1 | 1 | 94 | 85 | 3 | 6 | 0 | 2 | 7 |
| Virgin Islands | 30 | 22 | 21 | 1 | 0 | 0 | 0 | 0 | 0 | 8 | 7 | 0 | 1 | 0 | 0 | 0 |
| Region II | 6,446 | 5,117 | 3,299 | 1,566 | 131 | 60 | 9 | 15 | 37 | 1,179 | 981 | 50 | 148 | 28 | 4 | 118 |
| District of Columbia | 296 | 231 | 180 | 43 | 7 | 0 | 0 | 0 | 1 | 55 | 48 | 2 | 5 | 0 | 0 | 10 |
| Maryland | 755 | 622 | 409 | 206 | 7 | 0 | 0 | 0 | 0 | 127 | 110 | 0 | 17 | 0 | 1 | 5 |
| Pennsylvania | 2,519 | 2,117 | 1,406 | 568 | 82 | 35 | 9 | 4 | 13 | 366 | 280 | 14 | 72 | 11 | 2 | 23 |
| Virginia | 518 | 415 | 326 | 88 | 0 | 1 | 0 | 0 | 0 | 99 | 81 | 2 | 16 | 0 | 0 | 4 |
| West Virginia | 497 | 450 | 289 | 106 | 24 | 5 | 0 | 1 | 25 | 40 | 36 | 0 | 4 | 2 | 1 | 4 |
| Region III | 4,585 | 3,835 | 2,610 | 1,011 | 120 | 41 | 9 | 5 | 39 | 687 | 555 | 18 | 114 | 13 | 4 | 46 |
| Alabama | 421 | 334 | 256 | 76 | 0 | 0 | 0 | 0 | 2 | 86 | 58 | 5 | 23 | 0 | 0 | 1 |
| Florida | 946 | 770 | 617 | 136 | 12 | 0 | 2 | 0 | 3 | 172 | 142 | 5 | 25 | 1 | 0 | 3 |
| Georgia | 823 | 693 | 530 | 152 | 2 | 6 | 1 | 0 | 2 | 128 | 103 | 4 | 21 | 0 | 0 | 2 |
| Kentucky | 734 | 626 | 499 | 102 | 23 | 1 | 0 | 0 | 1 | 95 | 74 | 4 | 17 | 2 | 0 | 11 |
| Mississippi | 223 | 177 | 151 | 24 | 2 | 0 | 0 | 0 | 0 | 43 | 34 | 1 | 7 | 0 | 1 | 2 |
| North Carolina | 399 | 328 | 284 | 43 | 1 | 0 | 0 | 0 | 0 | 69 | 55 | 1 | 13 | 0 | 2 | 0 |
| South Carolina | 185 | 153 | 111 | 41 | 1 | 0 | 0 | 0 | 0 | 31 | 24 | 1 | 6 | 0 | 1 | |
| Tennessee | 716 | 608 | 499 | 99 | 6 | 1 | 0 | 0 | 3 | 106 | 75 | 4 | 27 | 0 | 0 | 2 |
| Region IV | 4,447 | 3,689 | 2,947 | 673 | 47 | 8 | 3 | 0 | 11 | 730 | 565 | 26 | 139 | 3 | 4 | 21 |
| Illinois | 2,447 | 2,004 | 1,347 | 526 | 61 | 33 | 7 | 1 | 29 | 413 | 290 | 27 | 96 | 22 | 0 | 8 |
| Indiana | 1,635 | 1,442 | 1,042 | 361 | 21 | 10 | 1 | 1 | 6 | 179 | 134 | 7 | 38 | 6 | 0 | 8 |
| Michigan | 2,170 | 1,665 | 1,284 | 332 | 40 | 4 | 0 | 0 | 5 | 471 | 369 | 12 | 90 | 22 | 2 | 10 |
| Minnesota | 620 | 399 | 296 | 59 | 37 | 2 | 1 | 0 | 4 | 204 | 94 | 19 | 91 | 3 | 0 | 14 |
| Ohio | 2,553 | 2,091 | 1,454 | 509 | 84 | 13 | 5 | 4 | 22 | 421 | 306 | 21 | 94 | 19 | 1 | 21 |
| Wisconsin | 959 | 751 | 598 | 138 | 8 | 5 | 1 | 1 | 0 | 189 | 112 | 16 | 61 | 4 | 2 | 13 |
| Region V | 10,384 | 8,352 | 6,021 | 1,925 | 251 | 67 | 15 | 7 | 66 | 1,877 | 1,305 | 102 | 470 | 76 | 5 | 74 |
| Arkansas | 187 | 141 | 122 | 19 | 0 | 0 | 0 | 0 | 0 | 45 | 27 | 1 | 17 | 0 | 0 | 1 |
| Louisiana | 472 | 388 | 239 | 138 | 9 | 1 | 0 | 1 | 0 | 79 | 58 | 0 | 21 | 0 | 2 | 3 |
| New Mexico | 178 | 147 | 97 | 50 | 0 | 0 | 0 | 0 | 0 | 28 | 16 | 2 | 10 | 1 | 0 | 2 |
| Oklahoma | 365 | 304 | 222 | 75 | 7 | 0 | 0 | 0 | 0 | 57 | 25 | 7 | 25 | 3 | 0 | 1 |
| Texas | 1,249 | 1,030 | 745 | 271 | 8 | 6 | 0 | 0 | 0 | 209 | 141 | 20 | 48 | 0 | 4 | 6 |
| Region VI | 2,451 | 2,010 | 1,425 | 553 | 24 | 7 | 0 | 1 | 0 | 418 | 267 | 30 | 121 | 4 | 6 | 13 |
| Iowa | 332 | 250 | 194 | 46 | 5 | 1 | 0 | 0 | 4 | 77 | 49 | 5 | 23 | 0 | 1 | 4 |
| Kansas | 283 | 229 | 165 | 48 | 14 | 1 | 0 | 0 | 1 | 50 | 28 | 5 | 17 | 0 | 0 | 4 |
| Missouri | 1,343 | 1,088 | 780 | 237 | 51 | 12 | 3 | 0 | 5 | 238 | 152 | 16 | 70 | 10 | 0 | 7 |
| Nebraska | 169 | 139 | 116 | 21 | 0 | 0 | 0 | 0 | 2 | 30 | 19 | 3 | 8 | 0 | 0 | 0 |
| Region VII | 2,127 | 1,706 | 1,255 | 352 | 70 | 14 | 3 | 0 | 12 | 395 | 248 | 29 | 118 | 10 | 1 | 15 |
| Colorado | 611 | 509 | 386 | 118 | 5 | 0 | 0 | 0 | 0 | 93 | 53 | 16 | 24 | 5 | 0 | 4 |
| Montana | 186 | 110 | 79 | 21 | 5 | 4 | 0 | 1 | 0 | 70 | 46 | 5 | 19 | 5 | 0 | 1 |
| North Dakota | 60 | 40 | 34 | 6 | 0 | 0 | 0 | 0 | 0 | 19 | 10 | 2 | 7 | 0 | 0 | 1 |
| South Dakota | 17 | 10 | 4 | 6 | 0 | 0 | 0 | 0 | 0 | 7 | 4 | 2 | 1 | 0 | 0 | 0 |
| Utah | 114 | 85 | 61 | 23 | 1 | 0 | 0 | 0 | 0 | 27 | 16 | 1 | 10 | 1 | 0 | 1 |
| Wyoming | 48 | 38 | 22 | 16 | 0 | 0 | 0 | 0 | 0 | 9 | 3 | 1 | 5 | 0 | 0 | 1 |
| Region VIII | 1,036 | 792 | 586 | 190 | 11 | 4 | 0 | 1 | 0 | 225 | 132 | 27 | 66 | 11 | 0 | 8 |
| Arizona | 557 | 427 | 205 | 218 | 3 | 0 | 1 | 0 | 0 | 128 | 31 | 41 | 56 | 0 | 0 | 2 |
| California | 6,327 | 5,144 | 3,313 | 1,413 | 280 | 37 | 11 | 4 | 86 | 1,076 | 611 | 221 | 244 | 33 | 6 | 68 |
| Hawaii | 328 | 238 | 198 | 33 | 5 | 0 | 1 | 0 | 1 | 75 | 54 | 4 | 17 | 14 | 0 | 1 |
| Guam | 4 | 1 | 0 | 1 | 0 | 0 | 0 | 0 | 0 | 3 | 3 | 0 | 0 | 0 | 0 | 0 |
| Nevada | 647 | 576 | 351 | 182 | 33 | 4 | 1 | 0 | 5 | 50 | 32 | 1 | 17 | 0 | 0 | 21 |
| Region IX | 7,863 | 6,386 | 4,067 | 1,847 | 321 | 41 | 14 | 4 | 92 | 1,332 | 731 | 267 | 334 | 47 | 6 | 92 |
| Alaska | 282 | 229 | 125 | 79 | 17 | 4 | 1 | 0 | 3 | 50 | 34 | 8 | 8 | 2 | 0 | 1 |
| Idaho | 128 | 84 | 69 | 12 | 0 | 3 | 0 | 0 | 0 | 36 | 26 | 1 | 9 | 2 | 0 | 6 |
| Oregon | 525 | 309 | 228 | 66 | 12 | 1 | 1 | 0 | 1 | 179 | 70 | 29 | 80 | 20 | 0 | 17 |
| Washington | 1,274 | 892 | 606 | 236 | 33 | 4 | 1 | 0 | 12 | 337 | 151 | 47 | 139 | 21 | 1 | 23 |
| Region X | 2,209 | 1,514 | 1,028 | 393 | 62 | 12 | 3 | 0 | 16 | 602 | 281 | 85 | 236 | 45 | 1 | 47 |
| Total, all States and areas | 44,118 | 35,529 | 24,852 | 8,899 | 1,108 | 283 | 63 | 34 | 290 | 7,846 | 5,370 | 646 | 1,830 | 254 | 36 | 453 |
- 1 See Glossary for definitions of terms
- 2 The States are grouped according to the 10 Standard Federal Administrative Regions
815 of 816 figures sit in a row or column sum that works out. 2 cells break a sum: 'Mississippi', column 11: prints 43, columns 12 to 14 add to 42; 'Region IV', column 13: prints 26, rows 'Alabama' to 'Tennessee' add to 25.
Reader’s notes
p. 202. The crop is cut off at the bottom: the table continues past "North Carolina" (the Region IV block is incomplete and later regions are absent), and no footnote text is visible on this image even though footnote markers 1 (caption) and 2 (stub heading "Standard Federal Regions") are printed. The last body line (North Carolina) sits right on the bottom edge and its digits are slightly clipped; I read them as 399, 328, 284, 43, 1, 0, 0, 0, 0, 69, 55, 1, 13, 0, 2, 0. The final UC cell is the faintest character on the page, but it is a printed 0 (visible at the right-hand edge), not a blank. Column structure: 17 columns. "All cases" is a tall single heading spanning all three heading levels; "Union deauthorization cases", "Amendment of certification cases" and "Unit clarification cases" are tall headings printed over the third-level codes UD, AC and UC respectively, so they are repeated across the levels they span. The headings "All C cases" and "All R cases" are printed on three stacked lines in the original and have been joined. Scanning artifacts only, not transcription doubts: the OCR-era scan renders some dotted i's oddly (e.g. "Maine", "Virginia", "Mississippi") and there are two stray ink specks in the empty stub area beside the Kentucky row; neither affects any value. Every row's internal arithmetic is consistent as printed (C subtypes sum to "All C cases", R subtypes to "All R cases", and All C + All R + UD + AC + UC equals "All cases"), and the three region totals shown agree with their state rows. No suspected misprints.
p. 203. This is a continuation page: the body opens mid-Region IV (South Carolina and Tennessee are the last states of that region; the region's earlier states are on the preceding page), and the table is cut off at the bottom after Wyoming, so the Region VIII total and any later regions/national total are not on this crop. No footnote text is printed on this crop, although footnote markers appear in the caption ("1984^1", caption excluded) and in the stub heading ("Standard Federal Regions^2"). Column structure: 17 columns (stub + 16). The three right-hand columns carry a tall two-line heading ("Union deauthorization cases", "Amendment of certification cases", "Unit clarification cases") over a third-level code line (UD, AC, UC); every other heading spans down to the third level, so those headings are repeated in all three header rows. Doubtful cells: - South Carolina, UC column: no digit is printed; only a faint speck sits in the cell. Left as "". Arithmetic supports a blank/zero (153 + 31 + 0 + 1 = 185 = All cases). - Iowa, All cases, and Montana, All cases: a short stray dash-like mark is printed to the left of the figure ("- 332", "- 186"). Treated as stray ink/leader residue, not a minus sign; values transcribed as 332 and 186, which cross-foot correctly. - Minnesota's stub label is printed with a trailing period ("Minnesota."), read as a leader dot and dropped. - Scattered small specks sit beside Missouri CD (12), Nebraska CC (0), Utah CE (0) and Wyoming CE (0); read as print noise, not digits or markers. - Utah, UC column: the glyph is faint; read as 1, which is the only value consistent with the row (85 + 27 + 1 + 0 + 1 = 114). Arithmetic check (reported, not applied): every row and every column in this crop cross-foots exactly. Region V, Region VI and Region VII totals each equal the sum of their listed states in all 16 numeric columns, and within every data row CA+CB+CC+CD+CE+CG+CP = All C cases, RC+RM+RD = All R cases, and All C + All R + UD + AC + UC = All cases. No misprints detected. Nothing was computed into the grid; all values are as printed.
p. 204. This is the final page of a continued table; the first body row, "Region VIII", is the subtotal line for that region, whose member-State rows appear on the preceding page and are therefore not in this crop. The Region IX and Region X subtotals are each preceded by their own State rows here. Column structure: 17 columns — stub, "All cases", eight unfair-labor-practice columns (All C cases, CA, CB, CC, CD, CE, CG, CP), four representation columns (All R cases, RC, RM, RD), and three single columns (UD, AC, UC). The three rightmost headings span the top two heading levels, with the code letters (UD, AC, UC) printed on a third level; "All cases" spans the top two levels as well. All values are legible. Every arithmetic check passes as transcribed: each State row's All C equals CA+CB+CC+CD+CE+CG+CP and its All cases equals All C + All R + UD + AC + UC; the Region IX and Region X subtotals equal the sums of their listed States in all 16 numeric columns; and the Total row is internally consistent (24,852+8,899+1,108+283+63+34+290 = 35,529; 5,370+646+1,830 = 7,846; 35,529+7,846+254+36+453 = 44,118). No misprints detected. The scan renders the dot of "i" faintly in some State names ("Arizona", "California", "Hawaii", "Washington", "Region VIII"); the spellings given are the standard ones and are not in doubt. A stray ink speck sits in the blank stub area beside the "Idaho"/"Oregon" rows; it is not a character and has been ignored.
Source image
Source data: U.S. NLRB Annual Reports (public domain). Reconstruction by NLRB Stats Archive. Read by claude-opus-5 (effort max, prompt extract_v1) from the 300-dpi scan; stitched by page. Updated October 2026.