NLRB Stats Archive › Annual Reports › FY1983 › Proceedings Decided by Circuit Courts of Appeals on Petitions for Enforcement and/or Review of Board Orders, Fiscal Year 1983, Compared With 5-Year Cumulative Totals, Fiscal Years 1978 Through 1982
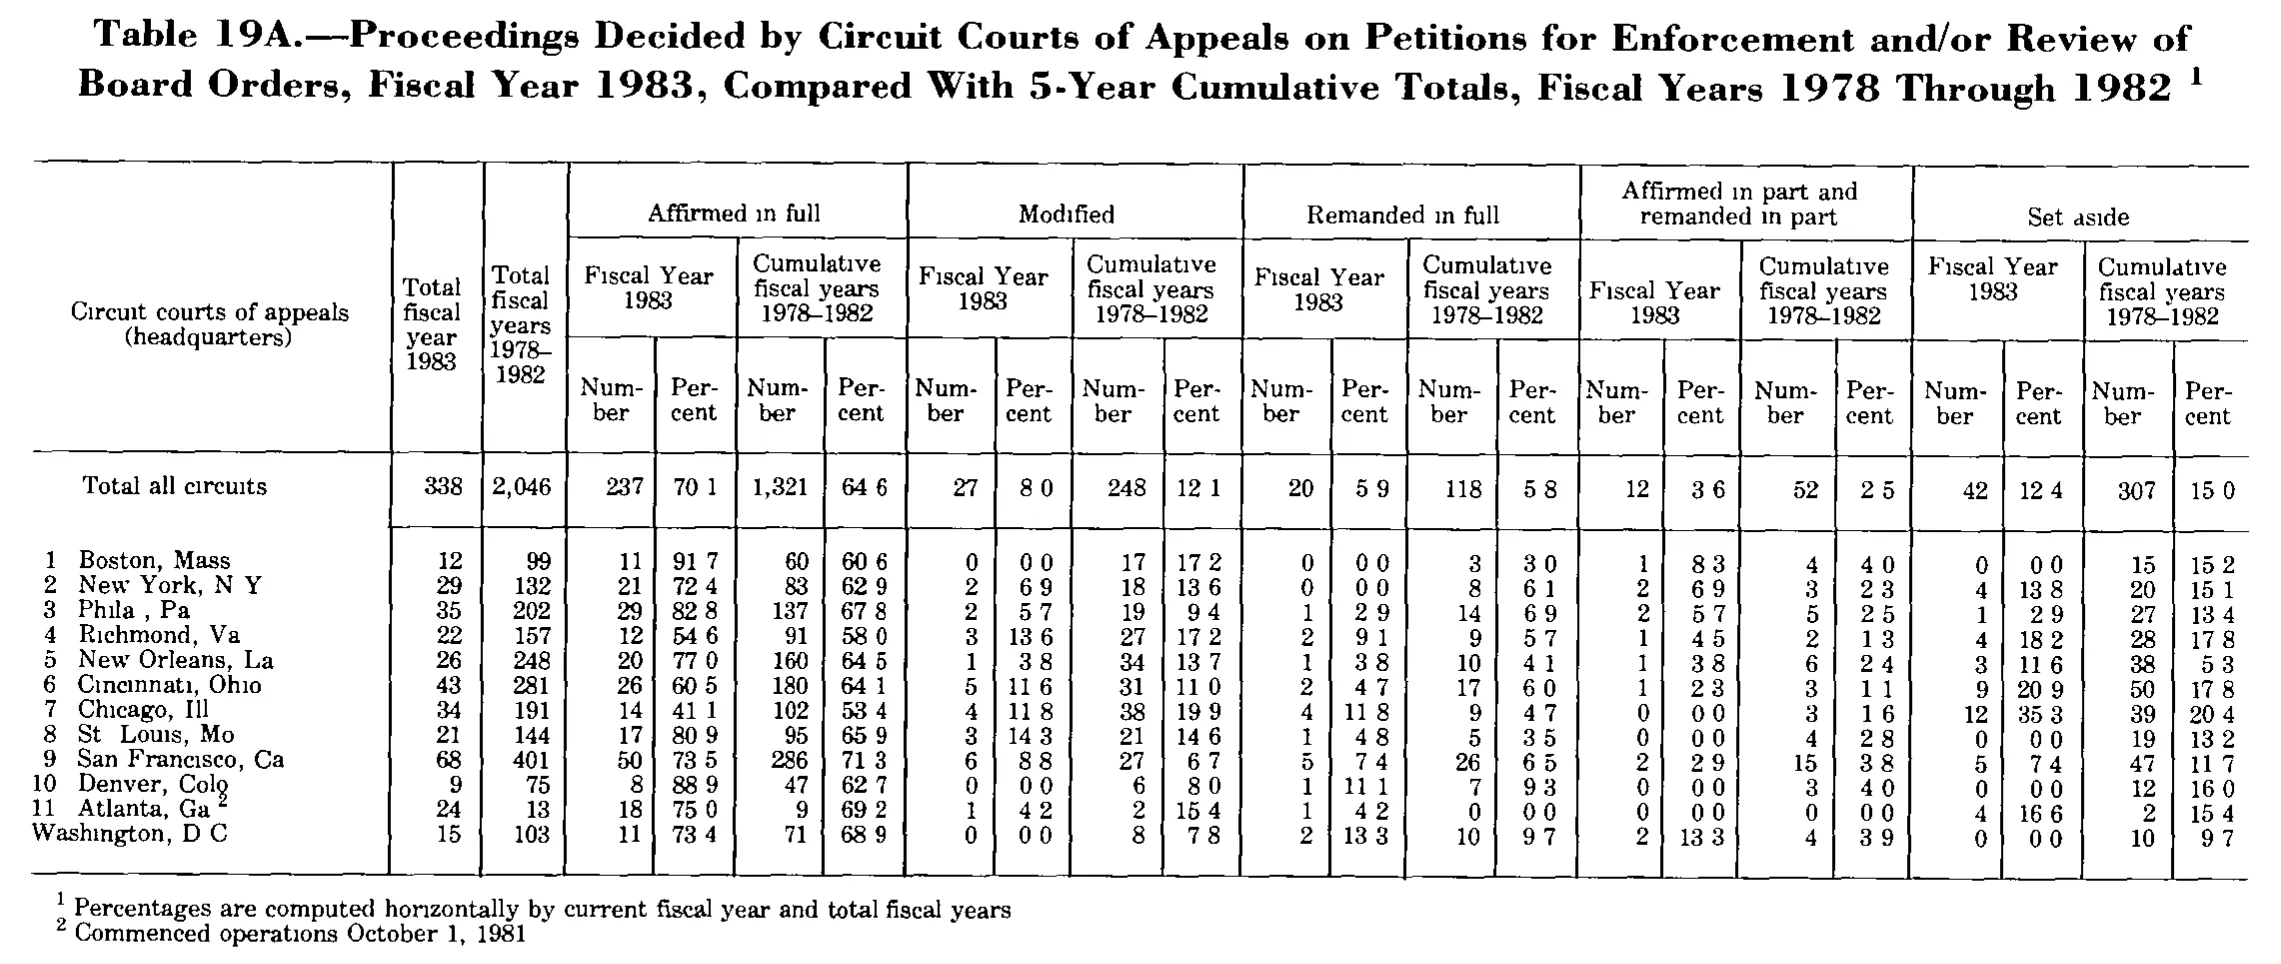
Proceedings Decided by Circuit Courts of Appeals on Petitions for Enforcement and/or Review of Board Orders, Fiscal Year 1983, Compared With 5-Year Cumulative Totals, Fiscal Years 1978 Through 1982
| Circuit courts of appeals (headquarters) | Total fiscal year 1983 | Total fiscal years 1978–1982 | Affirmed in full | Modified | Remanded in full | Affirmed in part and remanded in part | Set aside | |||||||||||||||
|---|---|---|---|---|---|---|---|---|---|---|---|---|---|---|---|---|---|---|---|---|---|---|
| Circuit courts of appeals (headquarters) | Total fiscal year 1983 | Total fiscal years 1978–1982 | Fiscal Year 1983 | Cumulative fiscal years 1978–1982 | Fiscal Year 1983 | Cumulative fiscal years 1978–1982 | Fiscal Year 1983 | Cumulative fiscal years 1978–1982 | Fiscal Year 1983 | Cumulative fiscal years 1978–1982 | Fiscal Year 1983 | Cumulative fiscal years 1978–1982 | ||||||||||
| Circuit courts of appeals (headquarters) | Total fiscal year 1983 | Total fiscal years 1978–1982 | Number | Percent | Number | Percent | Number | Percent | Number | Percent | Number | Percent | Number | Percent | Number | Percent | Number | Percent | Number | Percent | Number | Percent |
| Total all circuits | 338 | 2,046 | 237 | 70.1 | 1,321 | 64.6 | 27 | 8.0 | 248 | 12.1 | 20 | 5.9 | 118 | 5.8 | 12 | 3.6 | 52 | 2.5 | 42 | 12.4 | 307 | 15.0 |
| 1 Boston, Mass. | 12 | 99 | 11 | 91.7 | 60 | 60.6 | 0 | 0.0 | 17 | 17.2 | 0 | 0.0 | 3 | 3.0 | 1 | 8.3 | 4 | 4.0 | 0 | 0.0 | 15 | 15.2 |
| 2 New York, N.Y. | 29 | 132 | 21 | 72.4 | 83 | 62.9 | 2 | 6.9 | 18 | 13.6 | 0 | 0.0 | 8 | 6.1 | 2 | 6.9 | 3 | 2.3 | 4 | 13.8 | 20 | 15.1 |
| 3 Phila., Pa. | 35 | 202 | 29 | 82.8 | 137 | 67.8 | 2 | 5.7 | 19 | 9.4 | 1 | 2.9 | 14 | 6.9 | 2 | 5.7 | 5 | 2.5 | 1 | 2.9 | 27 | 13.4 |
| 4 Richmond, Va. | 22 | 157 | 12 | 54.6 | 91 | 58.0 | 3 | 13.6 | 27 | 17.2 | 2 | 9.1 | 9 | 5.7 | 1 | 4.5 | 2 | 1.3 | 4 | 18.2 | 28 | 17.8 |
| 5 New Orleans, La. | 26 | 248 | 20 | 77.0 | 160 | 64.5 | 1 | 3.8 | 34 | 13.7 | 1 | 3.8 | 10 | 4.1 | 1 | 3.8 | 6 | 2.4 | 3 | 11.6 | 38 | 5.3 |
| 6 Cincinnati, Ohio | 43 | 281 | 26 | 60.5 | 180 | 64.1 | 5 | 11.6 | 31 | 11.0 | 2 | 4.7 | 17 | 6.0 | 1 | 2.3 | 3 | 1.1 | 9 | 20.9 | 50 | 17.8 |
| 7 Chicago, Ill. | 34 | 191 | 14 | 41.1 | 102 | 53.4 | 4 | 11.8 | 38 | 19.9 | 4 | 11.8 | 9 | 4.7 | 0 | 0.0 | 3 | 1.6 | 12 | 35.3 | 39 | 20.4 |
| 8 St. Louis, Mo. | 21 | 144 | 17 | 80.9 | 95 | 65.9 | 3 | 14.3 | 21 | 14.6 | 1 | 4.8 | 5 | 3.5 | 0 | 0.0 | 4 | 2.8 | 0 | 0.0 | 19 | 13.2 |
| 9 San Francisco, Ca. | 68 | 401 | 50 | 73.5 | 286 | 71.3 | 6 | 8.8 | 27 | 6.7 | 5 | 7.4 | 26 | 6.5 | 2 | 2.9 | 15 | 3.8 | 5 | 7.4 | 47 | 11.7 |
| 10 Denver, Colo. | 9 | 75 | 8 | 88.9 | 47 | 62.7 | 0 | 0.0 | 6 | 8.0 | 1 | 11.1 | 7 | 9.3 | 0 | 0.0 | 3 | 4.0 | 0 | 0.0 | 12 | 16.0 |
| 11 Atlanta, Ga. | 24 | 13 | 18 | 75.0 | 9 | 69.2 | 1 | 4.2 | 2 | 15.4 | 1 | 4.2 | 0 | 0.0 | 0 | 0.0 | 0 | 0.0 | 4 | 16.6 | 2 | 15.4 |
| Washington, D.C. | 15 | 103 | 11 | 73.4 | 71 | 68.9 | 0 | 0.0 | 8 | 7.8 | 2 | 13.3 | 10 | 9.7 | 2 | 13.3 | 4 | 3.9 | 0 | 0.0 | 10 | 9.7 |
- 1 Percentages are computed horizontally by current fiscal year and total fiscal years.
- 2 Commenced operations October 1, 1981.
141 of 141 figures sit in a row or column sum that works out.
Reader’s notes
p. 232. 23 columns: stub, two "Total" columns, then five outcome groups of four columns each (Number/Percent for Fiscal Year 1983 and for Cumulative fiscal years 1978-1982). Period glyphs are systematically lost in this scan: decimal points in the Percent columns print as blank space ("70 1", "64 6") and the periods in abbreviations are missing ("Phila , Pa", "St Louis", "N Y", "D C"). I restored them, since the values are unambiguously decimals (e.g. 237/338 = 70.1) and the abbreviations are standard. Commas and other punctuation render normally, so only periods were affected. Doubtful cell: row "5 New Orleans, La.", Set aside / Cumulative fiscal years 1978-1982 / Percent reads "5 3" (transcribed 5.3). The arithmetic gives 38/248 = 15.3, and every other cell in that column is two digits before the decimal; the leading "1" appears to be missing from the print or dropped by the scan. Transcribed as printed, not corrected. All column sums were checked against the "Total all circuits" row and all twelve circuit rows against their own totals; everything reconciles exactly. A few percentages are printed one tenth off the computed value and are left as printed: Richmond affirmed-in-full FY1983 54.6 (12/22 = 54.5), Chicago affirmed-in-full FY1983 41.1 (14/34 = 41.2), New York set-aside cumulative 15.1 (20/132 = 15.2), Atlanta set-aside FY1983 16.6 (4/24 = 16.7), Washington affirmed-in-full FY1983 73.4 (11/15 = 73.3). The circuit numbers 1 through 11 are printed in the stub ahead of each city and are kept as part of the row label; they sit in the same stub box with no column rule between. The last row, Washington, D.C., carries no circuit number and is printed flush left. Footnote marker 1 is attached to the table caption (excluded per instructions) and governs the percentage columns; marker 2 is the raised digit after "Atlanta, Ga." Footnotes are shown with a sentence-final period, restored on the same grounds as above; no period is visible in the scan.
Source image
Source data: U.S. NLRB Annual Reports (public domain). Reconstruction by NLRB Stats Archive. Read by claude-opus-5 (effort max, prompt extract_v1) from the 300-dpi scan; stitched by page. Updated October 2026.