NLRB Stats Archive › Annual Reports › FY1983 › Distribution of Unfair Labor Practice Situations Received, by Number of Employees in Establishments, Fiscal Year 1983
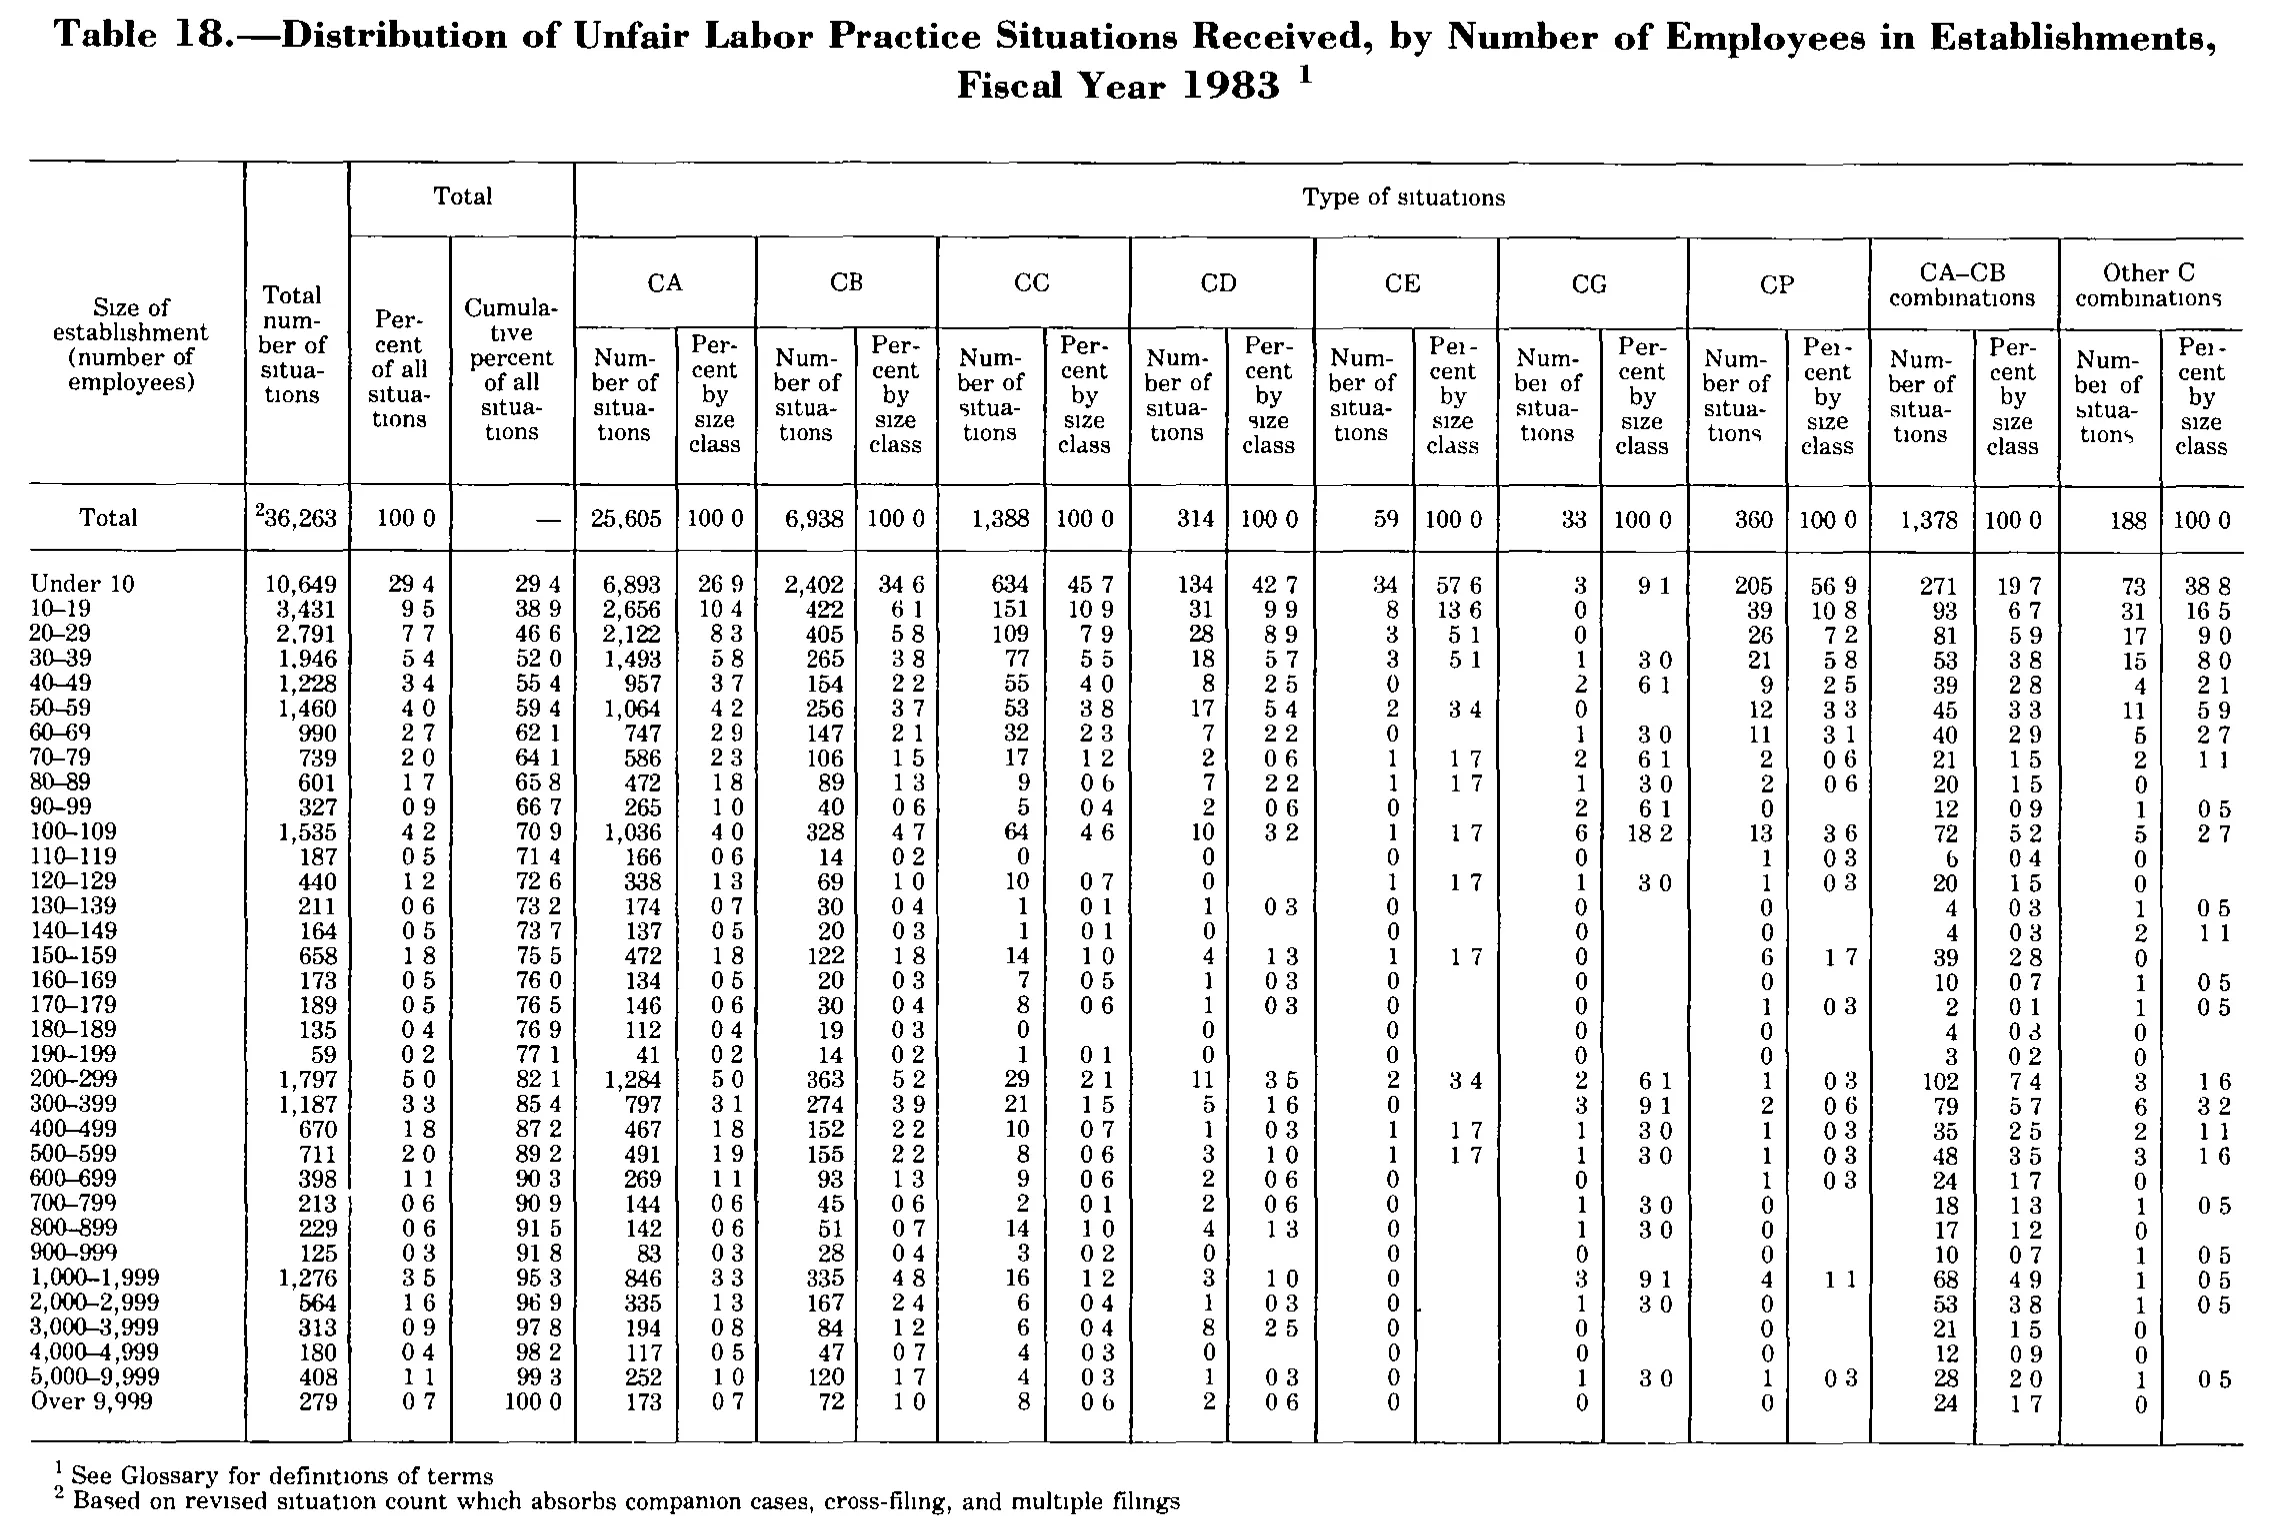
Distribution of Unfair Labor Practice Situations Received, by Number of Employees in Establishments, Fiscal Year 1983
| Size of establishment (number of employees) | Total number of situations | Total | Type of situations | ||||||||||||||||||
|---|---|---|---|---|---|---|---|---|---|---|---|---|---|---|---|---|---|---|---|---|---|
| Size of establishment (number of employees) | Total number of situations | Percent of all situations | Cumulative percent of all situations | CA | CB | CC | CD | CE | CG | CP | CA–CB combinations | Other C combinations | |||||||||
| Size of establishment (number of employees) | Total number of situations | Percent of all situations | Cumulative percent of all situations | Number of situations | Percent by size class | Number of situations | Percent by size class | Number of situations | Percent by size class | Number of situations | Percent by size class | Number of situations | Percent by size class | Number of situations | Percent by size class | Number of situations | Percent by size class | Number of situations | Percent by size class | Number of situations | Percent by size class |
| Total | 36,263 | 100.0 | 25,605 | 100.0 | 6,938 | 100.0 | 1,388 | 100.0 | 314 | 100.0 | 59 | 100.0 | 33 | 100.0 | 360 | 100.0 | 1,378 | 100.0 | 188 | 100.0 | |
| Under 10 | 10,649 | 29.4 | 29.4 | 6,893 | 26.9 | 2,402 | 34.6 | 634 | 45.7 | 134 | 42.7 | 34 | 57.6 | 3 | 9.1 | 205 | 56.9 | 271 | 19.7 | 73 | 38.8 |
| 10–19 | 3,431 | 9.5 | 38.9 | 2,656 | 10.4 | 422 | 6.1 | 151 | 10.9 | 31 | 9.9 | 8 | 13.6 | 0 | 39 | 10.8 | 93 | 6.7 | 31 | 16.5 | |
| 20–29 | 2,791 | 7.7 | 46.6 | 2,122 | 8.3 | 405 | 5.8 | 109 | 7.9 | 28 | 8.9 | 3 | 5.1 | 0 | 26 | 7.2 | 81 | 5.9 | 17 | 9.0 | |
| 30–39 | 1,946 | 5.4 | 52.0 | 1,493 | 5.8 | 265 | 3.8 | 77 | 5.5 | 18 | 5.7 | 3 | 5.1 | 1 | 3.0 | 21 | 5.8 | 53 | 3.8 | 15 | 8.0 |
| 40–49 | 1,228 | 3.4 | 55.4 | 957 | 3.7 | 154 | 2.2 | 55 | 4.0 | 8 | 2.5 | 0 | 2 | 6.1 | 9 | 2.5 | 39 | 2.8 | 4 | 2.1 | |
| 50–59 | 1,460 | 4.0 | 59.4 | 1,064 | 4.2 | 256 | 3.7 | 53 | 3.8 | 17 | 5.4 | 2 | 3.4 | 0 | 12 | 3.3 | 45 | 3.3 | 11 | 5.9 | |
| 60–69 | 990 | 2.7 | 62.1 | 747 | 2.9 | 147 | 2.1 | 32 | 2.3 | 7 | 2.2 | 0 | 1 | 3.0 | 11 | 3.1 | 40 | 2.9 | 5 | 2.7 | |
| 70–79 | 739 | 2.0 | 64.1 | 586 | 2.3 | 106 | 1.5 | 17 | 1.2 | 2 | 0.6 | 1 | 1.7 | 2 | 6.1 | 2 | 0.6 | 21 | 1.5 | 2 | 1.1 |
| 80–89 | 601 | 1.7 | 65.8 | 472 | 1.8 | 89 | 1.3 | 9 | 0.6 | 7 | 2.2 | 1 | 1.7 | 1 | 3.0 | 2 | 0.6 | 20 | 1.5 | 0 | |
| 90–99 | 327 | 0.9 | 66.7 | 265 | 1.0 | 40 | 0.6 | 5 | 0.4 | 2 | 0.6 | 0 | 2 | 6.1 | 0 | 12 | 0.9 | 1 | 0.5 | ||
| 100–109 | 1,535 | 4.2 | 70.9 | 1,036 | 4.0 | 328 | 4.7 | 64 | 4.6 | 10 | 3.2 | 1 | 1.7 | 6 | 18.2 | 13 | 3.6 | 72 | 5.2 | 5 | 2.7 |
| 110–119 | 187 | 0.5 | 71.4 | 166 | 0.6 | 14 | 0.2 | 0 | 0 | 0 | 0 | 1 | 0.3 | 6 | 0.4 | 0 | |||||
| 120–129 | 440 | 1.2 | 72.6 | 338 | 1.3 | 69 | 1.0 | 10 | 0.7 | 0 | 1 | 1.7 | 1 | 3.0 | 1 | 0.3 | 20 | 1.5 | 0 | ||
| 130–139 | 211 | 0.6 | 73.2 | 174 | 0.7 | 30 | 0.4 | 1 | 0.1 | 1 | 0.3 | 0 | 0 | 0 | 4 | 0.3 | 1 | 0.5 | |||
| 140–149 | 164 | 0.5 | 73.7 | 137 | 0.5 | 20 | 0.3 | 1 | 0.1 | 0 | 0 | 0 | 0 | 4 | 0.3 | 2 | 1.1 | ||||
| 150–159 | 658 | 1.8 | 75.5 | 472 | 1.8 | 122 | 1.8 | 14 | 1.0 | 4 | 1.3 | 1 | 1.7 | 0 | 6 | 1.7 | 39 | 2.8 | 0 | ||
| 160–169 | 173 | 0.5 | 76.0 | 134 | 0.5 | 20 | 0.3 | 7 | 0.5 | 1 | 0.3 | 0 | 0 | 0 | 10 | 0.7 | 1 | 0.5 | |||
| 170–179 | 189 | 0.5 | 76.5 | 146 | 0.6 | 30 | 0.4 | 8 | 0.6 | 1 | 0.3 | 0 | 0 | 1 | 0.3 | 2 | 0.1 | 1 | 0.5 | ||
| 180–189 | 135 | 0.4 | 76.9 | 112 | 0.4 | 19 | 0.3 | 0 | 0 | 0 | 0 | 0 | 4 | 0.3 | 0 | ||||||
| 190–199 | 59 | 0.2 | 77.1 | 41 | 0.2 | 14 | 0.2 | 1 | 0.1 | 0 | 0 | 0 | 0 | 3 | 0.2 | 0 | |||||
| 200–299 | 1,797 | 5.0 | 82.1 | 1,284 | 5.0 | 363 | 5.2 | 29 | 2.1 | 11 | 3.5 | 2 | 3.4 | 2 | 6.1 | 1 | 0.3 | 102 | 7.4 | 3 | 1.6 |
| 300–399 | 1,187 | 3.3 | 85.4 | 797 | 3.1 | 274 | 3.9 | 21 | 1.5 | 5 | 1.6 | 0 | 3 | 9.1 | 2 | 0.6 | 79 | 5.7 | 6 | 3.2 | |
| 400–499 | 670 | 1.8 | 87.2 | 467 | 1.8 | 152 | 2.2 | 10 | 0.7 | 1 | 0.3 | 1 | 1.7 | 1 | 3.0 | 1 | 0.3 | 35 | 2.5 | 2 | 1.1 |
| 500–599 | 711 | 2.0 | 89.2 | 491 | 1.9 | 155 | 2.2 | 8 | 0.6 | 3 | 1.0 | 1 | 1.7 | 1 | 3.0 | 1 | 0.3 | 48 | 3.5 | 3 | 1.6 |
| 600–699 | 398 | 1.1 | 90.3 | 269 | 1.1 | 93 | 1.3 | 9 | 0.6 | 2 | 0.6 | 0 | 0 | 1 | 0.3 | 24 | 1.7 | 0 | |||
| 700–799 | 213 | 0.6 | 90.9 | 144 | 0.6 | 45 | 0.6 | 2 | 0.1 | 2 | 0.6 | 0 | 1 | 3.0 | 0 | 18 | 1.3 | 1 | 0.5 | ||
| 800–899 | 229 | 0.6 | 91.5 | 142 | 0.6 | 51 | 0.7 | 14 | 1.0 | 4 | 1.3 | 0 | 1 | 3.0 | 0 | 17 | 1.2 | 0 | |||
| 900–999 | 125 | 0.3 | 91.8 | 83 | 0.3 | 28 | 0.4 | 3 | 0.2 | 0 | 0 | 0 | 0 | 10 | 0.7 | 1 | 0.5 | ||||
| 1,000–1,999 | 1,276 | 3.5 | 95.3 | 846 | 3.3 | 335 | 4.8 | 16 | 1.2 | 3 | 1.0 | 0 | 3 | 9.1 | 4 | 1.1 | 68 | 4.9 | 1 | 0.5 | |
| 2,000–2,999 | 564 | 1.6 | 96.9 | 335 | 1.3 | 167 | 2.4 | 6 | 0.4 | 1 | 0.3 | 0 | 1 | 3.0 | 0 | 53 | 3.8 | 1 | 0.5 | ||
| 3,000–3,999 | 313 | 0.9 | 97.8 | 194 | 0.8 | 84 | 1.2 | 6 | 0.4 | 8 | 2.5 | 0 | 0 | 0 | 21 | 1.5 | 0 | ||||
| 4,000–4,999 | 180 | 0.4 | 98.2 | 117 | 0.5 | 47 | 0.7 | 4 | 0.3 | 0 | 0 | 0 | 0 | 12 | 0.9 | 0 | |||||
| 5,000–9,999 | 408 | 1.1 | 99.3 | 252 | 1.0 | 120 | 1.7 | 4 | 0.3 | 1 | 0.3 | 0 | 1 | 3.0 | 1 | 0.3 | 28 | 2.0 | 1 | 0.5 | |
| Over 9,999 | 279 | 0.7 | 100.0 | 173 | 0.7 | 72 | 1.0 | 8 | 0.6 | 2 | 0.6 | 0 | 0 | 0 | 24 | 1.7 | 0 | ||||
- 1 See Glossary for definitions of terms.
- 2 Based on revised situation count which absorbs companion cases, cross-filing, and multiple filings.
280 of 280 figures sit in a row or column sum that works out.
Reader’s notes
p. 230. The scan resolves small round marks very weakly: dotted i's print as dotless (e.g. "situations" appears as "sıtuatıons") and decimal points in the percent columns appear as gaps ("100 0", "29 4"). These are decimal points in the original typesetting — every percent column is a one-decimal figure, the "Percent of all situations" column totals 100.0, and the cumulative column runs 29.4 ... 100.0 — so they are transcribed with decimal points. Terminal periods in the two footnotes are likewise faint and have been restored. Total row, "Cumulative percent of all situations": the cell holds an em dash (—) and is transcribed as "". Total row, "Total number of situations": a raised 2 is printed immediately before the figure; transcribed as "36,263^2". Percent cells are left blank wherever the corresponding count is 0 (and in a few places where it is not, e.g. "80–89" / "90–99" Other C combinations); these blanks are transcribed as "" and are as printed. Minor doubtful readings: "170–179" CA–CB combinations percent reads "0 1" (0.1), noticeably smaller than its neighbours but legible; "2,000–2,999" CE number of situations is "0" followed by a small ink speck that is not a digit or marker.
Source image
Source data: U.S. NLRB Annual Reports (public domain). Reconstruction by NLRB Stats Archive. Read by claude-opus-5 (effort max, prompt extract_v1) from the 300-dpi scan; stitched by page. Updated October 2026.