NLRB Stats Archive › Annual Reports › FY1983 › Standard Federal Administrative Regional Distribution of Cases Received, Fiscal Year 1983
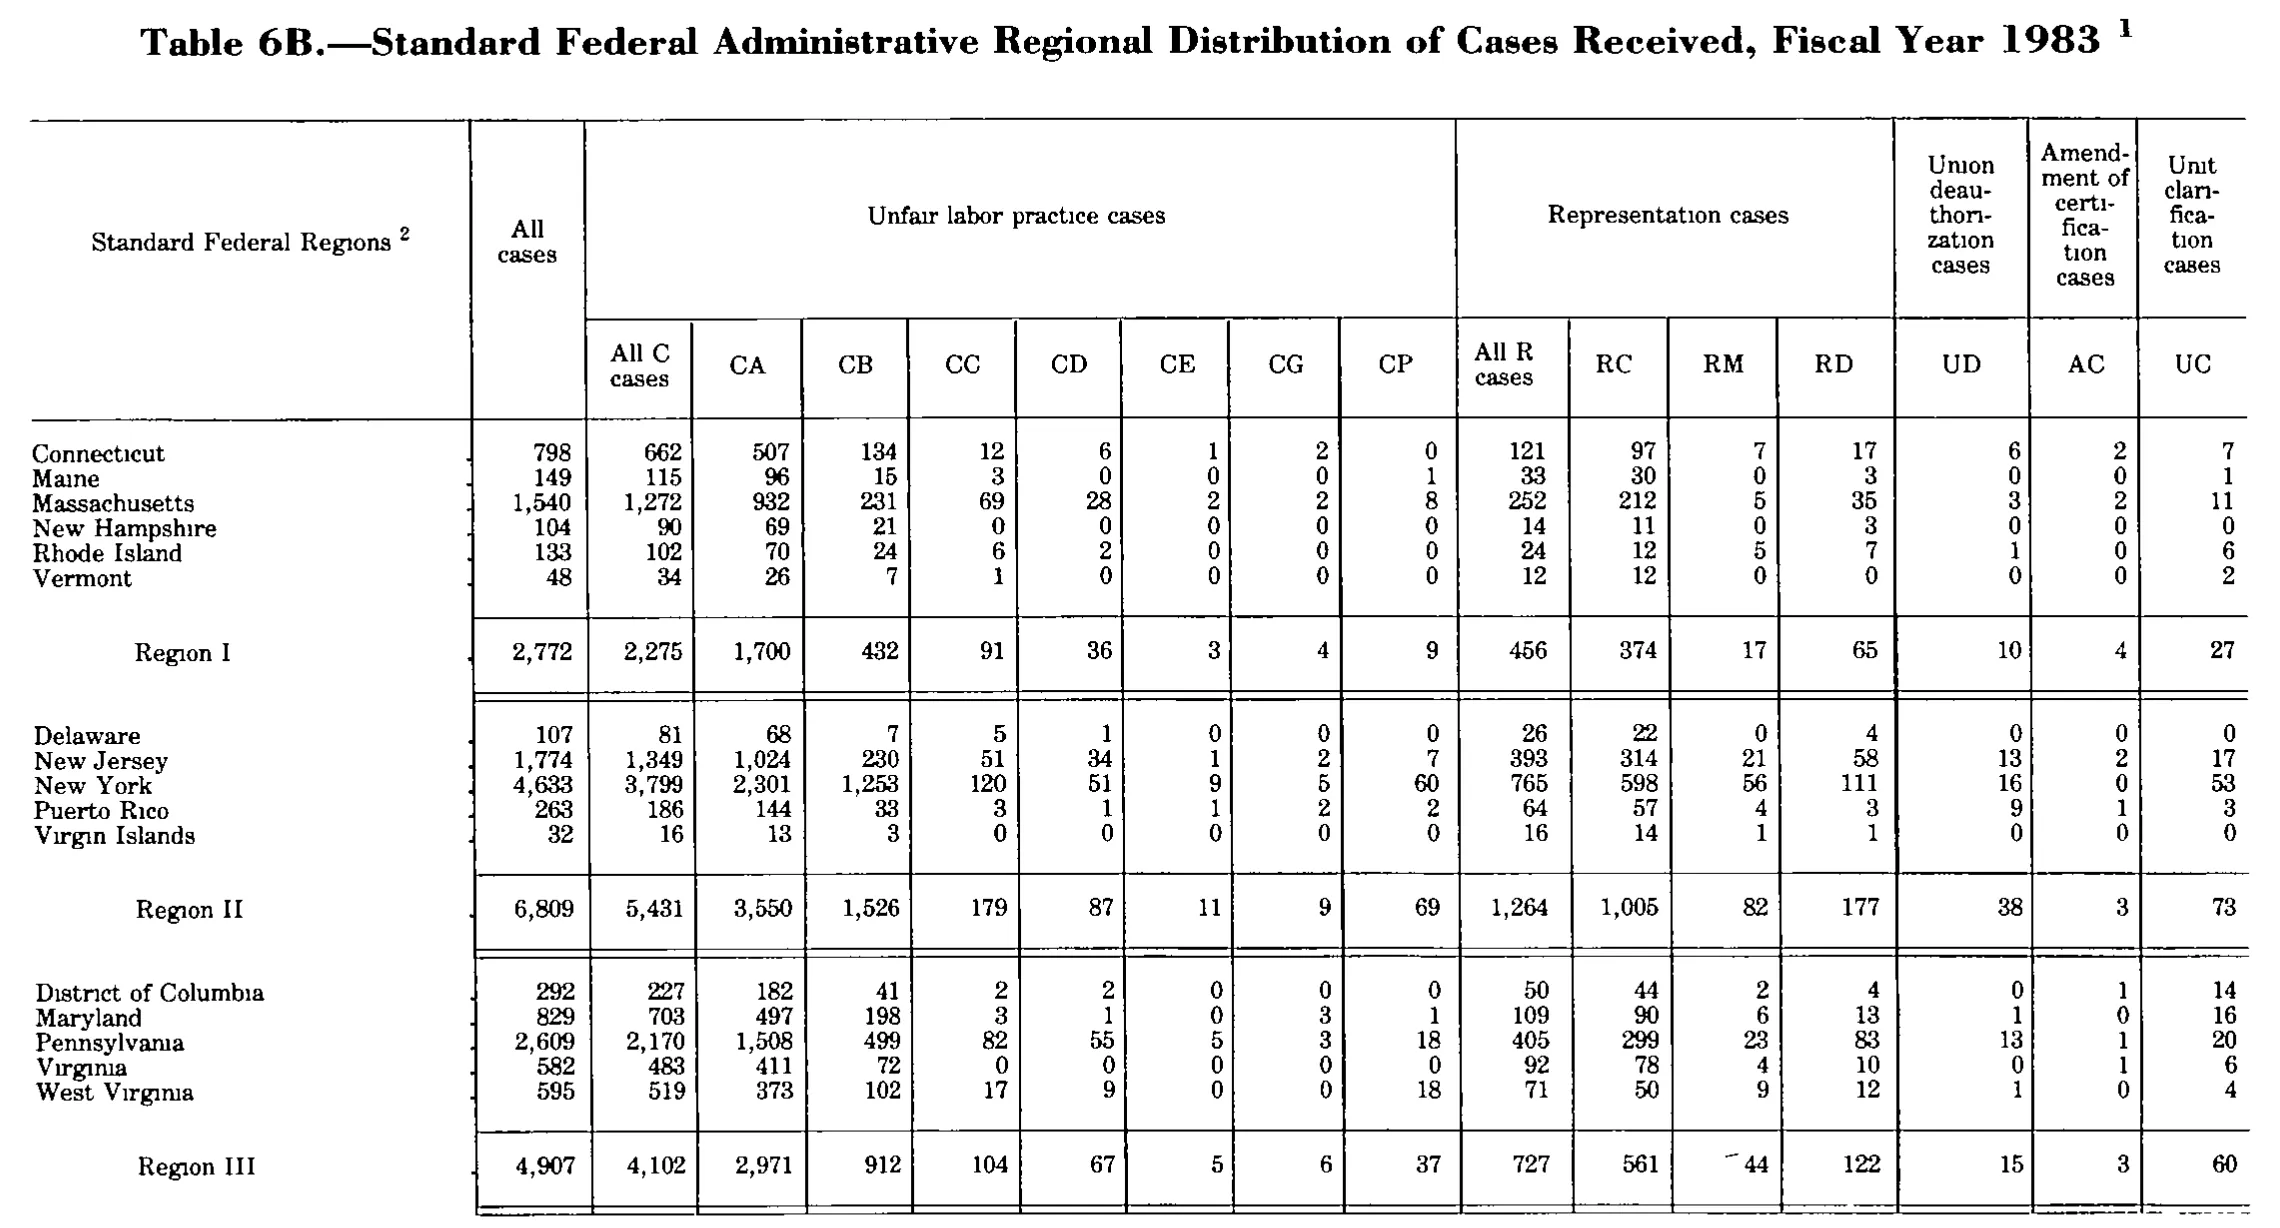
Standard Federal Administrative Regional Distribution of Cases Received, Fiscal Year 1983
Stitched from pp. 193–195.
| Standard Federal Regions | All cases | Unfair labor practice cases | Representation cases | Union deauthorization cases | Amendment of certification cases | Unit clarification cases | ||||||||||
|---|---|---|---|---|---|---|---|---|---|---|---|---|---|---|---|---|
| Standard Federal Regions | All cases | All C cases | CA | CB | CC | CD | CE | CG | CP | All R cases | RC | RM | RD | UD | AC | UC |
| Connecticut | 798 | 662 | 507 | 134 | 12 | 6 | 1 | 2 | 0 | 121 | 97 | 7 | 17 | 6 | 2 | 7 |
| Maine | 149 | 115 | 96 | 15 | 3 | 0 | 0 | 0 | 1 | 33 | 30 | 0 | 3 | 0 | 0 | 1 |
| Massachusetts | 1,540 | 1,272 | 932 | 231 | 69 | 28 | 2 | 2 | 8 | 252 | 212 | 5 | 35 | 3 | 2 | 11 |
| New Hampshire | 104 | 90 | 69 | 21 | 0 | 0 | 0 | 0 | 0 | 14 | 11 | 0 | 3 | 0 | 0 | 0 |
| Rhode Island | 133 | 102 | 70 | 24 | 6 | 2 | 0 | 0 | 0 | 24 | 12 | 5 | 7 | 1 | 0 | 6 |
| Vermont | 48 | 34 | 26 | 7 | 1 | 0 | 0 | 0 | 0 | 12 | 12 | 0 | 0 | 0 | 0 | 2 |
| Region I | 2,772 | 2,275 | 1,700 | 432 | 91 | 36 | 3 | 4 | 9 | 456 | 374 | 17 | 65 | 10 | 4 | 27 |
| Delaware | 107 | 81 | 68 | 7 | 5 | 1 | 0 | 0 | 0 | 26 | 22 | 0 | 4 | 0 | 0 | 0 |
| New Jersey | 1,774 | 1,349 | 1,024 | 230 | 51 | 34 | 1 | 2 | 7 | 393 | 314 | 21 | 58 | 13 | 2 | 17 |
| New York | 4,633 | 3,799 | 2,301 | 1,253 | 120 | 51 | 9 | 5 | 60 | 765 | 598 | 56 | 111 | 16 | 0 | 53 |
| Puerto Rico | 263 | 186 | 144 | 33 | 3 | 1 | 1 | 2 | 2 | 64 | 57 | 4 | 3 | 9 | 1 | 3 |
| Virgin Islands | 32 | 16 | 13 | 3 | 0 | 0 | 0 | 0 | 0 | 16 | 14 | 1 | 1 | 0 | 0 | 0 |
| Region II | 6,809 | 5,431 | 3,550 | 1,526 | 179 | 87 | 11 | 9 | 69 | 1,264 | 1,005 | 82 | 177 | 38 | 3 | 73 |
| District of Columbia | 292 | 227 | 182 | 41 | 2 | 2 | 0 | 0 | 0 | 50 | 44 | 2 | 4 | 0 | 1 | 14 |
| Maryland | 829 | 703 | 497 | 198 | 3 | 1 | 0 | 3 | 1 | 109 | 90 | 6 | 13 | 1 | 0 | 16 |
| Pennsylvania | 2,609 | 2,170 | 1,508 | 499 | 82 | 55 | 5 | 3 | 18 | 405 | 299 | 23 | 83 | 13 | 1 | 20 |
| Virginia | 582 | 483 | 411 | 72 | 0 | 0 | 0 | 0 | 0 | 92 | 78 | 4 | 10 | 0 | 1 | 6 |
| West Virginia | 595 | 519 | 373 | 102 | 17 | 9 | 0 | 0 | 18 | 71 | 50 | 9 | 12 | 1 | 0 | 4 |
| Region III | 4,907 | 4,102 | 2,971 | 912 | 104 | 67 | 5 | 6 | 37 | 727 | 561 | 44 | 122 | 15 | 3 | 60 |
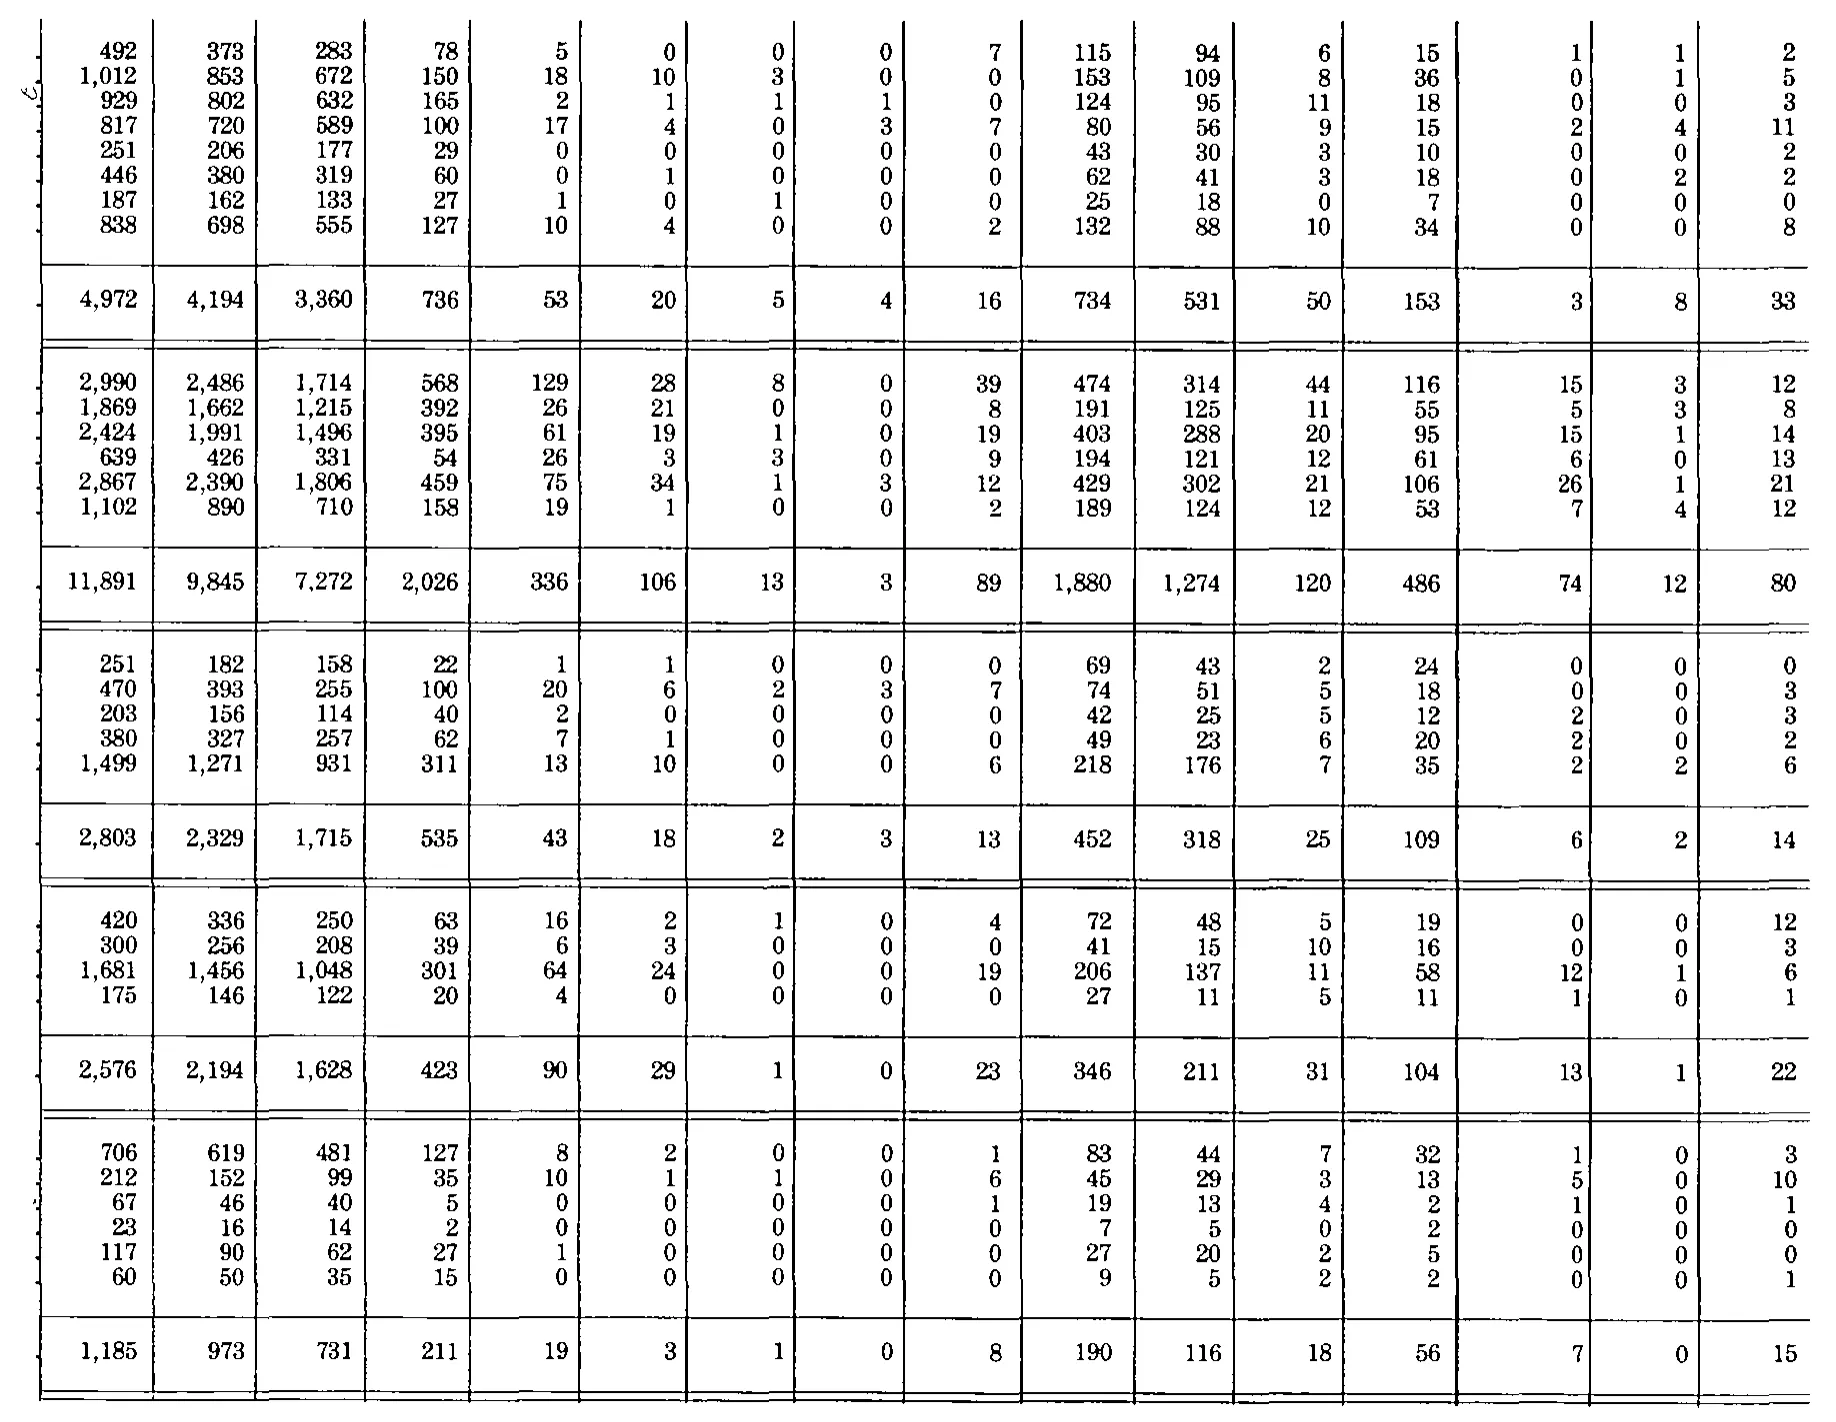
| 492 | 373 | 283 | 78 | 5 | 0 | 0 | 0 | 7 | 115 | 94 | 6 | 15 | 1 | 1 | 2 | |
| 1,012 | 853 | 672 | 150 | 18 | 10 | 3 | 0 | 0 | 153 | 109 | 8 | 36 | 0 | 1 | 5 | |
| 929 | 802 | 632 | 165 | 2 | 1 | 1 | 1 | 0 | 124 | 95 | 11 | 18 | 0 | 0 | 3 | |
| 817 | 720 | 589 | 100 | 17 | 4 | 0 | 3 | 7 | 80 | 56 | 9 | 15 | 2 | 4 | 11 | |
| 251 | 206 | 177 | 29 | 0 | 0 | 0 | 0 | 0 | 43 | 30 | 3 | 10 | 0 | 0 | 2 | |
| 446 | 380 | 319 | 60 | 0 | 1 | 0 | 0 | 0 | 62 | 41 | 3 | 18 | 0 | 2 | 2 | |
| 187 | 162 | 133 | 27 | 1 | 0 | 1 | 0 | 0 | 25 | 18 | 0 | 7 | 0 | 0 | 0 | |
| 838 | 698 | 555 | 127 | 10 | 4 | 0 | 0 | 2 | 132 | 88 | 10 | 34 | 0 | 0 | 8 | |
| 4,972 | 4,194 | 3,360 | 736 | 53 | 20 | 5 | 4 | 16 | 734 | 531 | 50 | 153 | 3 | 8 | 33 | |
| 2,990 | 2,486 | 1,714 | 568 | 129 | 28 | 8 | 0 | 39 | 474 | 314 | 44 | 116 | 15 | 3 | 12 | |
| 1,869 | 1,662 | 1,215 | 392 | 26 | 21 | 0 | 0 | 8 | 191 | 125 | 11 | 55 | 5 | 3 | 8 | |
| 2,424 | 1,991 | 1,496 | 395 | 61 | 19 | 1 | 0 | 19 | 403 | 288 | 20 | 95 | 15 | 1 | 14 | |
| 639 | 426 | 331 | 54 | 26 | 3 | 3 | 0 | 9 | 194 | 121 | 12 | 61 | 6 | 0 | 13 | |
| 2,867 | 2,390 | 1,806 | 459 | 75 | 34 | 1 | 3 | 12 | 429 | 302 | 21 | 106 | 26 | 1 | 21 | |
| 1,102 | 890 | 710 | 158 | 19 | 1 | 0 | 0 | 2 | 189 | 124 | 12 | 53 | 7 | 4 | 12 | |
| 11,891 | 9,845 | 7,272 | 2,026 | 336 | 106 | 13 | 3 | 89 | 1,880 | 1,274 | 120 | 486 | 74 | 12 | 80 | |
| 251 | 182 | 158 | 22 | 1 | 1 | 0 | 0 | 0 | 69 | 43 | 2 | 24 | 0 | 0 | 0 | |
| 470 | 393 | 255 | 100 | 20 | 6 | 2 | 3 | 7 | 74 | 51 | 5 | 18 | 0 | 0 | 3 | |
| 203 | 156 | 114 | 40 | 2 | 0 | 0 | 0 | 0 | 42 | 25 | 5 | 12 | 2 | 0 | 3 | |
| 380 | 327 | 257 | 62 | 7 | 1 | 0 | 0 | 0 | 49 | 23 | 6 | 20 | 2 | 0 | 2 | |
| 1,499 | 1,271 | 931 | 311 | 13 | 10 | 0 | 0 | 6 | 218 | 176 | 7 | 35 | 2 | 2 | 6 | |
| 2,803 | 2,329 | 1,715 | 535 | 43 | 18 | 2 | 3 | 13 | 452 | 318 | 25 | 109 | 6 | 2 | 14 | |
| 420 | 336 | 250 | 63 | 16 | 2 | 1 | 0 | 4 | 72 | 48 | 5 | 19 | 0 | 0 | 12 | |
| 300 | 256 | 208 | 39 | 6 | 3 | 0 | 0 | 0 | 41 | 15 | 10 | 16 | 0 | 0 | 3 | |
| 1,681 | 1,456 | 1,048 | 301 | 64 | 24 | 0 | 0 | 19 | 206 | 137 | 11 | 58 | 12 | 1 | 6 | |
| 175 | 146 | 122 | 20 | 4 | 0 | 0 | 0 | 0 | 27 | 11 | 5 | 11 | 1 | 0 | 1 | |
| 2,576 | 2,194 | 1,628 | 423 | 90 | 29 | 1 | 0 | 23 | 346 | 211 | 31 | 104 | 13 | 1 | 22 | |
| 706 | 619 | 481 | 127 | 8 | 2 | 0 | 0 | 1 | 83 | 44 | 7 | 32 | 1 | 0 | 3 | |
| 212 | 152 | 99 | 35 | 10 | 1 | 1 | 0 | 6 | 45 | 29 | 3 | 13 | 5 | 0 | 10 | |
| 67 | 46 | 40 | 5 | 0 | 0 | 0 | 0 | 1 | 19 | 13 | 4 | 2 | 1 | 0 | 1 | |
| 23 | 16 | 14 | 2 | 0 | 0 | 0 | 0 | 0 | 7 | 5 | 0 | 2 | 0 | 0 | 0 | |
| 117 | 90 | 62 | 27 | 1 | 0 | 0 | 0 | 0 | 27 | 20 | 2 | 5 | 0 | 0 | 0 | |
| 60 | 50 | 35 | 15 | 0 | 0 | 0 | 0 | 0 | 9 | 5 | 2 | 2 | 0 | 0 | 1 | |
| 1,185 | 973 | 731 | 211 | 19 | 3 | 1 | 0 | 8 | 190 | 116 | 18 | 56 | 7 | 0 | 15 | |
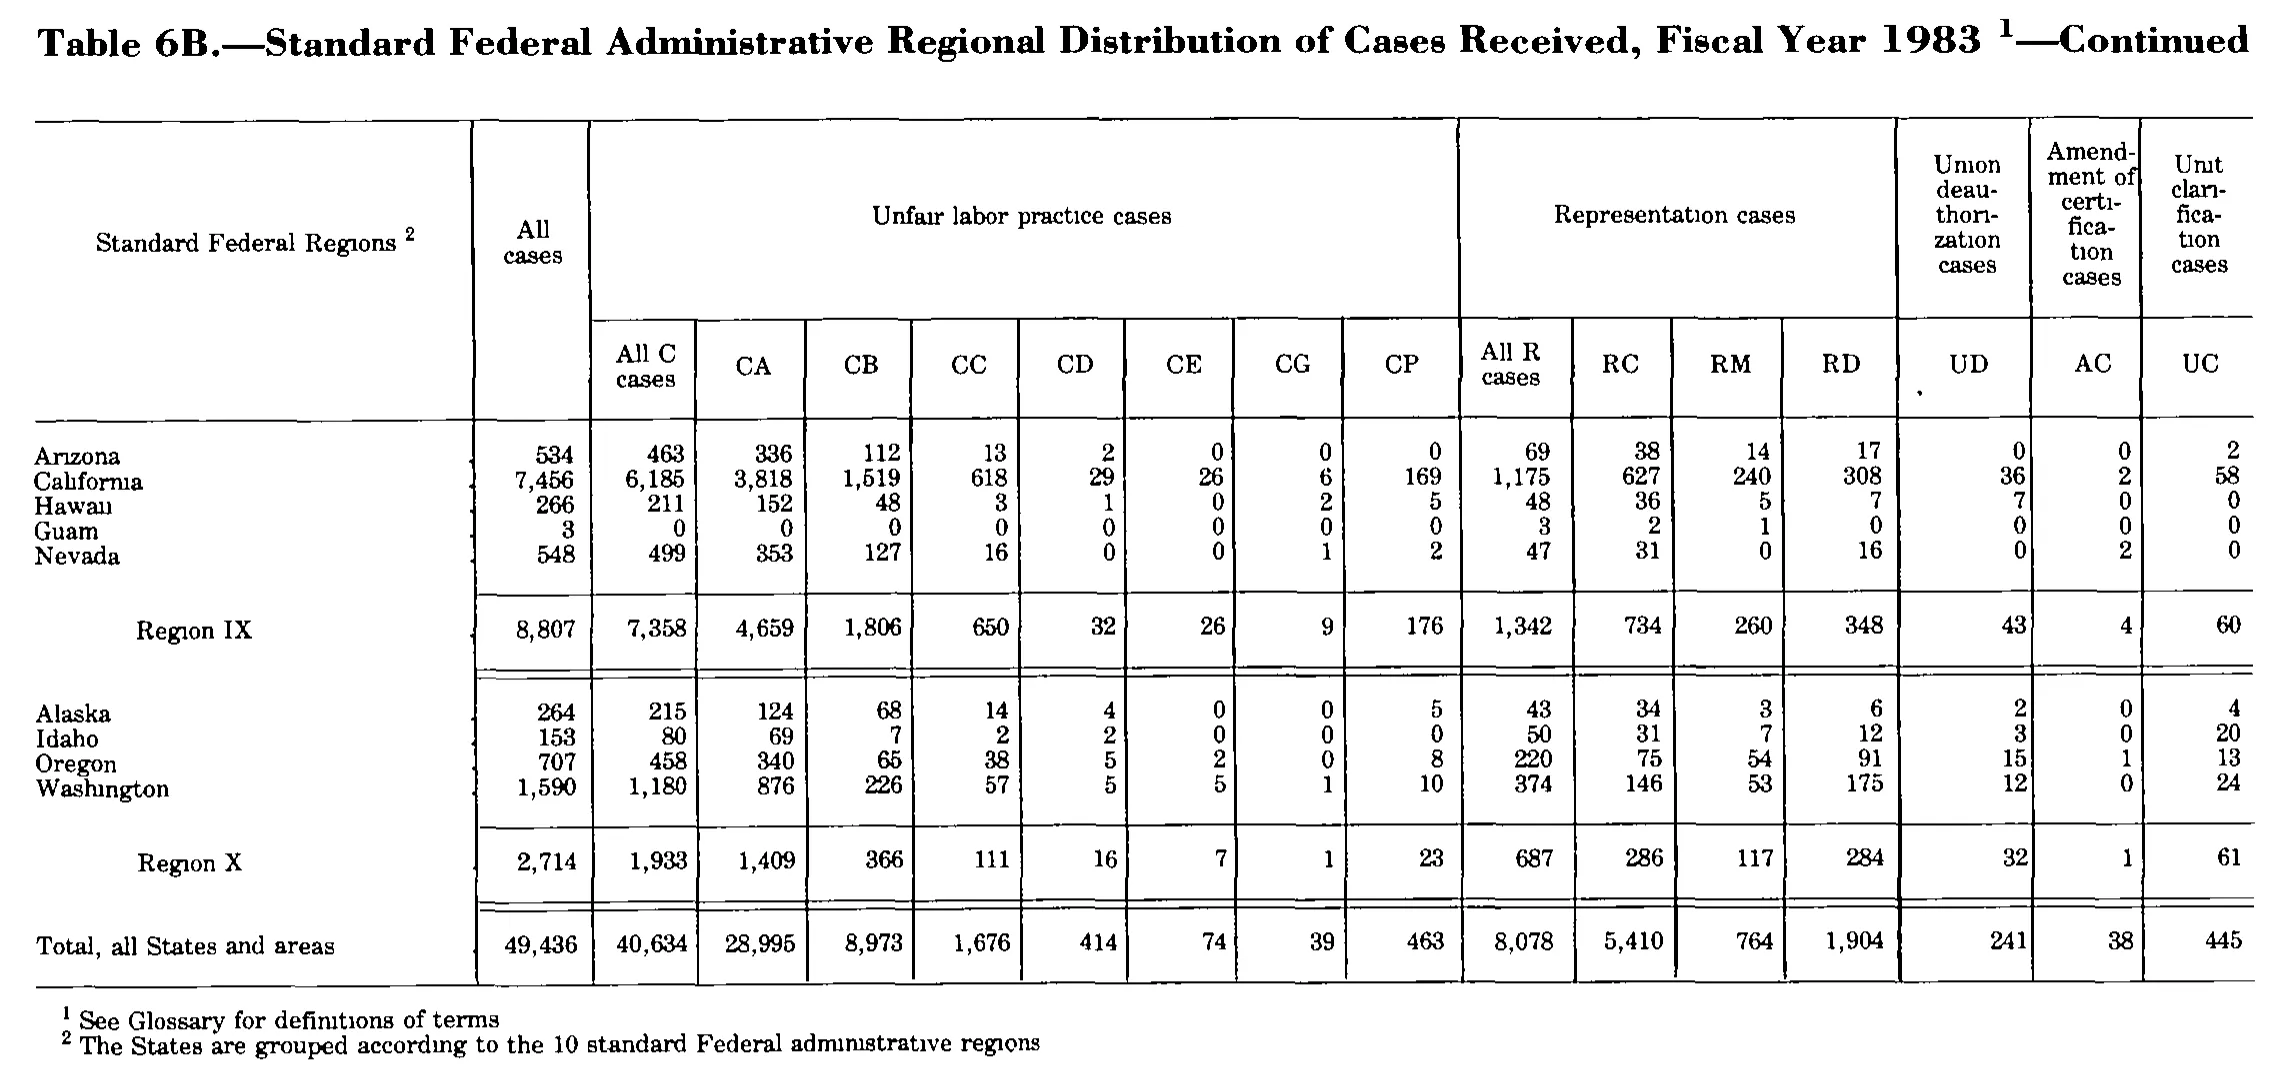
| Arizona | 534 | 463 | 336 | 112 | 13 | 2 | 0 | 0 | 0 | 69 | 38 | 14 | 17 | 0 | 0 | 2 |
| California | 7,456 | 6,185 | 3,818 | 1,519 | 618 | 29 | 26 | 6 | 169 | 1,175 | 627 | 240 | 308 | 36 | 2 | 58 |
| Hawaii | 266 | 211 | 152 | 48 | 3 | 1 | 0 | 2 | 5 | 48 | 36 | 5 | 7 | 7 | 0 | 0 |
| Guam | 3 | 0 | 0 | 0 | 0 | 0 | 0 | 0 | 0 | 3 | 2 | 1 | 0 | 0 | 0 | 0 |
| Nevada | 548 | 499 | 353 | 127 | 16 | 0 | 0 | 1 | 2 | 47 | 31 | 0 | 16 | 0 | 2 | 0 |
| Region IX | 8,807 | 7,358 | 4,659 | 1,806 | 650 | 32 | 26 | 9 | 176 | 1,342 | 734 | 260 | 348 | 43 | 4 | 60 |
| Alaska | 264 | 215 | 124 | 68 | 14 | 4 | 0 | 0 | 5 | 43 | 34 | 3 | 6 | 2 | 0 | 4 |
| Idaho | 153 | 80 | 69 | 7 | 2 | 2 | 0 | 0 | 0 | 50 | 31 | 7 | 12 | 3 | 0 | 20 |
| Oregon | 707 | 458 | 340 | 65 | 38 | 5 | 2 | 0 | 8 | 220 | 75 | 54 | 91 | 15 | 1 | 13 |
| Washington | 1,590 | 1,180 | 876 | 226 | 57 | 5 | 5 | 1 | 10 | 374 | 146 | 53 | 175 | 12 | 0 | 24 |
| Region X | 2,714 | 1,933 | 1,409 | 366 | 111 | 16 | 7 | 1 | 23 | 687 | 286 | 117 | 284 | 32 | 1 | 61 |
| Total, all States and areas | 49,436 | 40,634 | 28,995 | 8,973 | 1,676 | 414 | 74 | 39 | 463 | 8,078 | 5,410 | 764 | 1,904 | 241 | 38 | 445 |
- 1 See Glossary for definitions of terms
- 2 The States are grouped according to the 10 standard Federal administrative regions
836 of 836 figures sit in a row or column sum that works out.
Reader’s notes
p. 193. 17 columns: stub, "All cases", eight unfair-labor-practice columns (All C cases, CA, CB, CC, CD, CE, CG, CP), four representation columns (All R cases, RC, RM, RD), and UD, AC, UC. "All cases", the stub heading and the three right-hand headings span both heading levels; the right-hand three carry their own second-level codes UD/AC/UC, which are used there. The crop is cut off at the bottom: the table ends just below the "Region III" subtotal rule and continues on the following page (Regions IV onward). No footnote texts are printed on this crop, so `footnotes` is empty, even though the caption carries a raised 1 and the stub heading a raised 2 (transcribed as "Standard Federal Regions^2"); those notes must appear at the end of the table elsewhere. In the "Region III" row, the RM value 44 is preceded by a short stray horizontal mark (a scanning/typesetting artifact resembling a raised hyphen). It is not a footnote marker or a minus sign, so the cell is transcribed as "44"; the column sum 2+6+23+4+9 = 44 confirms the value. Blank vertical gaps separate each state group from its Region subtotal row; these are whitespace, not printed rows, and are not included. Verification: every state row's C-case components sum to "All C cases", its R-case components sum to "All R cases", and All C + All R + UD + AC + UC equals "All cases"; each Region subtotal equals the sum of its member states in all 16 value columns. No discrepancies found.
p. 194. Crop content: this is a continuation page carrying only body rows — no column headings and no footnotes are printed on the image, so header_rows is empty. Stub column cut off: the crop is trimmed at the left so that the row-label (stub) column is lost; only a thin sliver of it survives at the left edge (the tail ends of the leader dots and the vertical rule). Cell 0 of every row is therefore "" — the labels are not legible/present on this image, not blank in the original. All 16 printed data columns are fully visible and are transcribed in cells 1-16. Structure: five label-less blocks, each closed by a total row set off by rules (8 data rows + total; 6 + total; 5 + total; 4 + total; 6 + total = 34 rows). The section headings that would name each block sit in the missing stub column. Arithmetic check: every one of the 16 columns in all five blocks sums exactly to its printed total (e.g. block 1 col 1: 492+1,012+929+817+251+446+187+838 = 4,972; block 2 col 10: 474+191+403+194+429+189 = 1,880). This cross-check confirms the column assignment of every value, including the many single-digit cells. Edges: the table continues above the top of the crop (the first row starts flush with the top edge) and below it (a double rule closes the last total row at the bottom edge, with the next block beginning off-image). A small handwritten/stray ink mark appears in the left margin beside the third row of block 1; it is not part of the table. A heavier vertical rule separates column 9 from column 10, indicating a major column-group division in the (absent) heading.
p. 195. This is a continuation page (the caption carries "—Continued"); it shows only the last two regional blocks (Region IX and Region X) and the grand-total line, so earlier regions appear on preceding pages. Column headings are printed on this page and are transcribed. 17 columns: stub, "All cases", eight columns under "Unfair labor practice cases" (All C cases, CA, CB, CC, CD, CE, CG, CP), four under "Representation cases" (All R cases, RC, RM, RD), then UD, AC and UC, each under its own tall heading ("Union deauthorization cases", "Amendment of certification cases", "Unit clarification cases"). "All cases" and the stub heading "Standard Federal Regions" span both heading levels and are repeated in each. Blank spacer lines separate the state blocks from their region-subtotal lines and the subtotals from the grand total; they carry no label or values and are not transcribed as rows. Arithmetic checks all pass as printed: each state's CA–CP sum equals its All C cases, RC+RM+RD equals All R cases, and All C + All R + UD + AC + UC equals All cases; the Region IX and Region X lines equal the sums of their member states, and the grand-total line is internally consistent (40,634 + 8,078 + 241 + 38 + 445 = 49,436). No suspected misprints. Scan artifacts only, not affecting values: the typeface renders many "i" characters dotless (e.g. "Arızona", "Calıfornıa", "Hawaıı"), transcribed with normal letters; a small stray ink dot sits in the blank area just left of the "UD" column label and is not a printed mark.
Source image
Source data: U.S. NLRB Annual Reports (public domain). Reconstruction by NLRB Stats Archive. Read by claude-opus-5 (effort max, prompt extract_v1) from the 300-dpi scan; stitched by page. Updated October 2026.