NLRB Stats Archive › Annual Reports › FY1983 › Geographic Distribution of Cases Received, Fiscal Year 1983
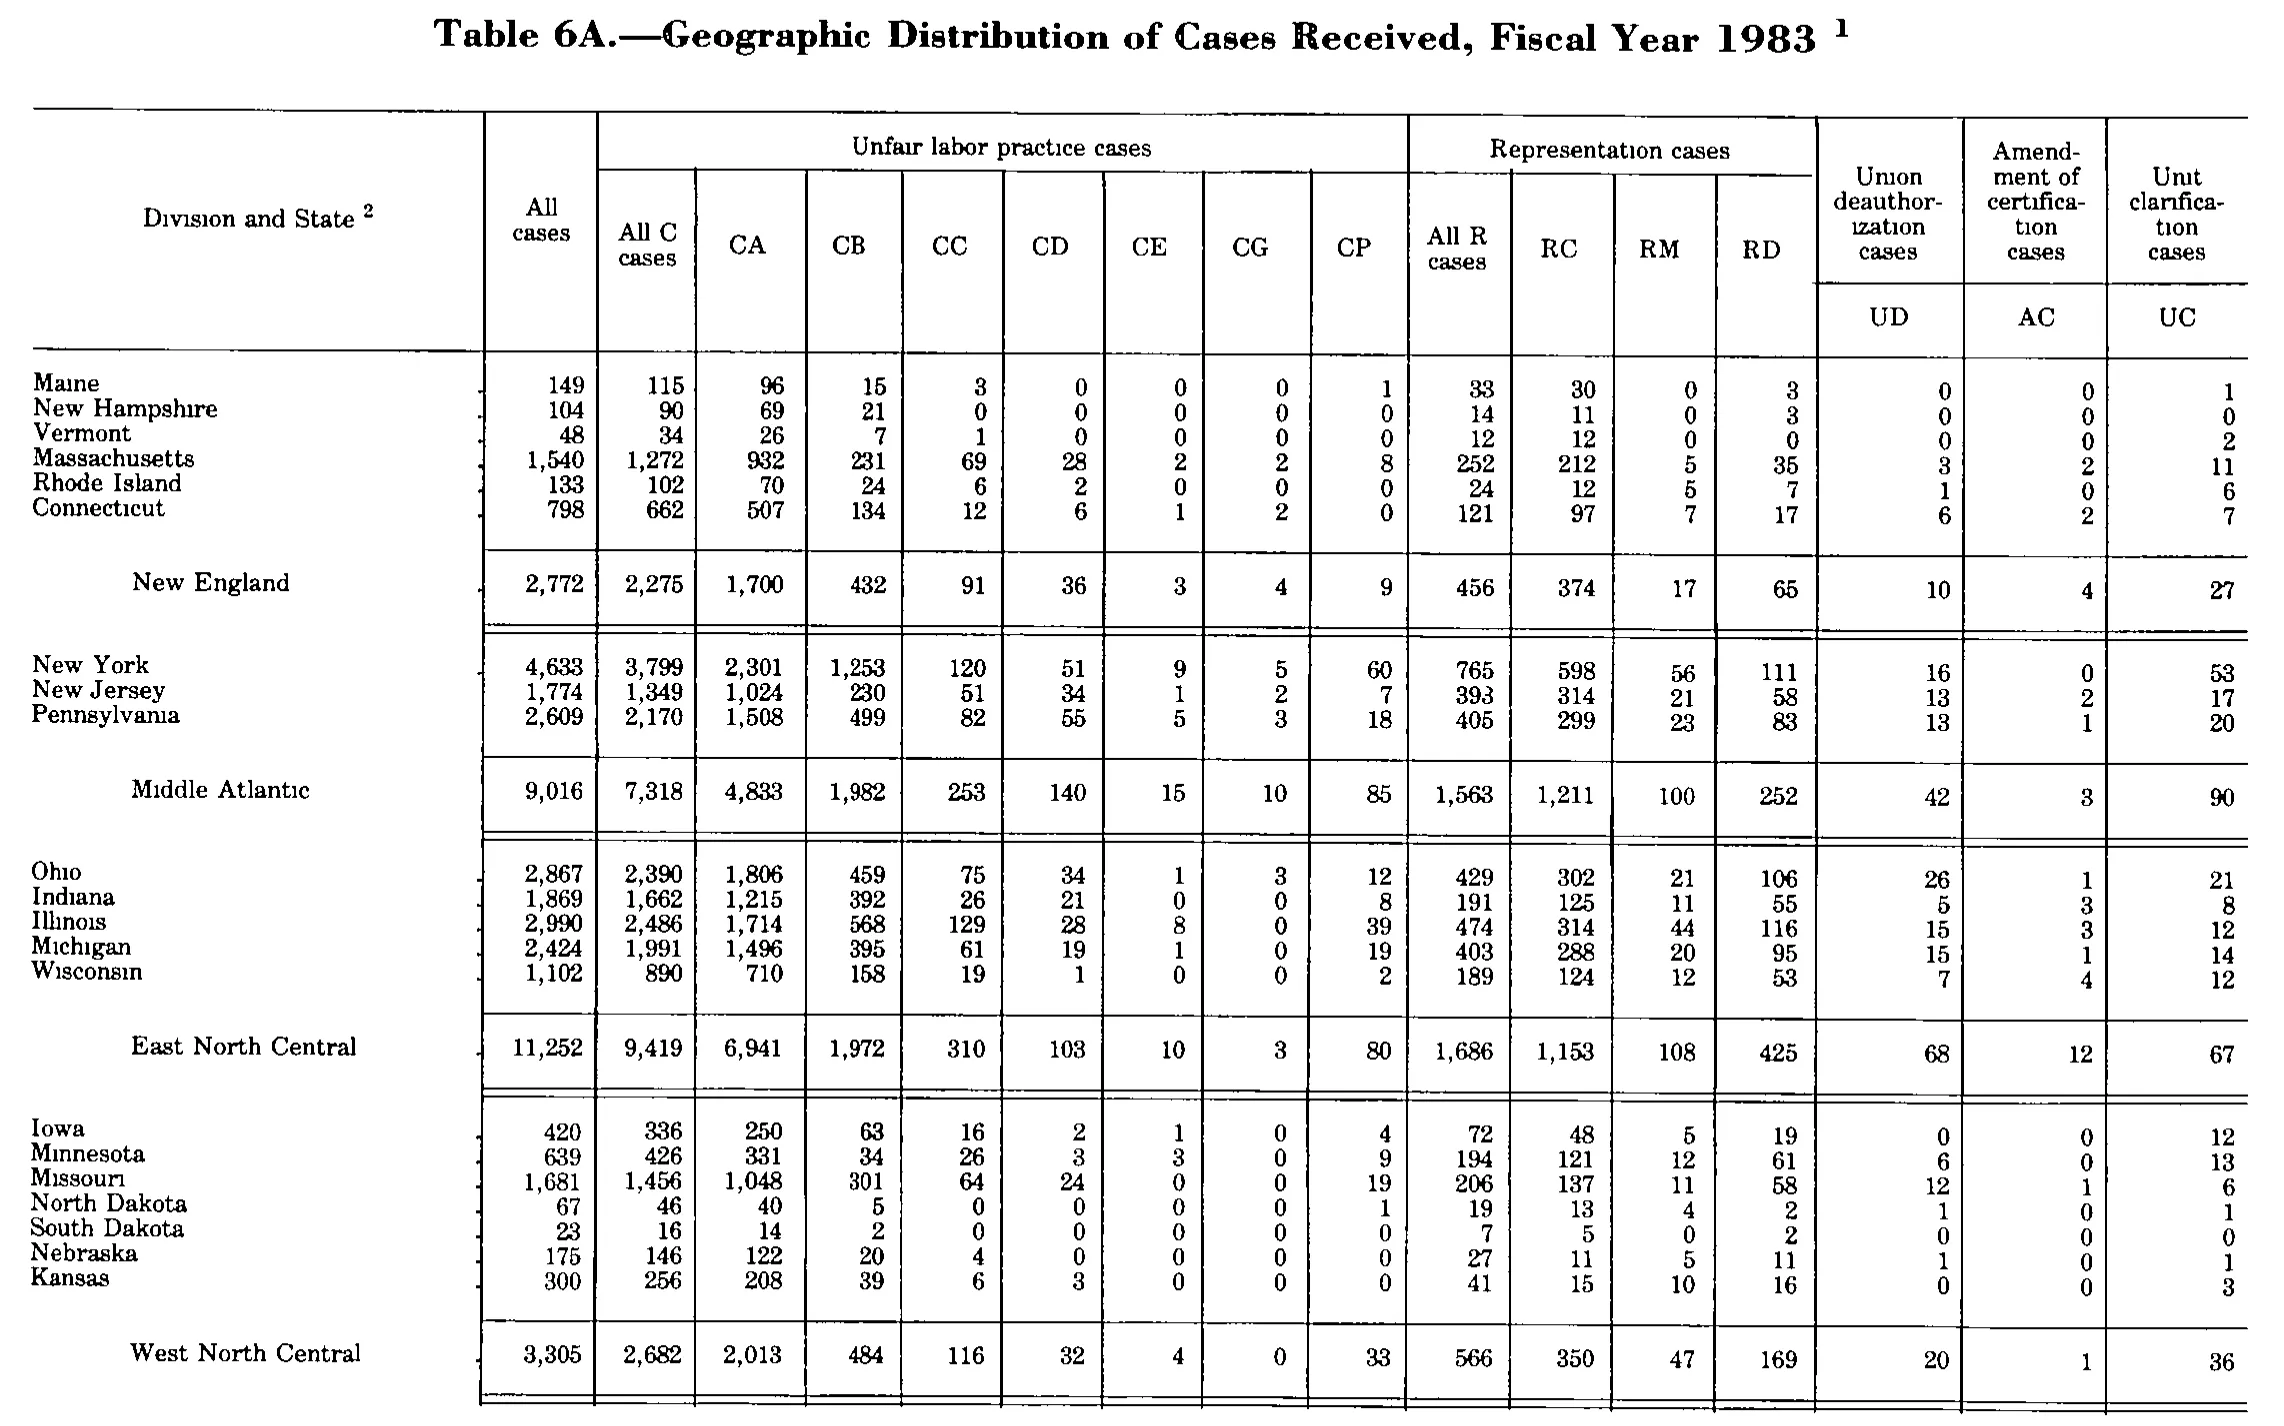
Geographic Distribution of Cases Received, Fiscal Year 1983
Stitched from pp. 190–192.
| Division and State | All cases | Unfair labor practice cases | Representation cases | Union deauthorization cases | Amendment of certification cases | Unit clarification cases | ||||||||||
|---|---|---|---|---|---|---|---|---|---|---|---|---|---|---|---|---|
| Division and State | All cases | All C cases | CA | CB | CC | CD | CE | CG | CP | All R cases | RC | RM | RD | Union deauthorization cases | Amendment of certification cases | Unit clarification cases |
| Division and State | All cases | All C cases | CA | CB | CC | CD | CE | CG | CP | All R cases | RC | RM | RD | UD | AC | UC |
| Maine | 149 | 115 | 96 | 15 | 3 | 0 | 0 | 0 | 1 | 33 | 30 | 0 | 3 | 0 | 0 | 1 |
| New Hampshire | 104 | 90 | 69 | 21 | 0 | 0 | 0 | 0 | 0 | 14 | 11 | 0 | 3 | 0 | 0 | 0 |
| Vermont | 48 | 34 | 26 | 7 | 1 | 0 | 0 | 0 | 0 | 12 | 12 | 0 | 0 | 0 | 0 | 2 |
| Massachusetts | 1,540 | 1,272 | 932 | 231 | 69 | 28 | 2 | 2 | 8 | 252 | 212 | 5 | 35 | 3 | 2 | 11 |
| Rhode Island | 133 | 102 | 70 | 24 | 6 | 2 | 0 | 0 | 0 | 24 | 12 | 5 | 7 | 1 | 0 | 6 |
| Connecticut | 798 | 662 | 507 | 134 | 12 | 6 | 1 | 2 | 0 | 121 | 97 | 7 | 17 | 6 | 2 | 7 |
| New England | 2,772 | 2,275 | 1,700 | 432 | 91 | 36 | 3 | 4 | 9 | 456 | 374 | 17 | 65 | 10 | 4 | 27 |
| New York | 4,633 | 3,799 | 2,301 | 1,253 | 120 | 51 | 9 | 5 | 60 | 765 | 598 | 56 | 111 | 16 | 0 | 53 |
| New Jersey | 1,774 | 1,349 | 1,024 | 230 | 51 | 34 | 1 | 2 | 7 | 393 | 314 | 21 | 58 | 13 | 2 | 17 |
| Pennsylvania | 2,609 | 2,170 | 1,508 | 499 | 82 | 55 | 5 | 3 | 18 | 405 | 299 | 23 | 83 | 13 | 1 | 20 |
| Middle Atlantic | 9,016 | 7,318 | 4,833 | 1,982 | 253 | 140 | 15 | 10 | 85 | 1,563 | 1,211 | 100 | 252 | 42 | 3 | 90 |
| Ohio | 2,867 | 2,390 | 1,806 | 459 | 75 | 34 | 1 | 3 | 12 | 429 | 302 | 21 | 106 | 26 | 1 | 21 |
| Indiana | 1,869 | 1,662 | 1,215 | 392 | 26 | 21 | 0 | 0 | 8 | 191 | 125 | 11 | 55 | 5 | 3 | 8 |
| Illinois | 2,990 | 2,486 | 1,714 | 568 | 129 | 28 | 8 | 0 | 39 | 474 | 314 | 44 | 116 | 15 | 3 | 12 |
| Michigan | 2,424 | 1,991 | 1,496 | 395 | 61 | 19 | 1 | 0 | 19 | 403 | 288 | 20 | 95 | 15 | 1 | 14 |
| Wisconsin | 1,102 | 890 | 710 | 158 | 19 | 1 | 0 | 0 | 2 | 189 | 124 | 12 | 53 | 7 | 4 | 12 |
| East North Central | 11,252 | 9,419 | 6,941 | 1,972 | 310 | 103 | 10 | 3 | 80 | 1,686 | 1,153 | 108 | 425 | 68 | 12 | 67 |
| Iowa | 420 | 336 | 250 | 63 | 16 | 2 | 1 | 0 | 4 | 72 | 48 | 5 | 19 | 0 | 0 | 12 |
| Minnesota | 639 | 426 | 331 | 34 | 26 | 3 | 3 | 0 | 9 | 194 | 121 | 12 | 61 | 6 | 0 | 13 |
| Missouri | 1,681 | 1,456 | 1,048 | 301 | 64 | 24 | 0 | 0 | 19 | 206 | 137 | 11 | 58 | 12 | 1 | 6 |
| North Dakota | 67 | 46 | 40 | 5 | 0 | 0 | 0 | 0 | 1 | 19 | 13 | 4 | 2 | 1 | 0 | 1 |
| South Dakota | 23 | 16 | 14 | 2 | 0 | 0 | 0 | 0 | 0 | 7 | 5 | 0 | 2 | 0 | 0 | 0 |
| Nebraska | 175 | 146 | 122 | 20 | 4 | 0 | 0 | 0 | 0 | 27 | 11 | 5 | 11 | 1 | 0 | 1 |
| Kansas | 300 | 256 | 208 | 39 | 6 | 3 | 0 | 0 | 0 | 41 | 15 | 10 | 16 | 0 | 0 | 3 |
| West North Central | 3,305 | 2,682 | 2,013 | 484 | 116 | 32 | 4 | 0 | 33 | 566 | 350 | 47 | 169 | 20 | 1 | 36 |
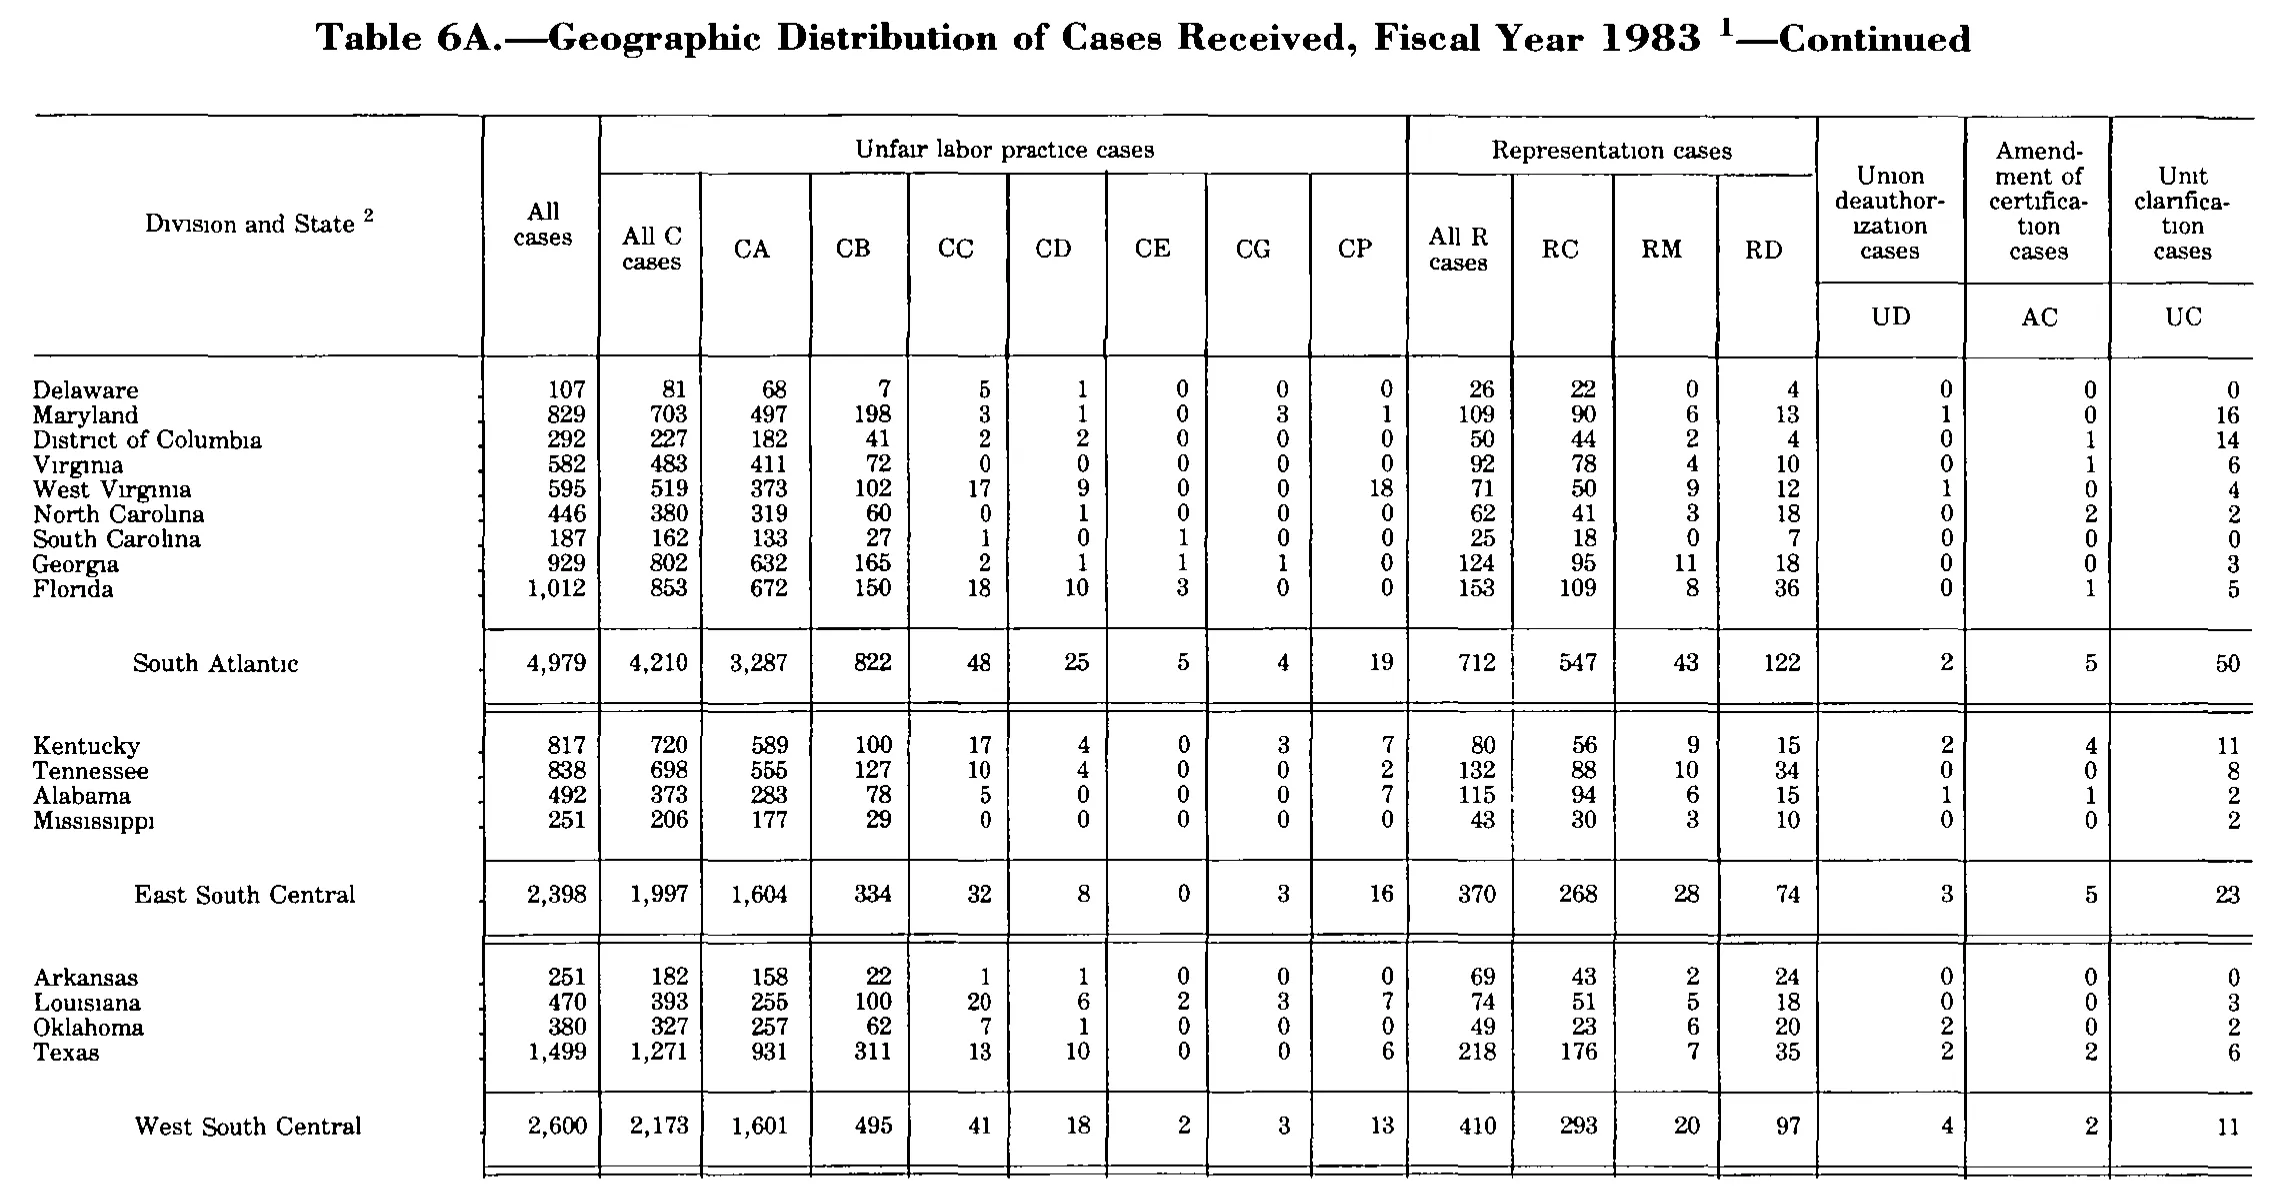
| Delaware | 107 | 81 | 68 | 7 | 5 | 1 | 0 | 0 | 0 | 26 | 22 | 0 | 4 | 0 | 0 | 0 |
| Maryland | 829 | 703 | 497 | 198 | 3 | 1 | 0 | 3 | 1 | 109 | 90 | 6 | 13 | 1 | 0 | 16 |
| District of Columbia | 292 | 227 | 182 | 41 | 2 | 2 | 0 | 0 | 0 | 50 | 44 | 2 | 4 | 0 | 1 | 14 |
| Virginia | 582 | 483 | 411 | 72 | 0 | 0 | 0 | 0 | 0 | 92 | 78 | 4 | 10 | 0 | 1 | 6 |
| West Virginia | 595 | 519 | 373 | 102 | 17 | 9 | 0 | 0 | 18 | 71 | 50 | 9 | 12 | 1 | 0 | 4 |
| North Carolina | 446 | 380 | 319 | 60 | 0 | 1 | 0 | 0 | 0 | 62 | 41 | 3 | 18 | 0 | 2 | 2 |
| South Carolina | 187 | 162 | 133 | 27 | 1 | 0 | 1 | 0 | 0 | 25 | 18 | 0 | 7 | 0 | 0 | 0 |
| Georgia | 929 | 802 | 632 | 165 | 2 | 1 | 1 | 1 | 0 | 124 | 95 | 11 | 18 | 0 | 0 | 3 |
| Florida | 1,012 | 853 | 672 | 150 | 18 | 10 | 3 | 0 | 0 | 153 | 109 | 8 | 36 | 0 | 1 | 5 |
| South Atlantic | 4,979 | 4,210 | 3,287 | 822 | 48 | 25 | 5 | 4 | 19 | 712 | 547 | 43 | 122 | 2 | 5 | 50 |
| Kentucky | 817 | 720 | 589 | 100 | 17 | 4 | 0 | 3 | 7 | 80 | 56 | 9 | 15 | 2 | 4 | 11 |
| Tennessee | 838 | 698 | 555 | 127 | 10 | 4 | 0 | 0 | 2 | 132 | 88 | 10 | 34 | 0 | 0 | 8 |
| Alabama | 492 | 373 | 283 | 78 | 5 | 0 | 0 | 0 | 7 | 115 | 94 | 6 | 15 | 1 | 1 | 2 |
| Mississippi | 251 | 206 | 177 | 29 | 0 | 0 | 0 | 0 | 0 | 43 | 30 | 3 | 10 | 0 | 0 | 2 |
| East South Central | 2,398 | 1,997 | 1,604 | 334 | 32 | 8 | 0 | 3 | 16 | 370 | 268 | 28 | 74 | 3 | 5 | 23 |
| Arkansas | 251 | 182 | 158 | 22 | 1 | 1 | 0 | 0 | 0 | 69 | 43 | 2 | 24 | 0 | 0 | 0 |
| Louisiana | 470 | 393 | 255 | 100 | 20 | 6 | 2 | 3 | 7 | 74 | 51 | 5 | 18 | 0 | 0 | 3 |
| Oklahoma | 380 | 327 | 257 | 62 | 7 | 1 | 0 | 0 | 0 | 49 | 23 | 6 | 20 | 2 | 0 | 2 |
| Texas | 1,499 | 1,271 | 931 | 311 | 13 | 10 | 0 | 0 | 6 | 218 | 176 | 7 | 35 | 2 | 2 | 6 |
| West South Central | 2,600 | 2,173 | 1,601 | 495 | 41 | 18 | 2 | 3 | 13 | 410 | 293 | 20 | 97 | 4 | 2 | 11 |
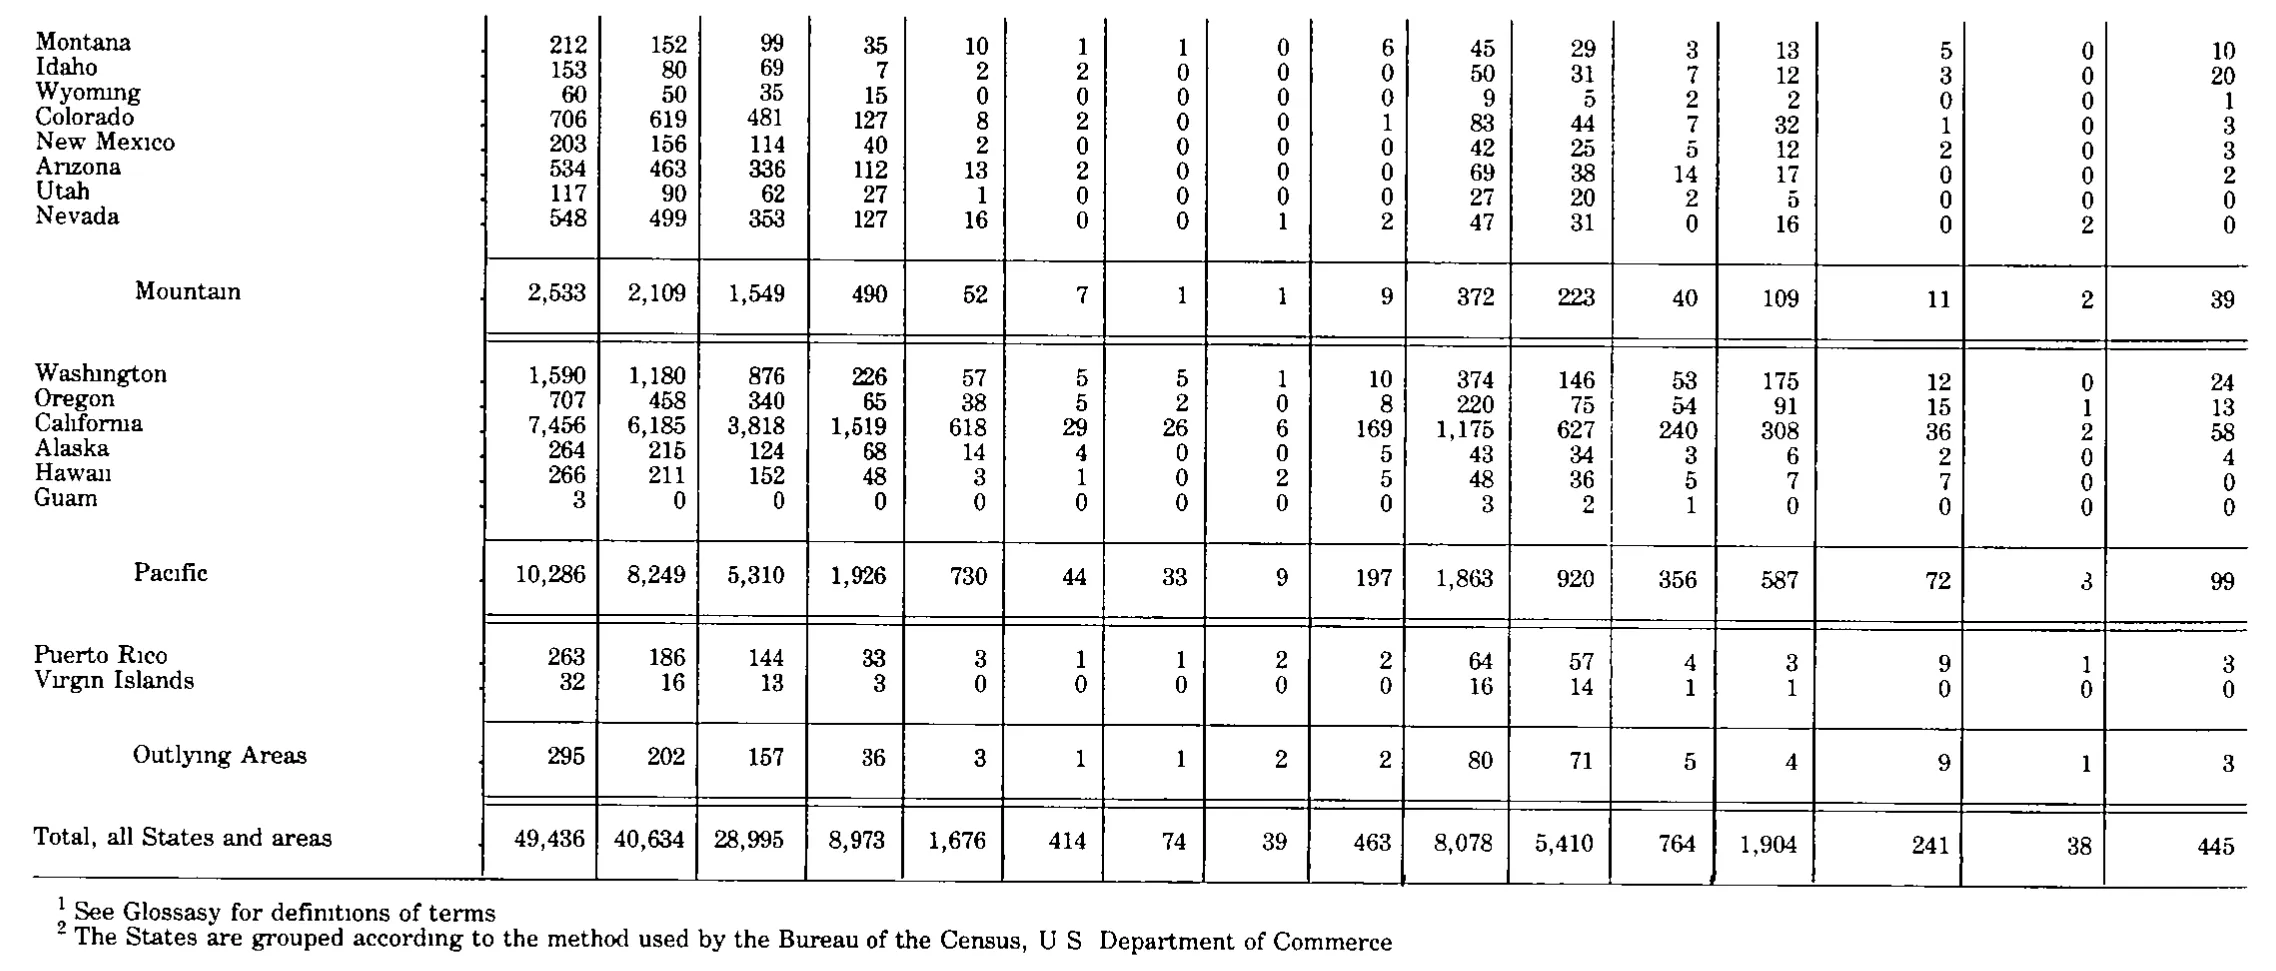
| Montana | 212 | 152 | 99 | 35 | 10 | 1 | 1 | 0 | 6 | 45 | 29 | 3 | 13 | 5 | 0 | 10 |
| Idaho | 153 | 80 | 69 | 7 | 2 | 2 | 0 | 0 | 0 | 50 | 31 | 7 | 12 | 3 | 0 | 20 |
| Wyoming | 60 | 50 | 35 | 15 | 0 | 0 | 0 | 0 | 0 | 9 | 5 | 2 | 2 | 0 | 0 | 1 |
| Colorado | 706 | 619 | 481 | 127 | 8 | 2 | 0 | 0 | 1 | 83 | 44 | 7 | 32 | 1 | 0 | 3 |
| New Mexico | 203 | 156 | 114 | 40 | 2 | 0 | 0 | 0 | 0 | 42 | 25 | 5 | 12 | 2 | 0 | 3 |
| Arizona | 534 | 463 | 336 | 112 | 13 | 2 | 0 | 0 | 0 | 69 | 38 | 14 | 17 | 0 | 0 | 2 |
| Utah | 117 | 90 | 62 | 27 | 1 | 0 | 0 | 0 | 0 | 27 | 20 | 2 | 5 | 0 | 0 | 0 |
| Nevada | 548 | 499 | 353 | 127 | 16 | 0 | 0 | 1 | 2 | 47 | 31 | 0 | 16 | 0 | 2 | 0 |
| Mountain | 2,533 | 2,109 | 1,549 | 490 | 52 | 7 | 1 | 1 | 9 | 372 | 223 | 40 | 109 | 11 | 2 | 39 |
| Washington | 1,590 | 1,180 | 876 | 226 | 57 | 5 | 5 | 1 | 10 | 374 | 146 | 53 | 175 | 12 | 0 | 24 |
| Oregon | 707 | 458 | 340 | 65 | 38 | 5 | 2 | 0 | 8 | 220 | 75 | 54 | 91 | 15 | 1 | 13 |
| California | 7,456 | 6,185 | 3,818 | 1,519 | 618 | 29 | 26 | 6 | 169 | 1,175 | 627 | 240 | 308 | 36 | 2 | 58 |
| Alaska | 264 | 215 | 124 | 68 | 14 | 4 | 0 | 0 | 5 | 43 | 34 | 3 | 6 | 2 | 0 | 4 |
| Hawaii | 266 | 211 | 152 | 48 | 3 | 1 | 0 | 2 | 5 | 48 | 36 | 5 | 7 | 7 | 0 | 0 |
| Guam | 3 | 0 | 0 | 0 | 0 | 0 | 0 | 0 | 0 | 3 | 2 | 1 | 0 | 0 | 0 | 0 |
| Pacific | 10,286 | 8,249 | 5,310 | 1,926 | 730 | 44 | 33 | 9 | 197 | 1,863 | 920 | 356 | 587 | 72 | 3 | 99 |
| Puerto Rico | 263 | 186 | 144 | 33 | 3 | 1 | 1 | 2 | 2 | 64 | 57 | 4 | 3 | 9 | 1 | 3 |
| Virgin Islands | 32 | 16 | 13 | 3 | 0 | 0 | 0 | 0 | 0 | 16 | 14 | 1 | 1 | 0 | 0 | 0 |
| Outlying Areas | 295 | 202 | 157 | 36 | 3 | 1 | 1 | 2 | 2 | 80 | 71 | 5 | 4 | 9 | 1 | 3 |
| Total, all States and areas | 49,436 | 40,634 | 28,995 | 8,973 | 1,676 | 414 | 74 | 39 | 463 | 8,078 | 5,410 | 764 | 1,904 | 241 | 38 | 445 |
- 1 See Glossary for definitions of terms
- 2 The States are grouped according to the method used by the Bureau of the Census, U S Department of Commerce
836 of 837 figures sit in a row or column sum that works out. 2 cells break a sum: 'Minnesota', column 3: prints 426, columns 4 to 10 add to 406; 'West North Central', column 5: prints 484, rows 'Iowa' to 'Kansas' add to 464.
Reader’s notes
p. 190. 17 columns: stub, "All cases", 8 unfair-labor-practice columns (All C cases, CA, CB, CC, CD, CE, CG, CP), 4 representation columns (All R cases, RC, RM, RD), then UD, AC, UC. The three rightmost headings ("Union deauthorization cases", "Amendment of certification cases", "Unit clarification cases") are tall boxes sitting above a third heading level that holds only UD, AC and UC; they are repeated into the levels they span, as are "All cases" and the other single-level column labels. Suspected misprint: Minnesota, column CB reads "34" as printed, but it does not cross-foot. Minnesota's own row sums to All C cases = 406 rather than the printed 426 (which is itself consistent with the printed All cases of 639), and the West North Central CB column sums to 464 rather than the printed 484. Both discrepancies are exactly 20, so the printed value was most likely 54 with a broken or filled-in "5". Transcribed as printed ("34"); every other cell in the crop cross-foots in both directions (each state row's C components to All C cases, each row's components to All cases, and each state column to its division total). The crop is cut off below the "West North Central" line: the column rules continue past the bottom edge, so the table continues (further divisions and the national total) on this or a following page, and any footnote text for markers 1 and 2 falls outside the crop. The caption carries footnote marker 1 and the stub heading carries marker 2; no footnote text is printed on this image, so `footnotes` is empty. Scan artifacts: the typeface renders many dotted i's faintly (e.g. "Division", "Maine", "Pennsylvania", "Michigan", "Wisconsin", "Missouri", "practice", "Representation", "deauthorization", "certification", "clarification"); these are rendered with normal spelling. Row labels are followed by leader dots that stop just left of the "All cases" column; these have been dropped.
p. 191. This is a continuation page of Table 6A (the caption carries "—Continued"), covering the South Atlantic, East South Central and West South Central divisions. Column headings are printed on this page and are transcribed; the stub heading carries footnote marker 2, but no footnote texts are printed within the crop (they appear elsewhere in the table), so `footnotes` is empty. The table continues below the crop: a double rule at the bottom edge begins the next division block, whose rows are cut off. Blank spacer bands separate each division's state rows from its total line and from the next division; these carry no printed labels or values and are not transcribed as rows. The three region total rows ("South Atlantic", "East South Central", "West South Central") are printed indented in the stub; the indentation is not reproduced. Arithmetic cross-checks all pass: in every state row the C-type columns (CA+CB+CC+CD+CE+CG+CP) sum to "All C cases", RC+RM+RD sum to "All R cases", and All C + All R + UD + AC + UC sum to "All cases"; each division total row equals the column-wise sum of its state rows. No misprints detected. The scan renders dotless i's in several state names and headings (e.g. "Dıvısıon", "Vırgınıa", "Mıssıssıppı"); these are transcribed with normal spelling.
p. 192. This crop is a continuation page: no column headings are printed on it, so header_rows is empty. The table continues from earlier pages (states preceding Montana are not on this image), and the stub headings and the column rules alone define the 16 numeric columns, which I counted from the vertical rules. Column assignment check: every one of the 16 columns sums correctly to its printed subtotal for all three subtotal rows (Mountain = sum of the 8 states above it, Pacific = sum of the 6 entries above it, Outlying Areas = Puerto Rico + Virgin Islands). No arithmetic discrepancies, so I am confident each value sits in the column shown. The group subtotal labels (Mountain, Pacific, Outlying Areas) are printed indented relative to the state names; they are transcribed as plain labels. "Total, all States and areas" is flush left. Footnote wording is doubtful in two places. In footnote 1 the word read as "Glossary" renders in the scan more like "Glossasy" — I transcribed the evidently intended "Glossary". In footnote 2 the periods in "U.S." are not resolvable at this scan resolution (the spacing suggests they were printed but they do not render), and neither footnote shows a legible terminal period; I transcribed only what is visible. The scan drops the dots on many lowercase i's (e.g. "Montana", "Wyoming", "Arizona", "California", "Hawaii", "Washington", "Virgin Islands", "Puerto Rico", "Outlying Areas"); these are rendering artifacts and the labels are transcribed with normal spelling. The Pacific row's 15th column value (3) and the Puerto Rico / Virgin Islands rows sit slightly lower in their cells than neighbors but are unambiguous.
Source image
Source data: U.S. NLRB Annual Reports (public domain). Reconstruction by NLRB Stats Archive. Read by claude-opus-5 (effort max, prompt extract_v1) from the 300-dpi scan; stitched by page. Updated October 2026.