NLRB Stats Archive › Annual Reports › FY1982 › Geographic Distribution of Decertification Elections Held in Cases Closed, Fiscal 1981
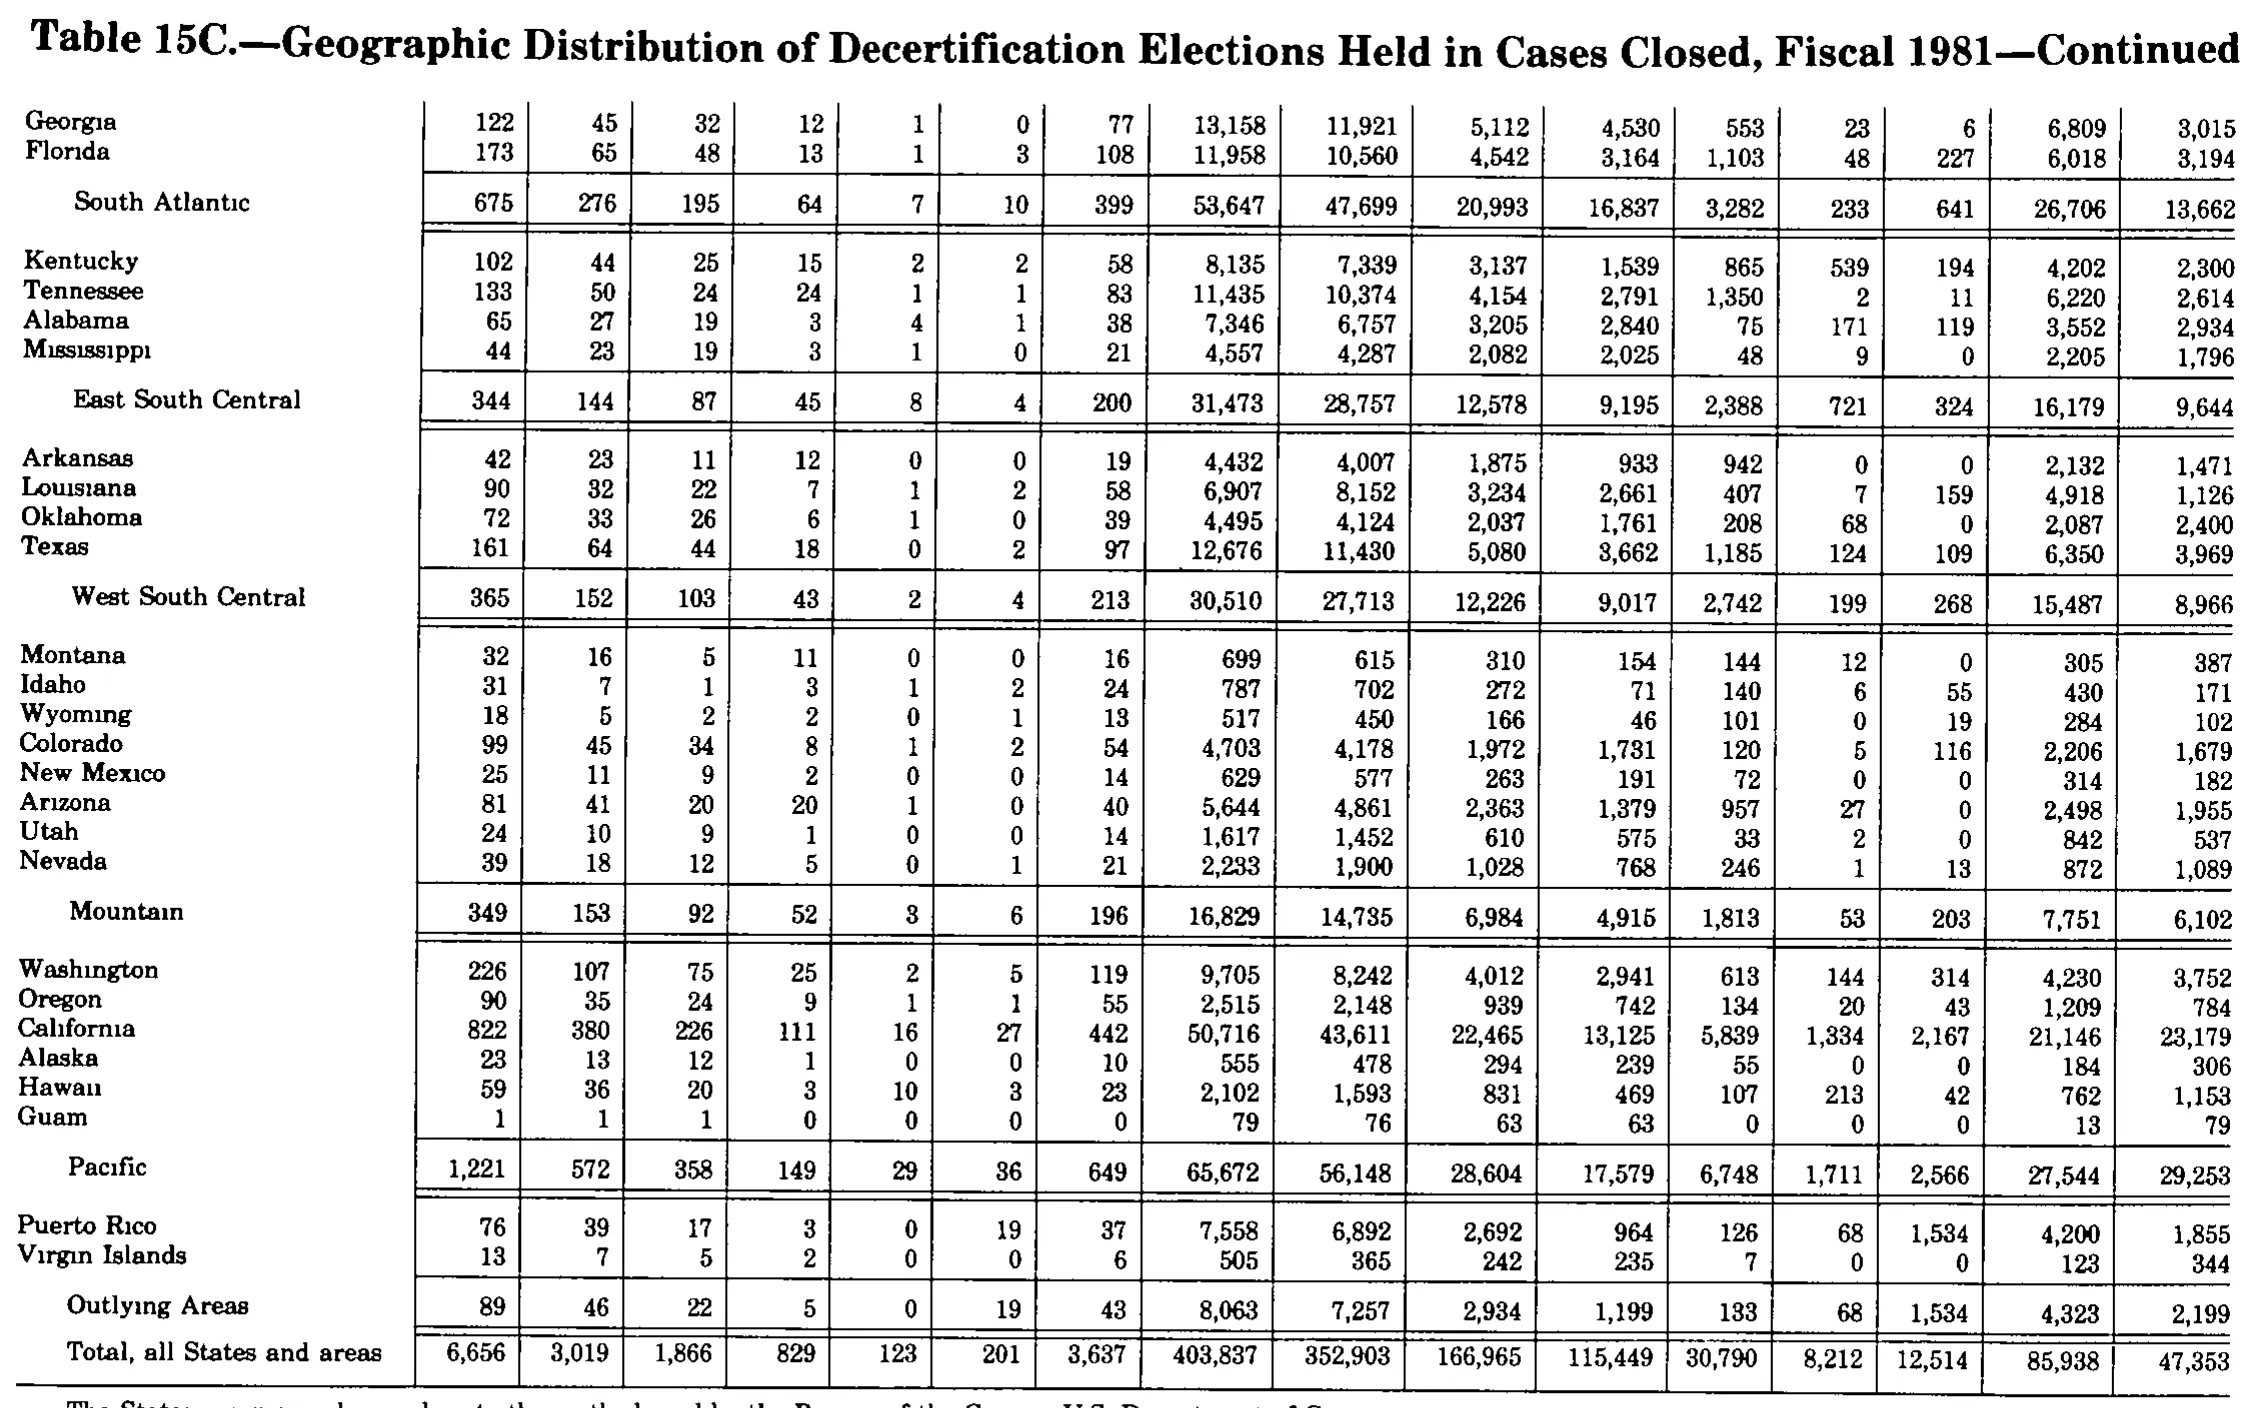
Geographic Distribution of Decertification Elections Held in Cases Closed, Fiscal 1981
| Georgia | 122 | 45 | 32 | 12 | 1 | 0 | 77 | 13,158 | 11,921 | 5,112 | 4,530 | 553 | 23 | 6 | 6,809 | 3,015 |
|---|---|---|---|---|---|---|---|---|---|---|---|---|---|---|---|---|
| Florida | 173 | 65 | 48 | 13 | 1 | 3 | 108 | 11,958 | 10,560 | 4,542 | 3,164 | 1,103 | 48 | 227 | 6,018 | 3,194 |
| South Atlantic | 675 | 276 | 195 | 64 | 7 | 10 | 399 | 53,647 | 47,699 | 20,993 | 16,837 | 3,282 | 233 | 641 | 26,706 | 13,662 |
| Kentucky | 102 | 44 | 25 | 15 | 2 | 2 | 58 | 8,135 | 7,339 | 3,137 | 1,539 | 865 | 539 | 194 | 4,202 | 2,300 |
| Tennessee | 133 | 50 | 24 | 24 | 1 | 1 | 83 | 11,435 | 10,374 | 4,154 | 2,791 | 1,350 | 2 | 11 | 6,220 | 2,614 |
| Alabama | 65 | 27 | 19 | 3 | 4 | 1 | 38 | 7,346 | 6,757 | 3,205 | 2,840 | 75 | 171 | 119 | 3,552 | 2,934 |
| Mississippi | 44 | 23 | 19 | 3 | 1 | 0 | 21 | 4,557 | 4,287 | 2,082 | 2,025 | 48 | 9 | 0 | 2,205 | 1,796 |
| East South Central | 344 | 144 | 87 | 45 | 8 | 4 | 200 | 31,473 | 28,757 | 12,578 | 9,195 | 2,388 | 721 | 324 | 16,179 | 9,644 |
| Arkansas | 42 | 23 | 11 | 12 | 0 | 0 | 19 | 4,432 | 4,007 | 1,875 | 933 | 942 | 0 | 0 | 2,132 | 1,471 |
| Louisiana | 90 | 32 | 22 | 7 | 1 | 2 | 58 | 6,907 | 8,152 | 3,234 | 2,661 | 407 | 7 | 159 | 4,918 | 1,126 |
| Oklahoma | 72 | 33 | 26 | 6 | 1 | 0 | 39 | 4,495 | 4,124 | 2,037 | 1,761 | 208 | 68 | 0 | 2,087 | 2,400 |
| Texas | 161 | 64 | 44 | 18 | 0 | 2 | 97 | 12,676 | 11,430 | 5,080 | 3,662 | 1,185 | 124 | 109 | 6,350 | 3,969 |
| West South Central | 365 | 152 | 103 | 43 | 2 | 4 | 213 | 30,510 | 27,713 | 12,226 | 9,017 | 2,742 | 199 | 268 | 15,487 | 8,966 |
| Montana | 32 | 16 | 5 | 11 | 0 | 0 | 16 | 699 | 615 | 310 | 154 | 144 | 12 | 0 | 305 | 387 |
| Idaho | 31 | 7 | 1 | 3 | 1 | 2 | 24 | 787 | 702 | 272 | 71 | 140 | 6 | 55 | 430 | 171 |
| Wyoming | 18 | 5 | 2 | 2 | 0 | 1 | 13 | 517 | 450 | 166 | 46 | 101 | 0 | 19 | 284 | 102 |
| Colorado | 99 | 45 | 34 | 8 | 1 | 2 | 54 | 4,703 | 4,178 | 1,972 | 1,731 | 120 | 5 | 116 | 2,206 | 1,679 |
| New Mexico | 25 | 11 | 9 | 2 | 0 | 0 | 14 | 629 | 577 | 263 | 191 | 72 | 0 | 0 | 314 | 182 |
| Arizona | 81 | 41 | 20 | 20 | 1 | 0 | 40 | 5,644 | 4,861 | 2,363 | 1,379 | 957 | 27 | 0 | 2,498 | 1,955 |
| Utah | 24 | 10 | 9 | 1 | 0 | 0 | 14 | 1,617 | 1,452 | 610 | 575 | 33 | 2 | 0 | 842 | 537 |
| Nevada | 39 | 18 | 12 | 5 | 0 | 1 | 21 | 2,233 | 1,900 | 1,028 | 768 | 246 | 1 | 13 | 872 | 1,089 |
| Mountain | 349 | 153 | 92 | 52 | 3 | 6 | 196 | 16,829 | 14,735 | 6,984 | 4,915 | 1,813 | 53 | 203 | 7,751 | 6,102 |
| Washington | 226 | 107 | 75 | 25 | 2 | 5 | 119 | 9,705 | 8,242 | 4,012 | 2,941 | 613 | 144 | 314 | 4,230 | 3,752 |
| Oregon | 90 | 35 | 24 | 9 | 1 | 1 | 55 | 2,515 | 2,148 | 939 | 742 | 134 | 20 | 43 | 1,209 | 784 |
| California | 822 | 380 | 226 | 111 | 16 | 27 | 442 | 50,716 | 43,611 | 22,465 | 13,125 | 5,839 | 1,334 | 2,167 | 21,146 | 23,179 |
| Alaska | 23 | 13 | 12 | 1 | 0 | 0 | 10 | 555 | 478 | 294 | 239 | 55 | 0 | 0 | 184 | 306 |
| Hawaii | 59 | 36 | 20 | 3 | 10 | 3 | 23 | 2,102 | 1,593 | 831 | 469 | 107 | 213 | 42 | 762 | 1,153 |
| Guam | 1 | 1 | 1 | 0 | 0 | 0 | 0 | 79 | 76 | 63 | 63 | 0 | 0 | 0 | 13 | 79 |
| Pacific | 1,221 | 572 | 358 | 149 | 29 | 36 | 649 | 65,672 | 56,148 | 28,604 | 17,579 | 6,748 | 1,711 | 2,566 | 27,544 | 29,253 |
| Puerto Rico | 76 | 39 | 17 | 3 | 0 | 19 | 37 | 7,558 | 6,892 | 2,692 | 964 | 126 | 68 | 1,534 | 4,200 | 1,855 |
| Virgin Islands | 13 | 7 | 5 | 2 | 0 | 0 | 6 | 505 | 365 | 242 | 235 | 7 | 0 | 0 | 123 | 344 |
| Outlying Areas | 89 | 46 | 22 | 5 | 0 | 19 | 43 | 8,063 | 7,257 | 2,934 | 1,199 | 133 | 68 | 1,534 | 4,323 | 2,199 |
| Total, all States and areas | 6,656 | 3,019 | 1,866 | 829 | 123 | 201 | 3,637 | 403,837 | 352,903 | 166,965 | 115,449 | 30,790 | 8,212 | 12,514 | 85,938 | 47,353 |
470 of 486 figures sit in a row or column sum that works out. 4 cells break a sum: 'East South Central', column 11: prints 12,578, columns 12 to 15 add to 12,628; 'Total, all States and areas', column 10: prints 352,903, the subtotals in columns 11 to 16 add to 252,903; 'East South Central', column 13: prints 2,388, rows 'Kentucky' to 'Mississippi' add to 2,338; 'West South Central', column 9: prints 30,510, rows 'Arkansas' to 'Texas' add to 28,510.
Reader’s notes
p. 332. This crop is a continuation page: no column headings are printed on it, so header_rows is empty. The grid has 16 numeric columns plus the stub, counted from the column rules and confirmed by the "Total, all States and areas" line. Column alignment was checked by summing each region's member states against its printed subtotal. East South Central, West South Central, Mountain, Pacific and Outlying Areas all reconcile exactly in every column except the two cases below, which gives high confidence that each value sits under the right column. Two apparent misprints, transcribed exactly as printed: 1. Louisiana, numeric column 8 (the column whose West South Central subtotal is 30,510): printed 6,907. Arkansas 4,432 + Louisiana 6,907 + Oklahoma 4,495 + Texas 12,676 = 28,510, which is 2,000 short of the printed 30,510; a value of 8,907 would reconcile. The cell is also anomalous because Louisiana's column-9 figure (8,152) exceeds it, whereas column 8 is larger than column 9 everywhere else in the table. The leading digit reads as a 6 in the scan, so it is left as 6,907. 2. One cell in numeric column 12 (the column whose East South Central subtotal is 2,388): Kentucky 865 + Tennessee 1,350 + Alabama 75 + Mississippi 48 = 2,338, 50 short of the printed 2,388. All four values and the subtotal read clearly in the scan, so none was adjusted; the discrepancy may be a printing error in the source or in one of these four cells (Alabama's 75 and Mississippi's 48 are the shortest and therefore the most likely to have lost a digit). A line of footnote text is printed below the body of the table but is sliced off by the bottom edge of the crop; only the upper halves of the letters survive, reading approximately "The State(s) ... are grouped according to the method used by the Bureau of the Census, U.S. Department of C...". No footnote marker is visible on it and the text cannot be read reliably, so footnotes is left empty. Several row labels show the scan's dotless-i artifact (e.g. "Georgıa", "Mıssıssıppı", "Louısıana", "Wyomıng", "Arızona", "Calıfornıa", "Hawaıı", "Puerto Rıco"); these are transcribed with ordinary "i".
Source image
Source data: U.S. NLRB Annual Reports (public domain). Reconstruction by NLRB Stats Archive. Read by claude-opus-5 (effort max, prompt extract_v1) from the 300-dpi scan; stitched by page. Updated October 2026.