NLRB Stats Archive › Annual Reports › FY1982 › Distribution of Unfair Labor Practice Situations Received, by Number of Employees in Establishments, Fiscal Year 1982
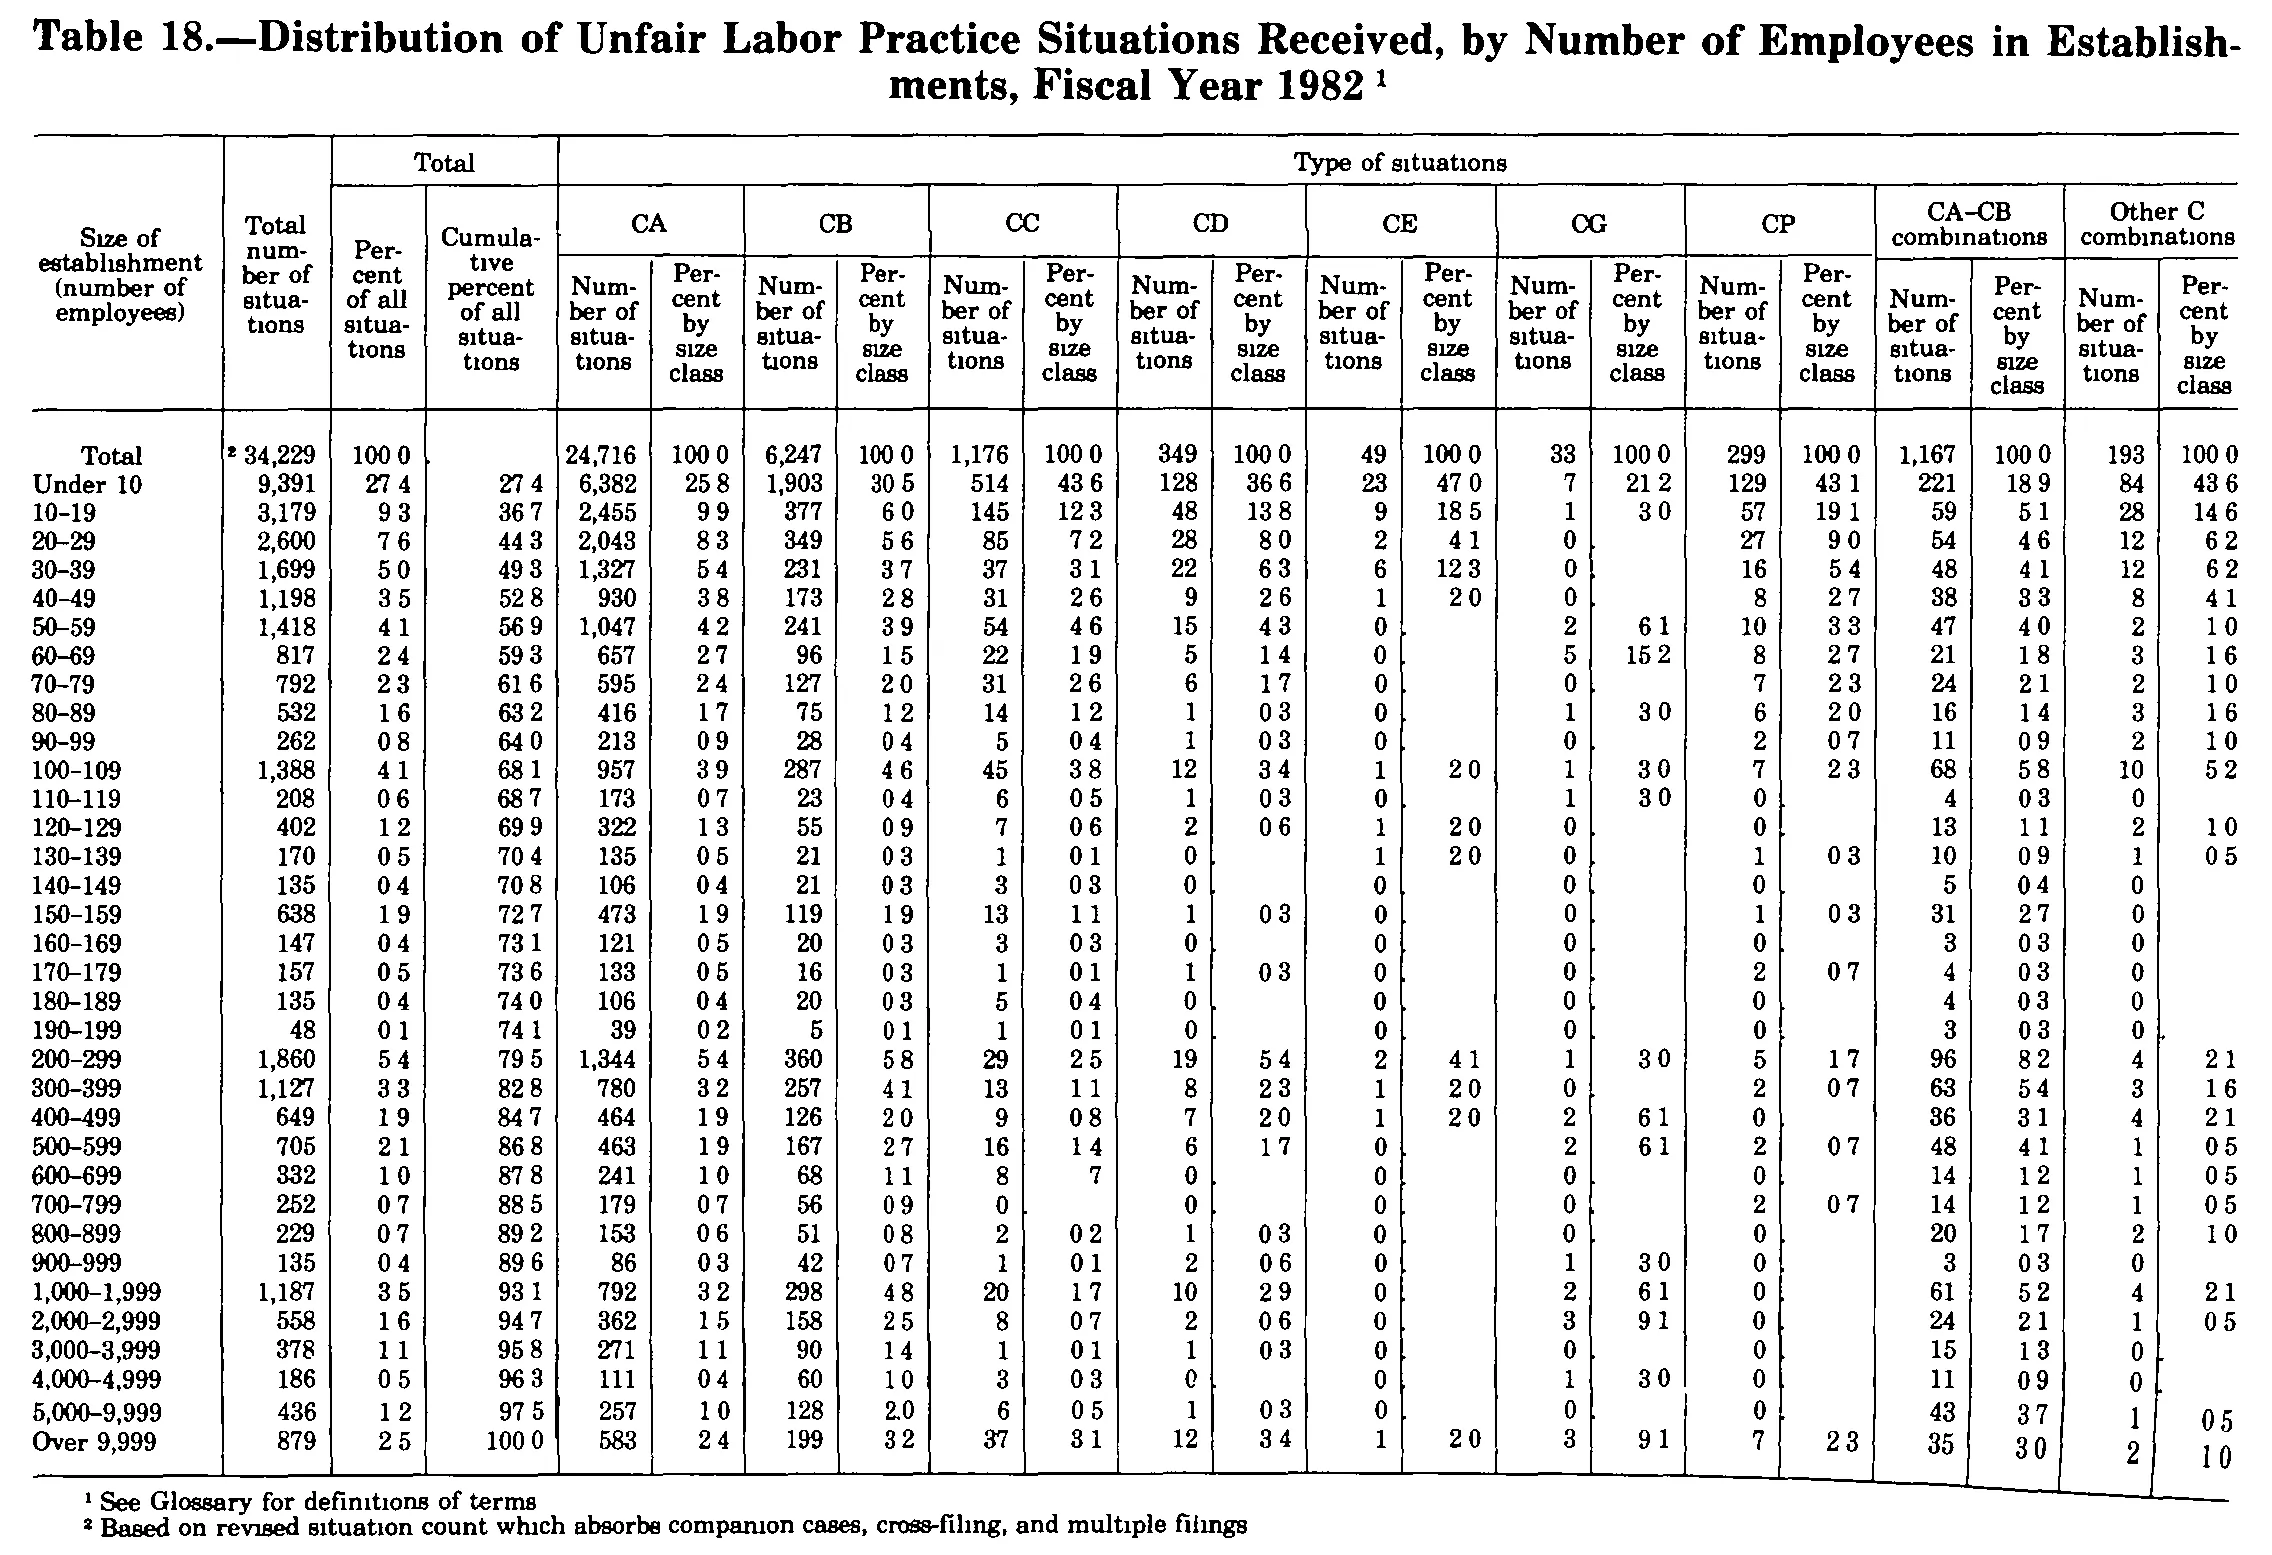
Distribution of Unfair Labor Practice Situations Received, by Number of Employees in Establishments, Fiscal Year 1982
| Size of establishment (number of employees) | Total number of situations | Total | Type of situations | ||||||||||||||||||
|---|---|---|---|---|---|---|---|---|---|---|---|---|---|---|---|---|---|---|---|---|---|
| Size of establishment (number of employees) | Total number of situations | Percent of all situations | Cumulative percent of all situations | CA | CB | CC | CD | CE | CG | CP | CA-CB combinations | Other C combinations | |||||||||
| Size of establishment (number of employees) | Total number of situations | Percent of all situations | Cumulative percent of all situations | Number of situations | Percent by size class | Number of situations | Percent by size class | Number of situations | Percent by size class | Number of situations | Percent by size class | Number of situations | Percent by size class | Number of situations | Percent by size class | Number of situations | Percent by size class | Number of situations | Percent by size class | Number of situations | Percent by size class |
| Total | 34,229 | 100.0 | 24,716 | 100.0 | 6,247 | 100.0 | 1,176 | 100.0 | 349 | 100.0 | 49 | 100.0 | 33 | 100.0 | 299 | 100.0 | 1,167 | 100.0 | 193 | 100.0 | |
| Under 10 | 9,391 | 27.4 | 27.4 | 6,382 | 25.8 | 1,903 | 30.5 | 514 | 43.6 | 128 | 36.6 | 23 | 47.0 | 7 | 21.2 | 129 | 43.1 | 221 | 18.9 | 84 | 43.6 |
| 10-19 | 3,179 | 9.3 | 36.7 | 2,455 | 9.9 | 377 | 6.0 | 145 | 12.3 | 48 | 13.8 | 9 | 18.5 | 1 | 3.0 | 57 | 19.1 | 59 | 5.1 | 28 | 14.6 |
| 20-29 | 2,600 | 7.6 | 44.3 | 2,043 | 8.3 | 349 | 5.6 | 85 | 7.2 | 28 | 8.0 | 2 | 4.1 | 0 | 27 | 9.0 | 54 | 4.6 | 12 | 6.2 | |
| 30-39 | 1,699 | 5.0 | 49.3 | 1,327 | 5.4 | 231 | 3.7 | 37 | 3.1 | 22 | 6.3 | 6 | 12.3 | 0 | 16 | 5.4 | 48 | 4.1 | 12 | 6.2 | |
| 40-49 | 1,198 | 3.5 | 52.8 | 930 | 3.8 | 173 | 2.8 | 31 | 2.6 | 9 | 2.6 | 1 | 2.0 | 0 | 8 | 2.7 | 38 | 3.3 | 8 | 4.1 | |
| 50-59 | 1,418 | 4.1 | 56.9 | 1,047 | 4.2 | 241 | 3.9 | 54 | 4.6 | 15 | 4.3 | 0 | 2 | 6.1 | 10 | 3.3 | 47 | 4.0 | 2 | 1.0 | |
| 60-69 | 817 | 2.4 | 59.3 | 657 | 2.7 | 96 | 1.5 | 22 | 1.9 | 5 | 1.4 | 0 | 5 | 15.2 | 8 | 2.7 | 21 | 1.8 | 3 | 1.6 | |
| 70-79 | 792 | 2.3 | 61.6 | 595 | 2.4 | 127 | 2.0 | 31 | 2.6 | 6 | 1.7 | 0 | 0 | 7 | 2.3 | 24 | 2.1 | 2 | 1.0 | ||
| 80-89 | 532 | 1.6 | 63.2 | 416 | 1.7 | 75 | 1.2 | 14 | 1.2 | 1 | 0.3 | 0 | 1 | 3.0 | 6 | 2.0 | 16 | 1.4 | 3 | 1.6 | |
| 90-99 | 262 | 0.8 | 64.0 | 213 | 0.9 | 28 | 0.4 | 5 | 0.4 | 1 | 0.3 | 0 | 0 | 2 | 0.7 | 11 | 0.9 | 2 | 1.0 | ||
| 100-109 | 1,388 | 4.1 | 68.1 | 957 | 3.9 | 287 | 4.6 | 45 | 3.8 | 12 | 3.4 | 1 | 2.0 | 1 | 3.0 | 7 | 2.3 | 68 | 5.8 | 10 | 5.2 |
| 110-119 | 208 | 0.6 | 68.7 | 173 | 0.7 | 23 | 0.4 | 6 | 0.5 | 1 | 0.3 | 0 | 1 | 3.0 | 0 | 4 | 0.3 | 0 | |||
| 120-129 | 402 | 1.2 | 69.9 | 322 | 1.3 | 55 | 0.9 | 7 | 0.6 | 2 | 0.6 | 1 | 2.0 | 0 | 0 | 13 | 1.1 | 2 | 1.0 | ||
| 130-139 | 170 | 0.5 | 70.4 | 135 | 0.5 | 21 | 0.3 | 1 | 0.1 | 0 | 1 | 2.0 | 0 | 1 | 0.3 | 10 | 0.9 | 1 | 0.5 | ||
| 140-149 | 135 | 0.4 | 70.8 | 106 | 0.4 | 21 | 0.3 | 3 | 0.3 | 0 | 0 | 0 | 0 | 5 | 0.4 | 0 | |||||
| 150-159 | 638 | 1.9 | 72.7 | 473 | 1.9 | 119 | 1.9 | 13 | 1.1 | 1 | 0.3 | 0 | 0 | 1 | 0.3 | 31 | 2.7 | 0 | |||
| 160-169 | 147 | 0.4 | 73.1 | 121 | 0.5 | 20 | 0.3 | 3 | 0.3 | 0 | 0 | 0 | 0 | 3 | 0.3 | 0 | |||||
| 170-179 | 157 | 0.5 | 73.6 | 133 | 0.5 | 16 | 0.3 | 1 | 0.1 | 1 | 0.3 | 0 | 0 | 2 | 0.7 | 4 | 0.3 | 0 | |||
| 180-189 | 135 | 0.4 | 74.0 | 106 | 0.4 | 20 | 0.3 | 5 | 0.4 | 0 | 0 | 0 | 0 | 4 | 0.3 | 0 | |||||
| 190-199 | 48 | 0.1 | 74.1 | 39 | 0.2 | 5 | 0.1 | 1 | 0.1 | 0 | 0 | 0 | 0 | 3 | 0.3 | 0 | |||||
| 200-299 | 1,860 | 5.4 | 79.5 | 1,344 | 5.4 | 360 | 5.8 | 29 | 2.5 | 19 | 5.4 | 2 | 4.1 | 1 | 3.0 | 5 | 1.7 | 96 | 8.2 | 4 | 2.1 |
| 300-399 | 1,127 | 3.3 | 82.8 | 780 | 3.2 | 257 | 4.1 | 13 | 1.1 | 8 | 2.3 | 1 | 2.0 | 0 | 2 | 0.7 | 63 | 5.4 | 3 | 1.6 | |
| 400-499 | 649 | 1.9 | 84.7 | 464 | 1.9 | 126 | 2.0 | 9 | 0.8 | 7 | 2.0 | 1 | 2.0 | 2 | 6.1 | 0 | 36 | 3.1 | 4 | 2.1 | |
| 500-599 | 705 | 2.1 | 86.8 | 463 | 1.9 | 167 | 2.7 | 16 | 1.4 | 6 | 1.7 | 0 | 2 | 6.1 | 2 | 0.7 | 48 | 4.1 | 1 | 0.5 | |
| 600-699 | 332 | 1.0 | 87.8 | 241 | 1.0 | 68 | 1.1 | 8 | .7 | 0 | 0 | 0 | 0 | 14 | 1.2 | 1 | 0.5 | ||||
| 700-799 | 252 | 0.7 | 88.5 | 179 | 0.7 | 56 | 0.9 | 0 | 0 | 0 | 0 | 2 | 0.7 | 14 | 1.2 | 1 | 0.5 | ||||
| 800-899 | 229 | 0.7 | 89.2 | 153 | 0.6 | 51 | 0.8 | 2 | 0.2 | 1 | 0.3 | 0 | 0 | 0 | 20 | 1.7 | 2 | 1.0 | |||
| 900-999 | 135 | 0.4 | 89.6 | 86 | 0.3 | 42 | 0.7 | 1 | 0.1 | 2 | 0.6 | 0 | 1 | 3.0 | 0 | 3 | 0.3 | 0 | |||
| 1,000-1,999 | 1,187 | 3.5 | 93.1 | 792 | 3.2 | 298 | 4.8 | 20 | 1.7 | 10 | 2.9 | 0 | 2 | 6.1 | 0 | 61 | 5.2 | 4 | 2.1 | ||
| 2,000-2,999 | 558 | 1.6 | 94.7 | 362 | 1.5 | 158 | 2.5 | 8 | 0.7 | 2 | 0.6 | 0 | 3 | 9.1 | 0 | 24 | 2.1 | 1 | 0.5 | ||
| 3,000-3,999 | 378 | 1.1 | 95.8 | 271 | 1.1 | 90 | 1.4 | 1 | 0.1 | 1 | 0.3 | 0 | 0 | 0 | 15 | 1.3 | 0 | ||||
| 4,000-4,999 | 186 | 0.5 | 96.3 | 111 | 0.4 | 60 | 1.0 | 3 | 0.3 | 0 | 0 | 1 | 3.0 | 0 | 11 | 0.9 | 0 | ||||
| 5,000-9,999 | 436 | 1.2 | 97.5 | 257 | 1.0 | 128 | 2.0 | 6 | 0.5 | 1 | 0.3 | 0 | 0 | 0 | 43 | 3.7 | 1 | 0.5 | |||
| Over 9,999 | 879 | 2.5 | 100.0 | 583 | 2.4 | 199 | 3.2 | 37 | 3.1 | 12 | 3.4 | 1 | 2.0 | 3 | 9.1 | 7 | 2.3 | 35 | 3.0 | 2 | 1.0 |
- 1 See Glossary for definitions of terms
- 2 Based on revised situation count which absorbs companion cases, cross-filing, and multiple filings
275 of 275 figures sit in a row or column sum that works out.
Reader’s notes
p. 324. Grid is 22 columns: stub; Total number of situations; Total (Percent of all situations, Cumulative percent of all situations); then Type of situations as nine Number/Percent pairs (CA, CB, CC, CD, CE, CG, CP, CA-CB combinations, Other C combinations). Decimal points: in this 1-bit scan the periods in the one-decimal percent figures are mostly dropped, so cells render as "100 0", "27 4", "15 2". They are decimals — the spacing is uniform and the CB percent for 5,000-9,999 still shows its period clearly as "2.0" — so I restored the decimal point in every percent cell. No other characters were added. Doubtful cell: row "600-699", CC "Percent by size class" shows only a right-aligned "7" with no visible leading zero, transcribed as ".7". Every other sub-1 value in the table is printed "0.x", so the leading "0" is probably present in the original and lost in this scan. Blank cells: the Total row has nothing printed under "Cumulative percent of all situations". Throughout the body, a count of 0 is normally printed with its percent cell left empty; those percent cells are "". Counts printed as 0 are kept as "0". Footnote marker: in the Total row the raised 2 is printed before the figure (²34,229); recorded as "34,229^2". Crop/scan artifact: a diagonal page-edge line crosses the lower right of the image, passing through the CA-CB and Other C combinations columns in the last several rows and clipping the bottom rule. The digits there are still legible — 5,000-9,999 Other C = 1 / 0.5 and Over 9,999 Other C = 2 / 1.0 — but those two percent values sit slightly low relative to their rows. Row-label ranges are printed with a short dash; transcribed as plain hyphens ("10-19", "1,000-1,999"). Neither footnote ends with a period in the print. Column totals were not checked against the printed Total row; nothing was computed or corrected.
Source image
Source data: U.S. NLRB Annual Reports (public domain). Reconstruction by NLRB Stats Archive. Read by claude-opus-5 (effort max, prompt extract_v1) from the 300-dpi scan; stitched by page. Updated October 2026.