NLRB Stats Archive › Annual Reports › FY1982 › Industrial Distribution of Representation Elections Held in Cases Closed, Fiscal Year 1982
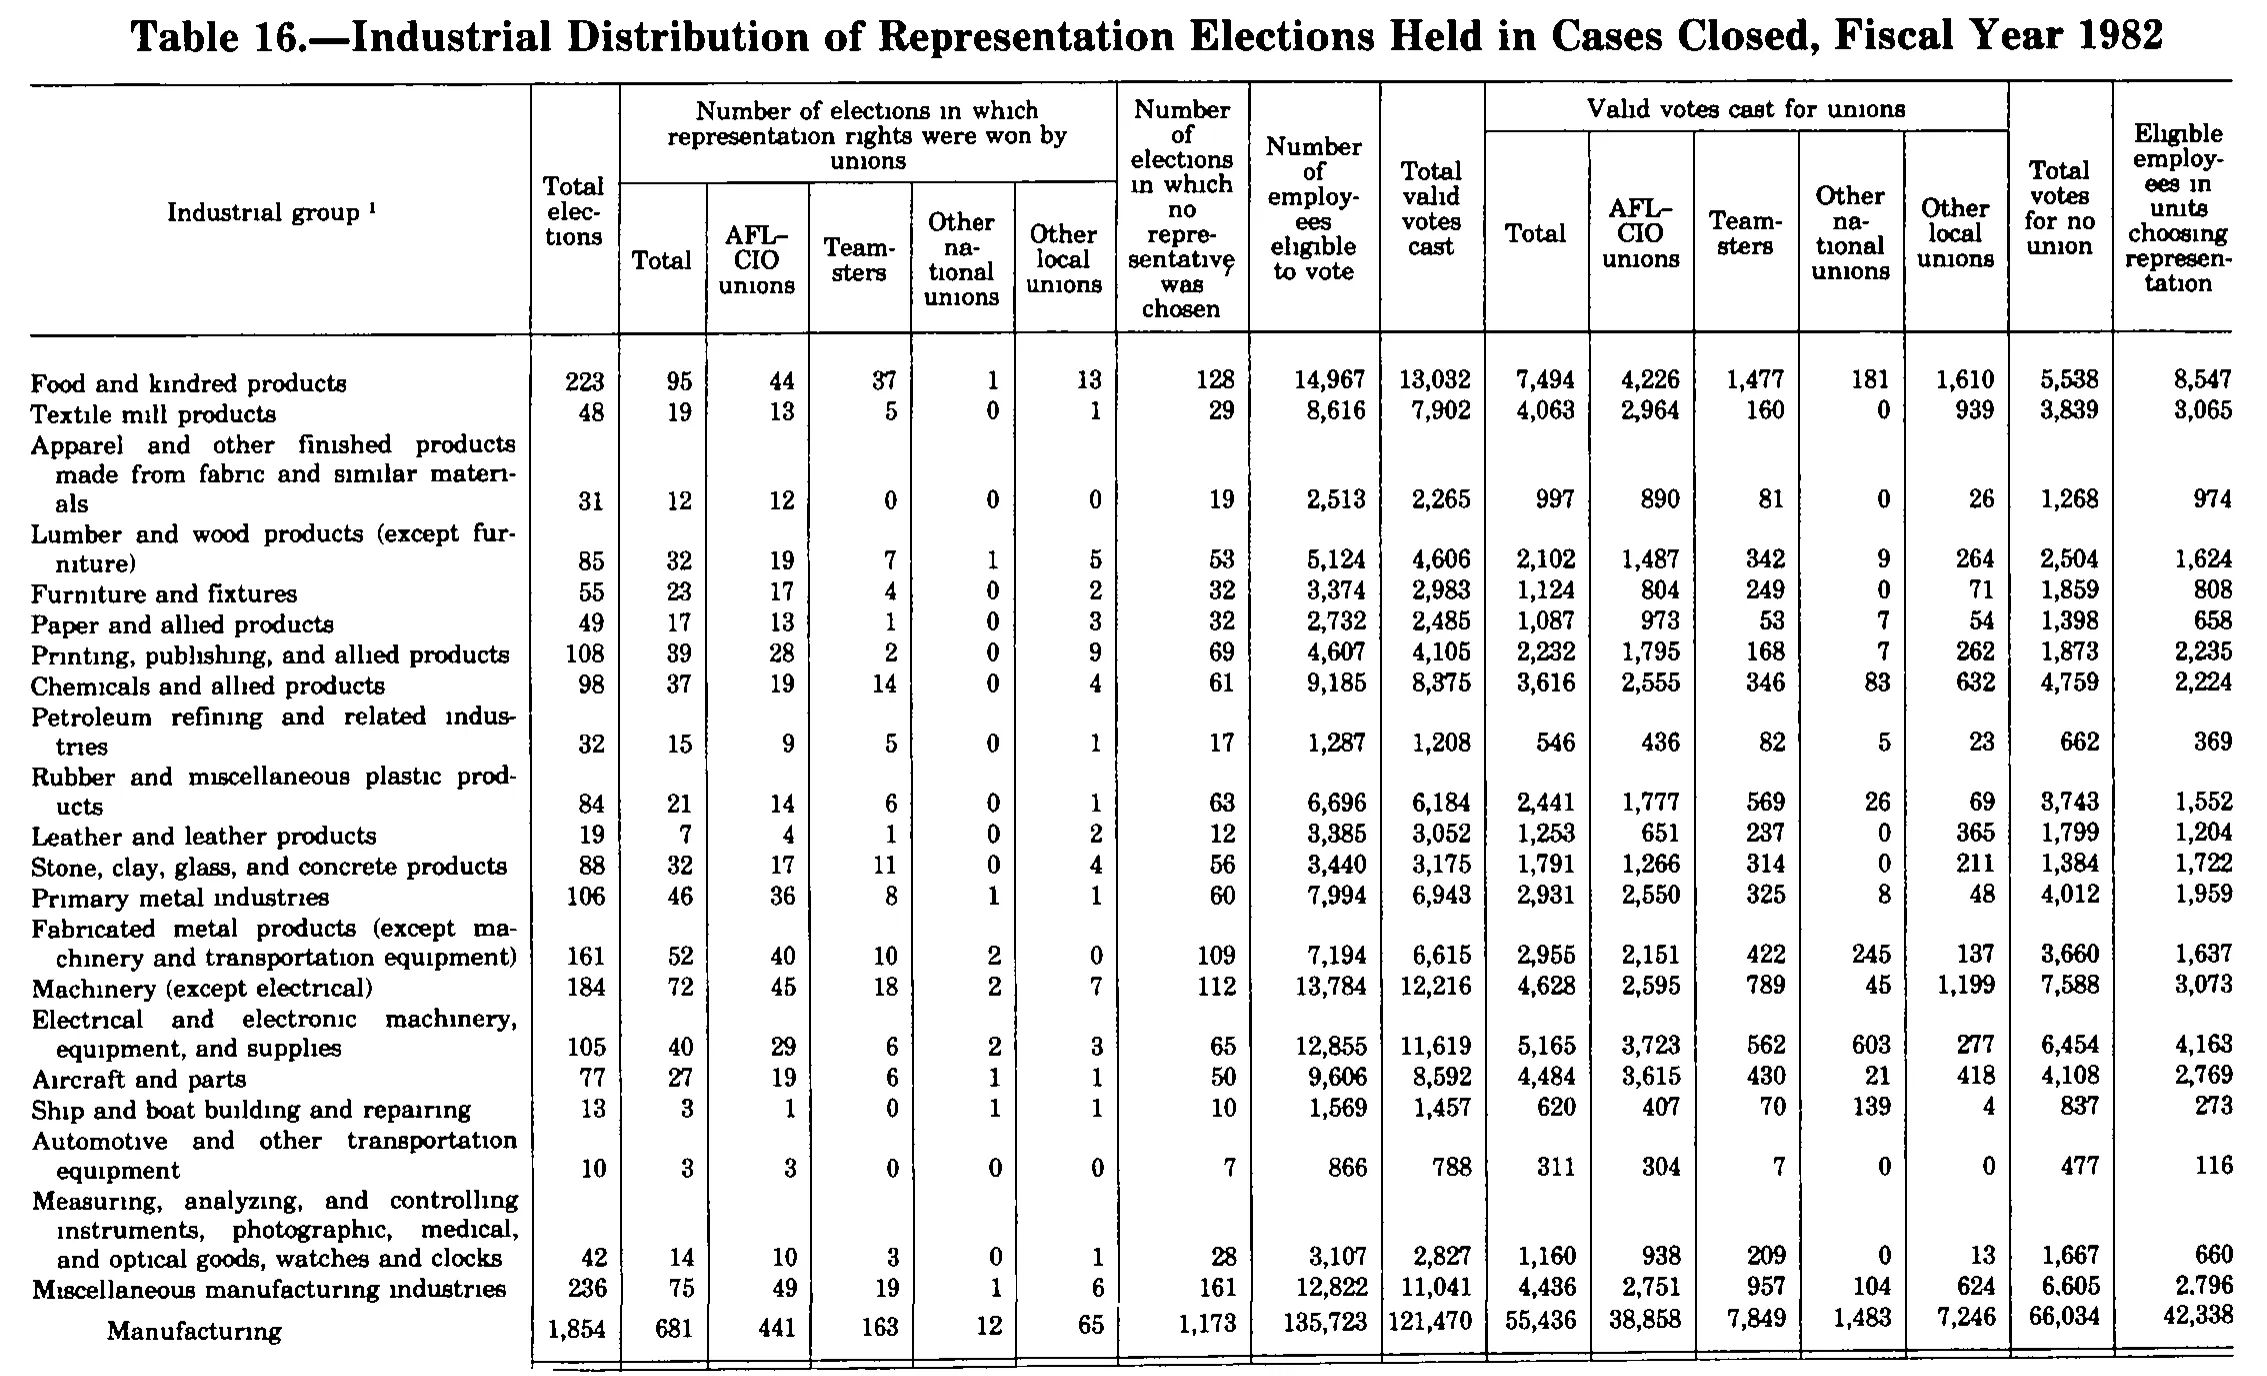
Industrial Distribution of Representation Elections Held in Cases Closed, Fiscal Year 1982
Stitched from pp. 319–321.
| Industrial group | Total elections | Number of elections in which representation rights were won by unions | Number of elections in which no representative was chosen | Number of employees eligible to vote | Total valid votes cast | Valid votes cast for unions | Total votes for no union | Eligible employees in units choosing representation | ||||||||
|---|---|---|---|---|---|---|---|---|---|---|---|---|---|---|---|---|
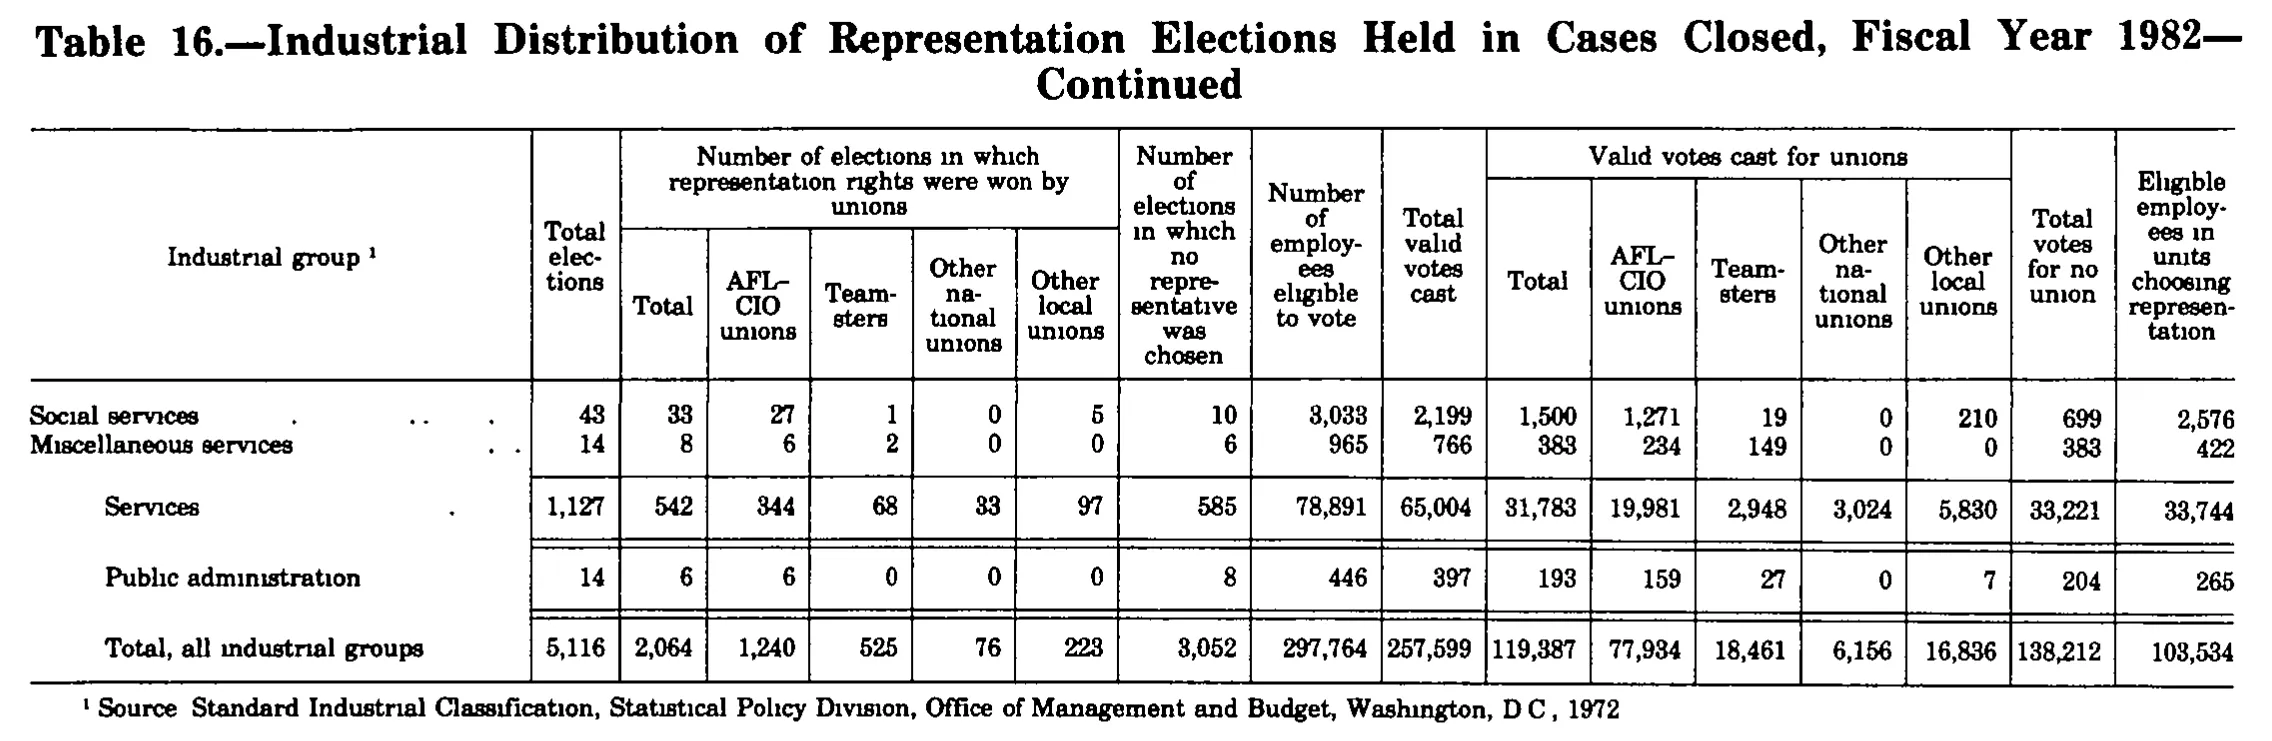
| Industrial group | Total elections | Total | AFL-CIO unions | Teamsters | Other national unions | Other local unions | Number of elections in which no representative was chosen | Number of employees eligible to vote | Total valid votes cast | Total | AFL-CIO unions | Teamsters | Other national unions | Other local unions | Total votes for no union | Eligible employees in units choosing representation |
| Food and kindred products | 223 | 95 | 44 | 37 | 1 | 13 | 128 | 14,967 | 13,032 | 7,494 | 4,226 | 1,477 | 181 | 1,610 | 5,538 | 8,547 |
| Textile mill products | 48 | 19 | 13 | 5 | 0 | 1 | 29 | 8,616 | 7,902 | 4,063 | 2,964 | 160 | 0 | 939 | 3,839 | 3,065 |
| Apparel and other finished products made from fabric and similar materials | 31 | 12 | 12 | 0 | 0 | 0 | 19 | 2,513 | 2,265 | 997 | 890 | 81 | 0 | 26 | 1,268 | 974 |
| Lumber and wood products (except furniture) | 85 | 32 | 19 | 7 | 1 | 5 | 53 | 5,124 | 4,606 | 2,102 | 1,487 | 342 | 9 | 264 | 2,504 | 1,624 |
| Furniture and fixtures | 55 | 23 | 17 | 4 | 0 | 2 | 32 | 3,374 | 2,983 | 1,124 | 804 | 249 | 0 | 71 | 1,859 | 808 |
| Paper and allied products | 49 | 17 | 13 | 1 | 0 | 3 | 32 | 2,732 | 2,485 | 1,087 | 973 | 53 | 7 | 54 | 1,398 | 658 |
| Printing, publishing, and allied products | 108 | 39 | 28 | 2 | 0 | 9 | 69 | 4,607 | 4,105 | 2,232 | 1,795 | 168 | 7 | 262 | 1,873 | 2,235 |
| Chemicals and allied products | 98 | 37 | 19 | 14 | 0 | 4 | 61 | 9,185 | 8,375 | 3,616 | 2,555 | 346 | 83 | 632 | 4,759 | 2,224 |
| Petroleum refining and related industries | 32 | 15 | 9 | 5 | 0 | 1 | 17 | 1,287 | 1,208 | 546 | 436 | 82 | 5 | 23 | 662 | 369 |
| Rubber and miscellaneous plastic products | 84 | 21 | 14 | 6 | 0 | 1 | 63 | 6,696 | 6,184 | 2,441 | 1,777 | 569 | 26 | 69 | 3,743 | 1,552 |
| Leather and leather products | 19 | 7 | 4 | 1 | 0 | 2 | 12 | 3,385 | 3,052 | 1,253 | 651 | 237 | 0 | 365 | 1,799 | 1,204 |
| Stone, clay, glass, and concrete products | 88 | 32 | 17 | 11 | 0 | 4 | 56 | 3,440 | 3,175 | 1,791 | 1,266 | 314 | 0 | 211 | 1,384 | 1,722 |
| Primary metal industries | 106 | 46 | 36 | 8 | 1 | 1 | 60 | 7,994 | 6,943 | 2,931 | 2,550 | 325 | 8 | 48 | 4,012 | 1,959 |
| Fabricated metal products (except machinery and transportation equipment) | 161 | 52 | 40 | 10 | 2 | 0 | 109 | 7,194 | 6,615 | 2,955 | 2,151 | 422 | 245 | 137 | 3,660 | 1,637 |
| Machinery (except electrical) | 184 | 72 | 45 | 18 | 2 | 7 | 112 | 13,784 | 12,216 | 4,628 | 2,595 | 789 | 45 | 1,199 | 7,588 | 3,073 |
| Electrical and electronic machinery, equipment, and supplies | 105 | 40 | 29 | 6 | 2 | 3 | 65 | 12,855 | 11,619 | 5,165 | 3,723 | 562 | 603 | 277 | 6,454 | 4,163 |
| Aircraft and parts | 77 | 27 | 19 | 6 | 1 | 1 | 50 | 9,606 | 8,592 | 4,484 | 3,615 | 430 | 21 | 418 | 4,108 | 2,769 |
| Ship and boat building and repairing | 13 | 3 | 1 | 0 | 1 | 1 | 10 | 1,569 | 1,457 | 620 | 407 | 70 | 139 | 4 | 837 | 273 |
| Automotive and other transportation equipment | 10 | 3 | 3 | 0 | 0 | 0 | 7 | 866 | 788 | 311 | 304 | 7 | 0 | 0 | 477 | 116 |
| Measuring, analyzing, and controlling instruments, photographic, medical, and optical goods, watches and clocks | 42 | 14 | 10 | 3 | 0 | 1 | 28 | 3,107 | 2,827 | 1,160 | 938 | 209 | 0 | 13 | 1,667 | 660 |
| Miscellaneous manufacturing industries | 236 | 75 | 49 | 19 | 1 | 6 | 161 | 12,822 | 11,041 | 4,436 | 2,751 | 957 | 104 | 624 | 6,605 | 2.796 |
| Manufacturing | 1,854 | 681 | 441 | 163 | 12 | 65 | 1,173 | 135,723 | 121,470 | 55,436 | 38,858 | 7,849 | 1,483 | 7,246 | 66,034 | 42,338 |
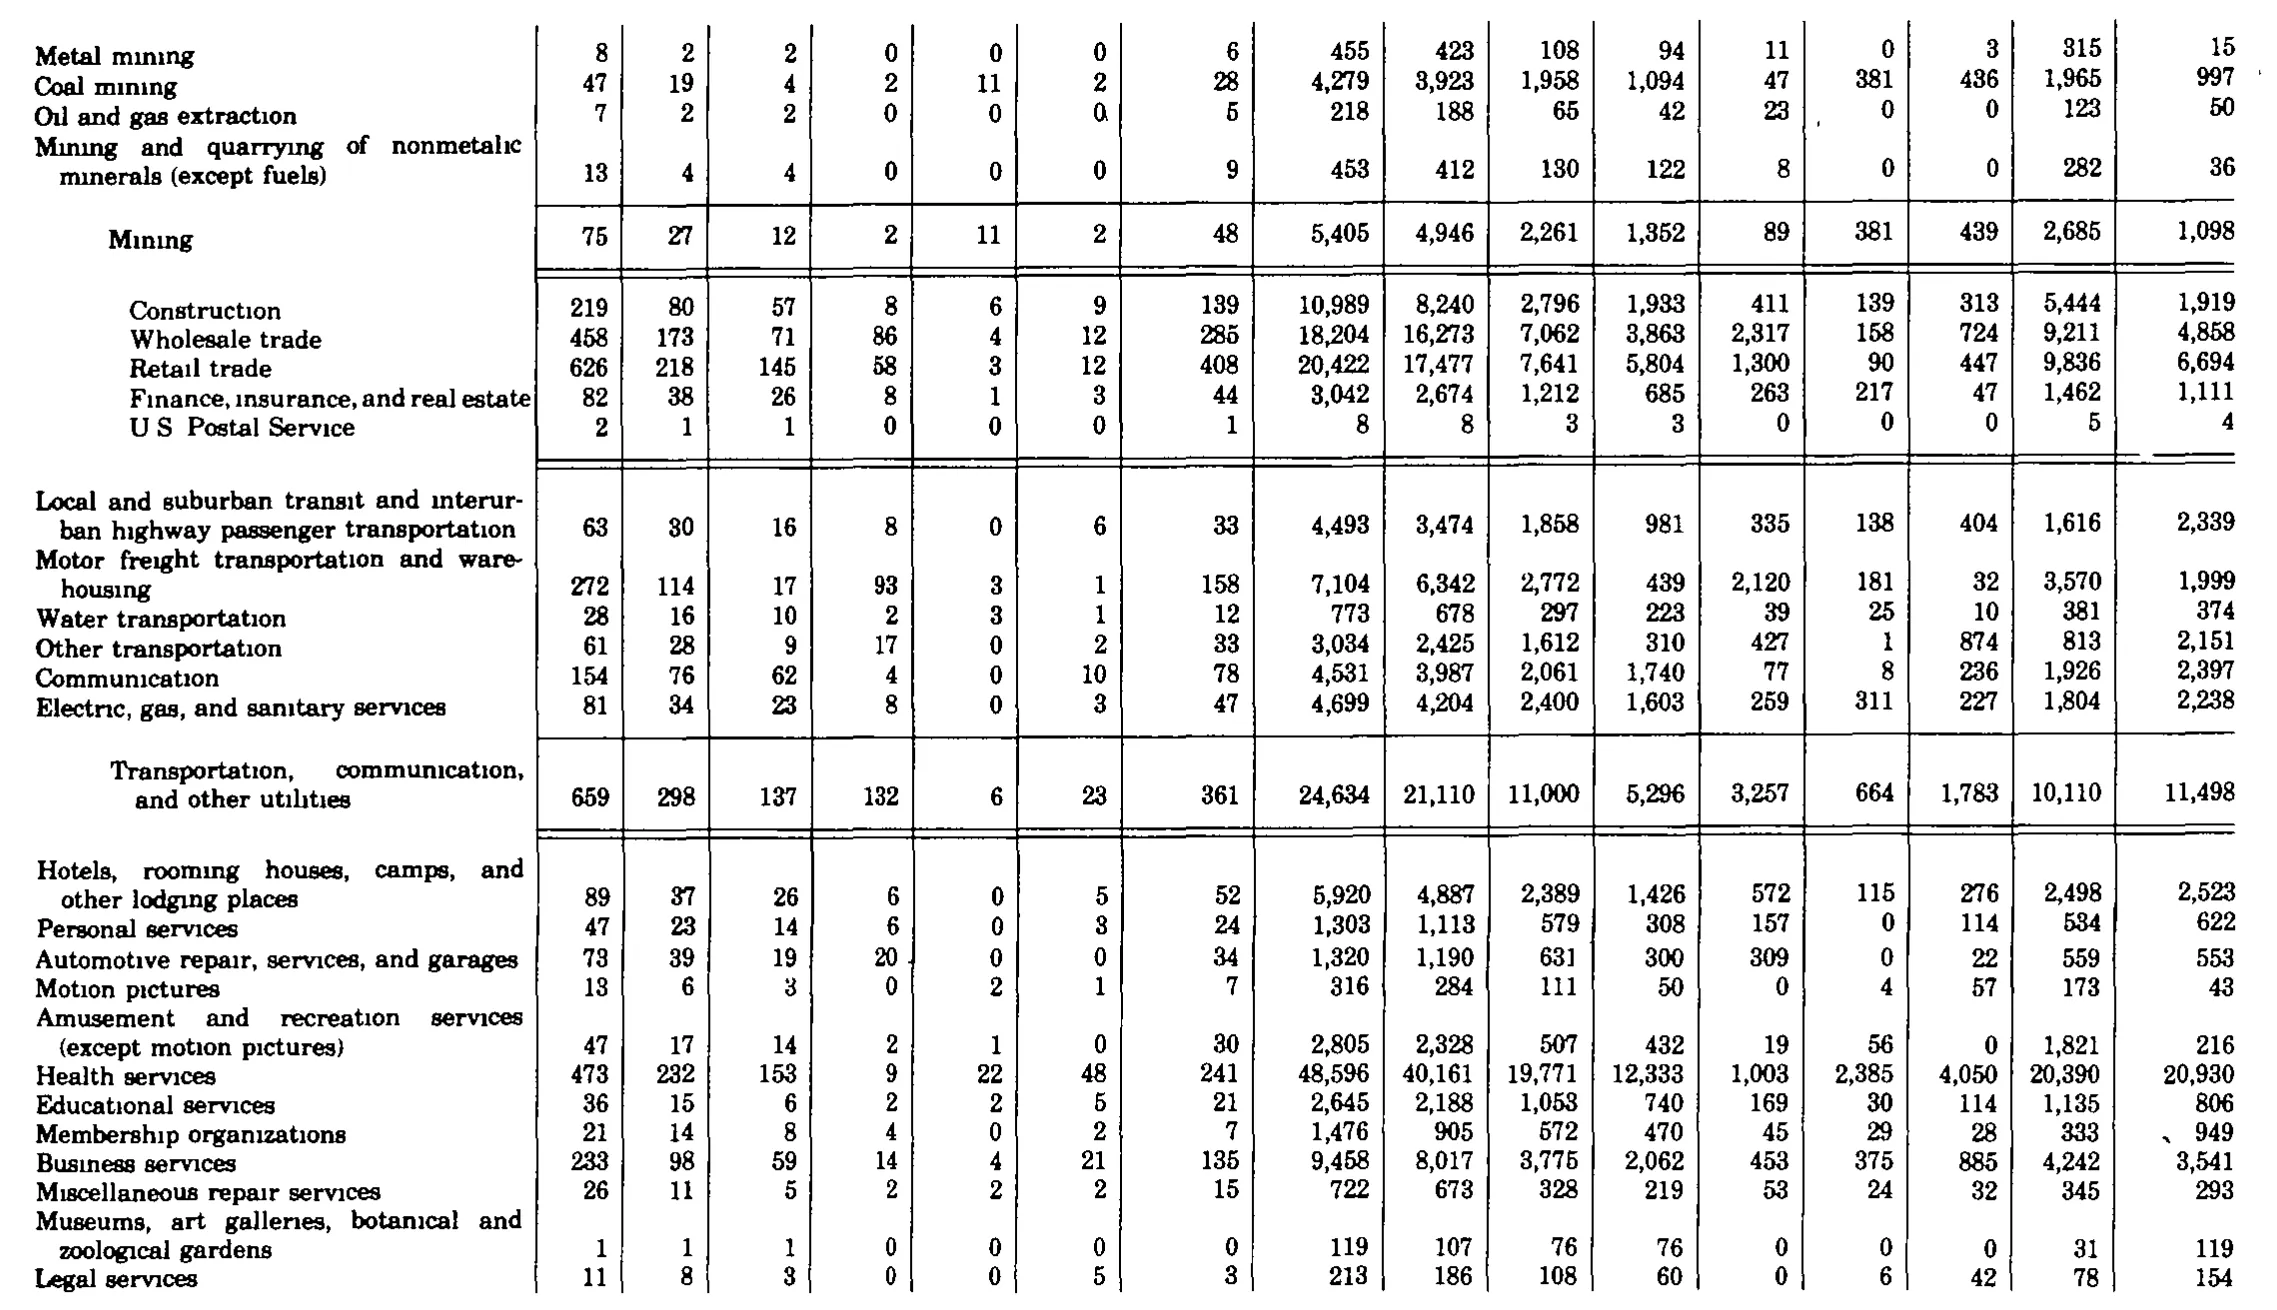
| Metal mining | 8 | 2 | 2 | 0 | 0 | 0 | 6 | 455 | 423 | 108 | 94 | 11 | 0 | 3 | 315 | 15 |
| Coal mining | 47 | 19 | 4 | 2 | 11 | 2 | 28 | 4,279 | 3,923 | 1,958 | 1,094 | 47 | 381 | 436 | 1,965 | 997 |
| Oil and gas extraction | 7 | 2 | 2 | 0 | 0 | 0 | 5 | 218 | 188 | 65 | 42 | 23 | 0 | 0 | 123 | 50 |
| Mining and quarrying of nonmetalic minerals (except fuels) | 13 | 4 | 4 | 0 | 0 | 0 | 9 | 453 | 412 | 130 | 122 | 8 | 0 | 0 | 282 | 36 |
| Mining | 75 | 27 | 12 | 2 | 11 | 2 | 48 | 5,405 | 4,946 | 2,261 | 1,352 | 89 | 381 | 439 | 2,685 | 1,098 |
| Construction | 219 | 80 | 57 | 8 | 6 | 9 | 139 | 10,989 | 8,240 | 2,796 | 1,933 | 411 | 139 | 313 | 5,444 | 1,919 |
| Wholesale trade | 458 | 173 | 71 | 86 | 4 | 12 | 285 | 18,204 | 16,273 | 7,062 | 3,863 | 2,317 | 158 | 724 | 9,211 | 4,858 |
| Retail trade | 626 | 218 | 145 | 58 | 3 | 12 | 408 | 20,422 | 17,477 | 7,641 | 5,804 | 1,300 | 90 | 447 | 9,836 | 6,694 |
| Finance, insurance, and real estate | 82 | 38 | 26 | 8 | 1 | 3 | 44 | 3,042 | 2,674 | 1,212 | 685 | 263 | 217 | 47 | 1,462 | 1,111 |
| U S Postal Service | 2 | 1 | 1 | 0 | 0 | 0 | 1 | 8 | 8 | 3 | 3 | 0 | 0 | 0 | 5 | 4 |
| Local and suburban transit and interurban highway passenger transportation | 63 | 30 | 16 | 8 | 0 | 6 | 33 | 4,493 | 3,474 | 1,858 | 981 | 335 | 138 | 404 | 1,616 | 2,339 |
| Motor freight transportation and warehousing | 272 | 114 | 17 | 93 | 3 | 1 | 158 | 7,104 | 6,342 | 2,772 | 439 | 2,120 | 181 | 32 | 3,570 | 1,999 |
| Water transportation | 28 | 16 | 10 | 2 | 3 | 1 | 12 | 773 | 678 | 297 | 223 | 39 | 25 | 10 | 381 | 374 |
| Other transportation | 61 | 28 | 9 | 17 | 0 | 2 | 33 | 3,034 | 2,425 | 1,612 | 310 | 427 | 1 | 874 | 813 | 2,151 |
| Communication | 154 | 76 | 62 | 4 | 0 | 10 | 78 | 4,531 | 3,987 | 2,061 | 1,740 | 77 | 8 | 236 | 1,926 | 2,397 |
| Electric, gas, and sanitary services | 81 | 34 | 23 | 8 | 0 | 3 | 47 | 4,699 | 4,204 | 2,400 | 1,603 | 259 | 311 | 227 | 1,804 | 2,238 |
| Transportation, communication, and other utilities | 659 | 298 | 137 | 132 | 6 | 23 | 361 | 24,634 | 21,110 | 11,000 | 5,296 | 3,257 | 664 | 1,783 | 10,110 | 11,498 |
| Hotels, rooming houses, camps, and other lodging places | 89 | 37 | 26 | 6 | 0 | 5 | 52 | 5,920 | 4,887 | 2,389 | 1,426 | 572 | 115 | 276 | 2,498 | 2,523 |
| Personal services | 47 | 23 | 14 | 6 | 0 | 3 | 24 | 1,303 | 1,113 | 579 | 308 | 157 | 0 | 114 | 534 | 622 |
| Automotive repair, services, and garages | 73 | 39 | 19 | 20 | 0 | 0 | 34 | 1,320 | 1,190 | 631 | 300 | 309 | 0 | 22 | 559 | 553 |
| Motion pictures | 13 | 6 | 3 | 0 | 2 | 1 | 7 | 316 | 284 | 111 | 50 | 0 | 4 | 57 | 173 | 43 |
| Amusement and recreation services (except motion pictures) | 47 | 17 | 14 | 2 | 1 | 0 | 30 | 2,805 | 2,328 | 507 | 432 | 19 | 56 | 0 | 1,821 | 216 |
| Health services | 473 | 232 | 153 | 9 | 22 | 48 | 241 | 48,596 | 40,161 | 19,771 | 12,333 | 1,003 | 2,385 | 4,050 | 20,390 | 20,930 |
| Educational services | 36 | 15 | 6 | 2 | 2 | 5 | 21 | 2,645 | 2,188 | 1,053 | 740 | 169 | 30 | 114 | 1,135 | 806 |
| Membership organizations | 21 | 14 | 8 | 4 | 0 | 2 | 7 | 1,476 | 905 | 572 | 470 | 45 | 29 | 28 | 333 | 949 |
| Business services | 233 | 98 | 59 | 14 | 4 | 21 | 135 | 9,458 | 8,017 | 3,775 | 2,062 | 453 | 375 | 885 | 4,242 | 3,541 |
| Miscellaneous repair services | 26 | 11 | 5 | 2 | 2 | 2 | 15 | 722 | 673 | 328 | 219 | 53 | 24 | 32 | 345 | 293 |
| Museums, art galleries, botanical and zoological gardens | 1 | 1 | 1 | 0 | 0 | 0 | 0 | 119 | 107 | 76 | 76 | 0 | 0 | 0 | 31 | 119 |
| Legal services | 11 | 8 | 3 | 0 | 0 | 5 | 3 | 213 | 186 | 108 | 60 | 0 | 6 | 42 | 78 | 154 |
| Social services | 43 | 33 | 27 | 1 | 0 | 5 | 10 | 3,033 | 2,199 | 1,500 | 1,271 | 19 | 0 | 210 | 699 | 2,576 |
| Miscellaneous services | 14 | 8 | 6 | 2 | 0 | 0 | 6 | 965 | 766 | 383 | 234 | 149 | 0 | 0 | 383 | 422 |
| Services | 1,127 | 542 | 344 | 68 | 33 | 97 | 585 | 78,891 | 65,004 | 31,783 | 19,981 | 2,948 | 3,024 | 5,830 | 33,221 | 33,744 |
| Public administration | 14 | 6 | 6 | 0 | 0 | 0 | 8 | 446 | 397 | 193 | 159 | 27 | 0 | 7 | 204 | 265 |
| Total, all industrial groups | 5,116 | 2,064 | 1,240 | 525 | 76 | 223 | 3,052 | 297,764 | 257,599 | 119,387 | 77,934 | 18,461 | 6,156 | 16,836 | 138,212 | 103,534 |
- 1 Source: Standard Industrial Classification, Statistical Policy Division, Office of Management and Budget, Washington, D.C., 1972
771 of 814 figures sit in a row or column sum that works out. 2 cells break a sum: 'Services', column 17: prints 33,744, rows 'Hotels, rooming hous' to 'Miscellaneous servic' add to 33,747; 'Total, all industrial groups', column 17: prints 103,534, the subtotals in rows 'Manufacturing' to 'Public administratio' add to 103,529.
Reader’s notes
p. 319. The crop ends after the "Manufacturing" subtotal row; the table itself continues (nonmanufacturing industries and a grand total) on the following page, so the body here is partial. The stub heading carries footnote marker 1 ("Industrial group 1"), but no footnote text is printed on this crop — it presumably appears at the end of the table on a later page, hence the empty `footnotes` list. Doubtful cell: "Miscellaneous manufacturing industries", last column ("Eligible employees in units choosing representation") is printed as "2.796" with what looks like a period rather than the digit-grouping comma used everywhere else in the table; transcribed as printed, but it is almost certainly a misprint or a scan artifact for "2,796". The two "Total" subheads (column 3 under "Number of elections in which representation rights were won by unions" and column 11 under "Valid votes cast for unions") are distinct columns from the stub-adjacent "Total elections" column; column placement was checked against the vertical rules. Original print quality renders the dotted "i" faintly (e.g. "kindred", "unions"), but no character was ambiguous apart from the cell named above.
p. 320. Continuation page: no column headings are printed on this crop, so header_rows is empty. The grid has 17 columns (stub plus 16 data columns); the column rules are clear and the group break falls after data column 7. Arithmetic cross-checks confirm the column alignment: the "Mining" row equals the sum of the four mining industry rows in all 16 columns, and the "Transportation, communication, and other utilities" row equals the sum of its six industry rows in all 16 columns. Within every row, data column 2 equals the sum of columns 3-6, column 1 equals column 2 plus column 7, column 10 equals the sum of columns 11-14, and column 9 equals column 10 plus column 15. No printed figure conflicts with these relations. Doubtful text (not numbers): the stub label for the fourth mining row prints as "nonmetalic" in this scan; the standard wording is "nonmetallic" and the doubled "l" may simply be lost in the 1-bit scan. Likewise "U S Postal Service" shows no legible periods; the original almost certainly prints "U.S.". Both are transcribed as seen. Stray ink, not digits: in the "Oil and gas extraction" row there is a speck after the 0 in data column 6 (transcribed as 0) and a comma-like speck in the gutter between data columns 12 and 13; in the "Membership organizations" row a small tick sits to the left of 949 in the last column. None are footnote markers. The table continues above and below the crop: the first industry group's heading and earlier rows are on the preceding page, and the body runs on past "Legal services" at the bottom edge. No footnotes appear on this crop.
p. 321. This is the final ("—Continued") page of Table 16; the table body begins on earlier pages, so only the last rows appear here. Column headings are printed on this page and are transcribed in full. 17 columns: stub, "Total elections", five columns under "Number of elections in which representation rights were won by unions", three tall single columns, five columns under "Valid votes cast for unions", then "Total votes for no union" and "Eligible employees in units choosing representation". Row indentation as printed: "Social services" and "Miscellaneous services" are flush-left component lines; "Services" is indented as the industry-group total for the services division; "Public administration" is likewise an industry-group line; "Total, all industrial groups" is the grand total. Indentation is not reproduced in the cell text. In the footnote the colon after "Source" and the periods in "D.C." are not legible in the scan (they read as blank/comma-like specks); I have rendered them in the conventional form. All printed arithmetic is internally consistent (component columns sum to their "Total" columns, and won + no-representative = total elections, union votes + no-union votes = total valid votes cast, in every row), which supports the digit readings.
Source image
Source data: U.S. NLRB Annual Reports (public domain). Reconstruction by NLRB Stats Archive. Read by claude-opus-5 (effort max, prompt extract_v1) from the 300-dpi scan; stitched by page. Updated October 2026.