NLRB Stats Archive › Annual Reports › FY1982 › Representation elections held in cases closed
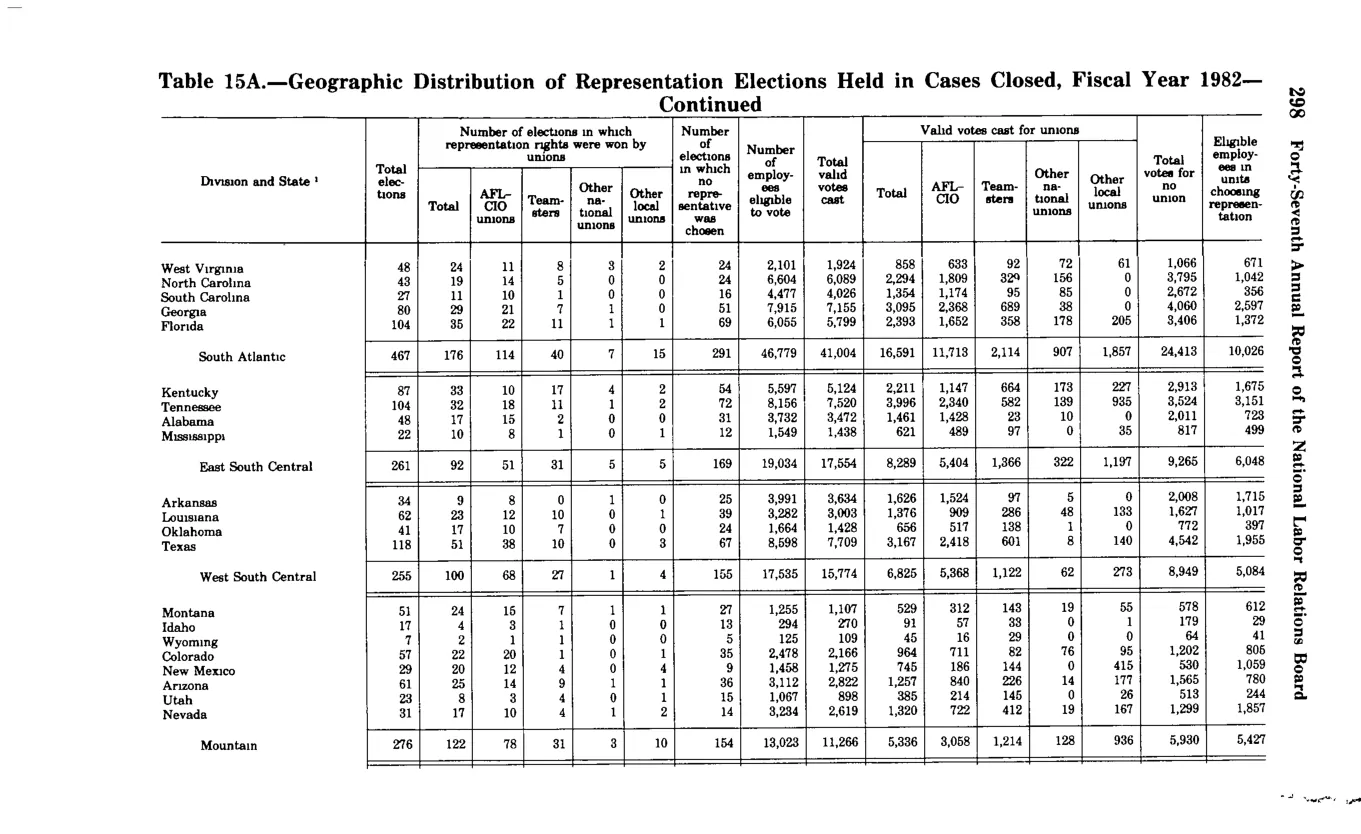
Representation elections held in cases closed
| Total elections | Number of elections in which representation rights were won by unions — Total | Number of elections in which representation rights were won by unions — AFL-CIO unions | Number of elections in which representation rights were won by unions — Teamsters | Number of elections in which representation rights were won by unions — Other national unions | Number of elections in which representation rights were won by unions — Other local unions | Number of elections in which no representative was chosen | Number of employees eligible to vote | Total valid votes cast | Valid votes cast for unions — Total | Valid votes cast for unions — AFL-CIO | Valid votes cast for unions — Teamsters | Valid votes cast for unions — Other national unions | Valid votes cast for unions — Other local unions | Total votes for no union | Eligible employees in unions winning representation | |
|---|---|---|---|---|---|---|---|---|---|---|---|---|---|---|---|---|
| South Atlantic (regional subtotal) | 497 | 176 | 114 | 40 | 7 | 15 | 291 | 46,779 | 41,094 | 16,591 | 11,718 | 2,114 | 907 | 1,852 | 24,412 | 10,026 |
| East South Central (regional subtotal) | 261 | 92 | 51 | 31 | 5 | 5 | 169 | 19,034 | 17,554 | 8,289 | 5,404 | 1,866 | 322 | 1,197 | 9,265 | 6,048 |
| West South Central (regional subtotal) | 255 | 100 | 68 | 22 | 1 | 9 | 154 | 17,535 | 15,774 | 6,825 | 5,968 | 1,122 | 62 | 273 | 8,949 | 5,084 |
| Mountain (regional subtotal) | 276 | 122 | 78 | 31 | 3 | 10 | 154 | 13,023 | 11,266 | 5,336 | 3,058 | 1,214 | 128 | 936 | 5,930 | 5,427 |
Source image
Source data: U.S. NLRB Annual Reports (public domain). Reconstruction by NLRB Stats Archive. Updated June 2026.