NLRB Stats Archive › Annual Reports › FY1982 › Final outcome of representation elections in cases closed
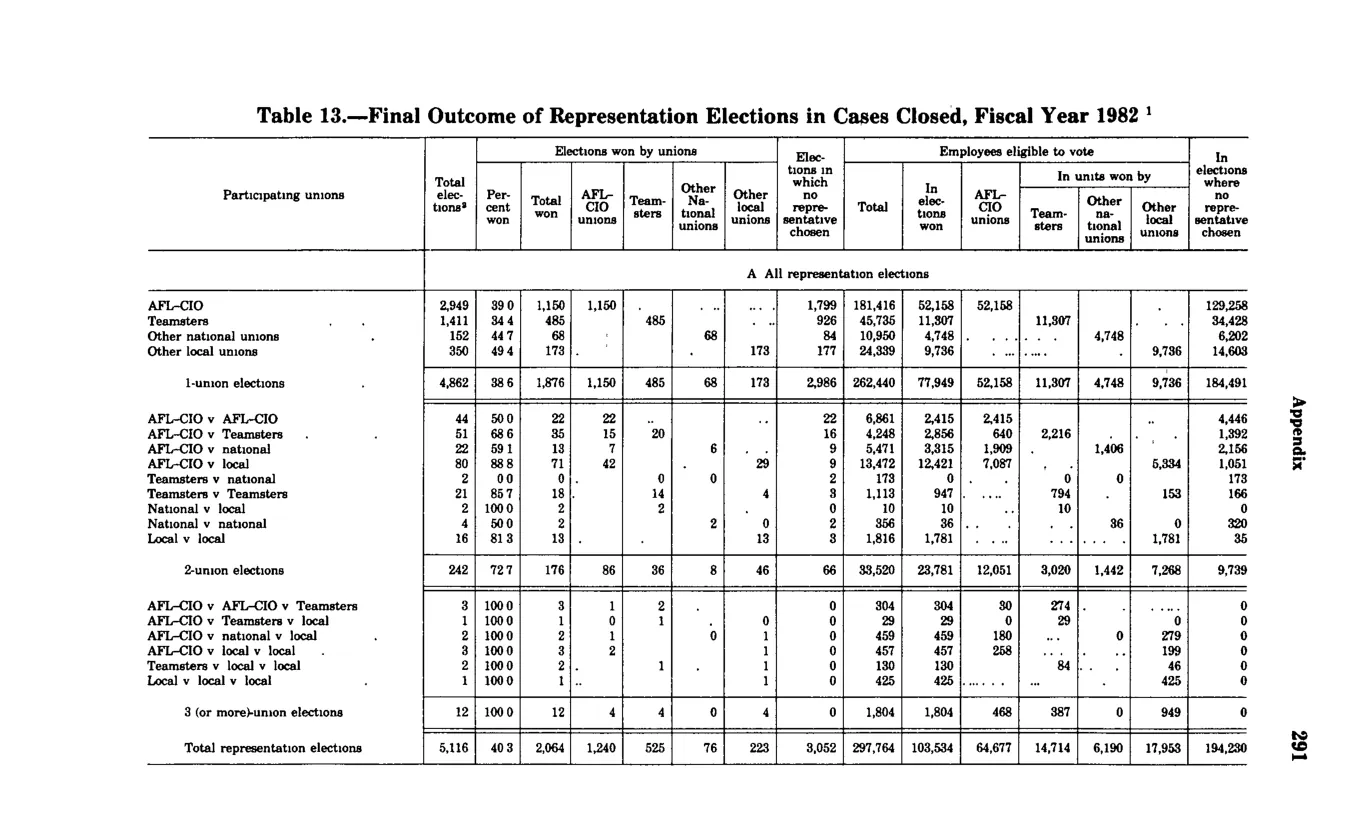
Final outcome of representation elections in cases closed
| Total elections | Percent won | Elections won by unions — Total | Elections won by unions — AFL-CIO unions | Elections won by unions — Teamsters | Elections won by unions — Other national unions | Elections won by unions — Other local unions | Elections in which no representative chosen | Employees eligible to vote — Total | Employees eligible — In elections won — Total | Employees eligible — In elections won — AFL-CIO unions | Employees eligible — In elections won — Teamsters | Employees eligible — In elections won — Other national unions | Employees eligible — In elections won — Other local unions | Employees eligible — In elections where no representative chosen | |
|---|---|---|---|---|---|---|---|---|---|---|---|---|---|---|---|
| A. All representation elections | |||||||||||||||
| AFL-CIO (1-union) | 2,949 | 39 | 1,150 | 1,150 | 1,799 | 181,416 | 52,158 | 52,158 | 129,258 | ||||||
| Teamsters (1-union) | 1,411 | 34.4 | 485 | 485 | 926 | 45,735 | 11,807 | 11,307 | 34,428 | ||||||
| Other national unions (1-union) | 142 | 47.7 | 68 | 68 | 74 | 10,930 | 4,748 | 4,748 | 6,202 | ||||||
| Other local unions (1-union) | 350 | 49.4 | 173 | 173 | 177 | 24,520 | 9,256 | 9,236 | 15,264 | ||||||
| 1-union elections (subtotal) | 4,852 | 40.6 | 1,876 | 1,150 | 485 | 68 | 173 | 2,986 | 262,440 | 77,949 | 52,158 | 11,307 | 4,748 | 9,736 | 184,491 |
| 2-union elections (subtotal) | 242 | 72.7 | 176 | 86 | 36 | 6 | 8 | 66 | 33,520 | 23,781 | 12,051 | 3,809 | 1,442 | 7,268 | 9,739 |
| 3 (or more)-union elections (subtotal) | 12 | 100 | 12 | 4 | 8 | 0 | 1,504 | 1,504 | 366 | 387 | 949 | 0 | |||
| Total representation elections | 5,116 | 40.3 | 2,064 | 1,240 | 525 | 76 | 223 | 3,052 | 297,164 | 103,534 | 64,677 | 14,714 | 6,190 | 17,953 | 194,230 |
Source image
Source data: U.S. NLRB Annual Reports (public domain). Reconstruction by NLRB Stats Archive. Updated June 2026.