NLRB Stats Archive › Annual Reports › FY1982 › Objections filed in representation cases closed
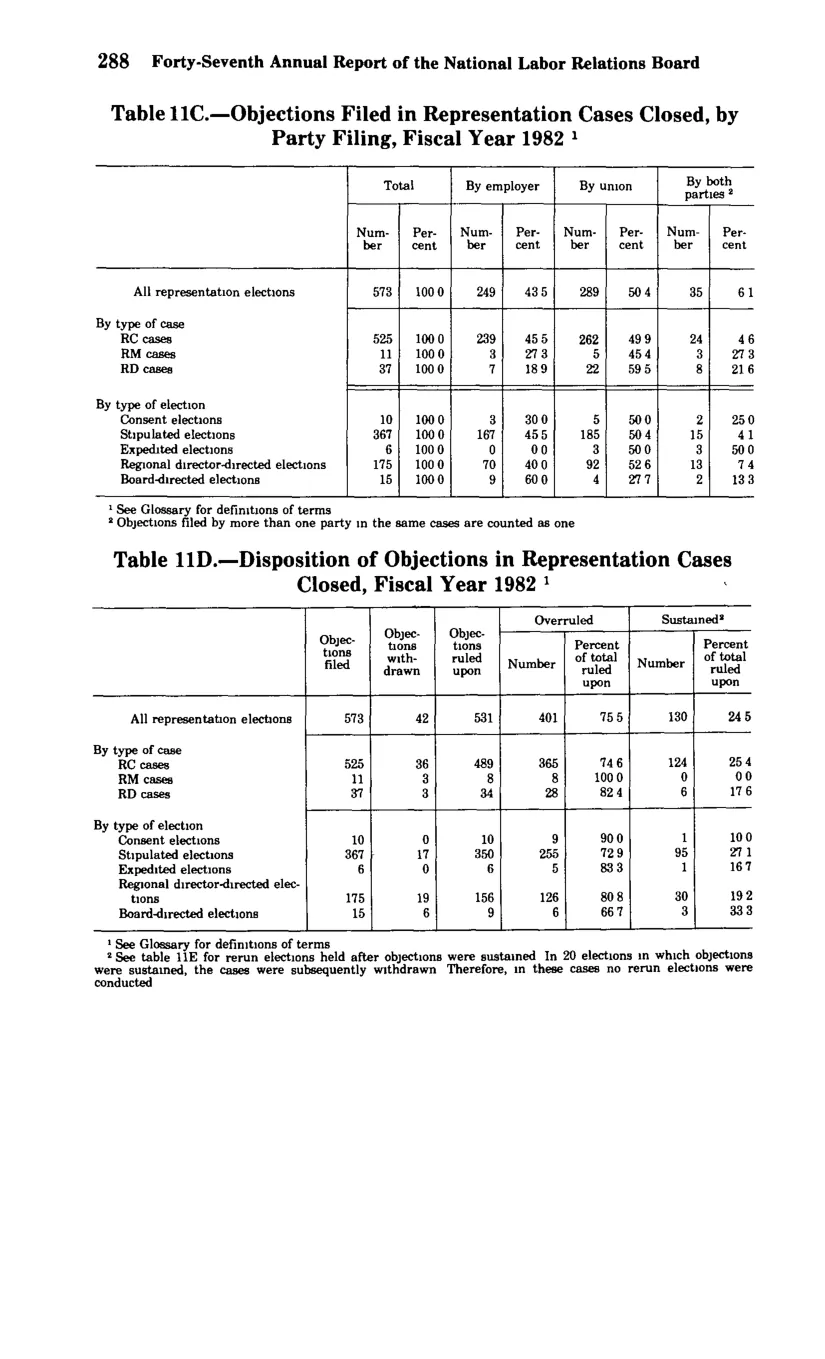
Objections filed in representation cases closed
| Total — Number | Total — Percent | By employer — Number | By employer — Percent | By union — Number | By union — Percent | By both parties — Number | By both parties — Percent | |
|---|---|---|---|---|---|---|---|---|
| All representation elections | 573 | 100 | 249 | 43.5 | 289 | 50.4 | 35 | 6.1 |
| By type of case | ||||||||
| RC cases | 525 | 100 | 239 | 45.5 | 262 | 49.9 | 24 | 4.6 |
| RM cases | 11 | 100 | 3 | 27.3 | 5 | 45.4 | 3 | 27.3 |
| RD cases | 37 | 100 | 7 | 18.9 | 22 | 59.5 | 8 | 21.6 |
| By type of election | ||||||||
| Consent elections | 10 | 100 | 3 | 30 | 5 | 50 | 2 | 20 |
| Stipulated elections | 367 | 100 | 167 | 45.5 | 185 | 50.4 | 15 | 4.1 |
| Expedited elections | 6 | 100 | 0 | 0 | 3 | 50 | 3 | 50 |
| Regional director-directed elections | 175 | 100 | 70 | 40 | 92 | 52.6 | 13 | 7.4 |
| Board-directed elections | 15 | 100 | 9 | 60 | 4 | 27.7 | 2 | 13.3 |
Source image
Source data: U.S. NLRB Annual Reports (public domain). Reconstruction by NLRB Stats Archive. Updated June 2026.