NLRB Stats Archive › Annual Reports › FY1981 › Proceedings Decided by Circuit Courts of Appeals on Petitions for Enforcement and/or Review of Board Orders, Fiscal Year 1981, Compared With 5-Year Cumulative Totals, Fiscal Years 1976 Through 1980
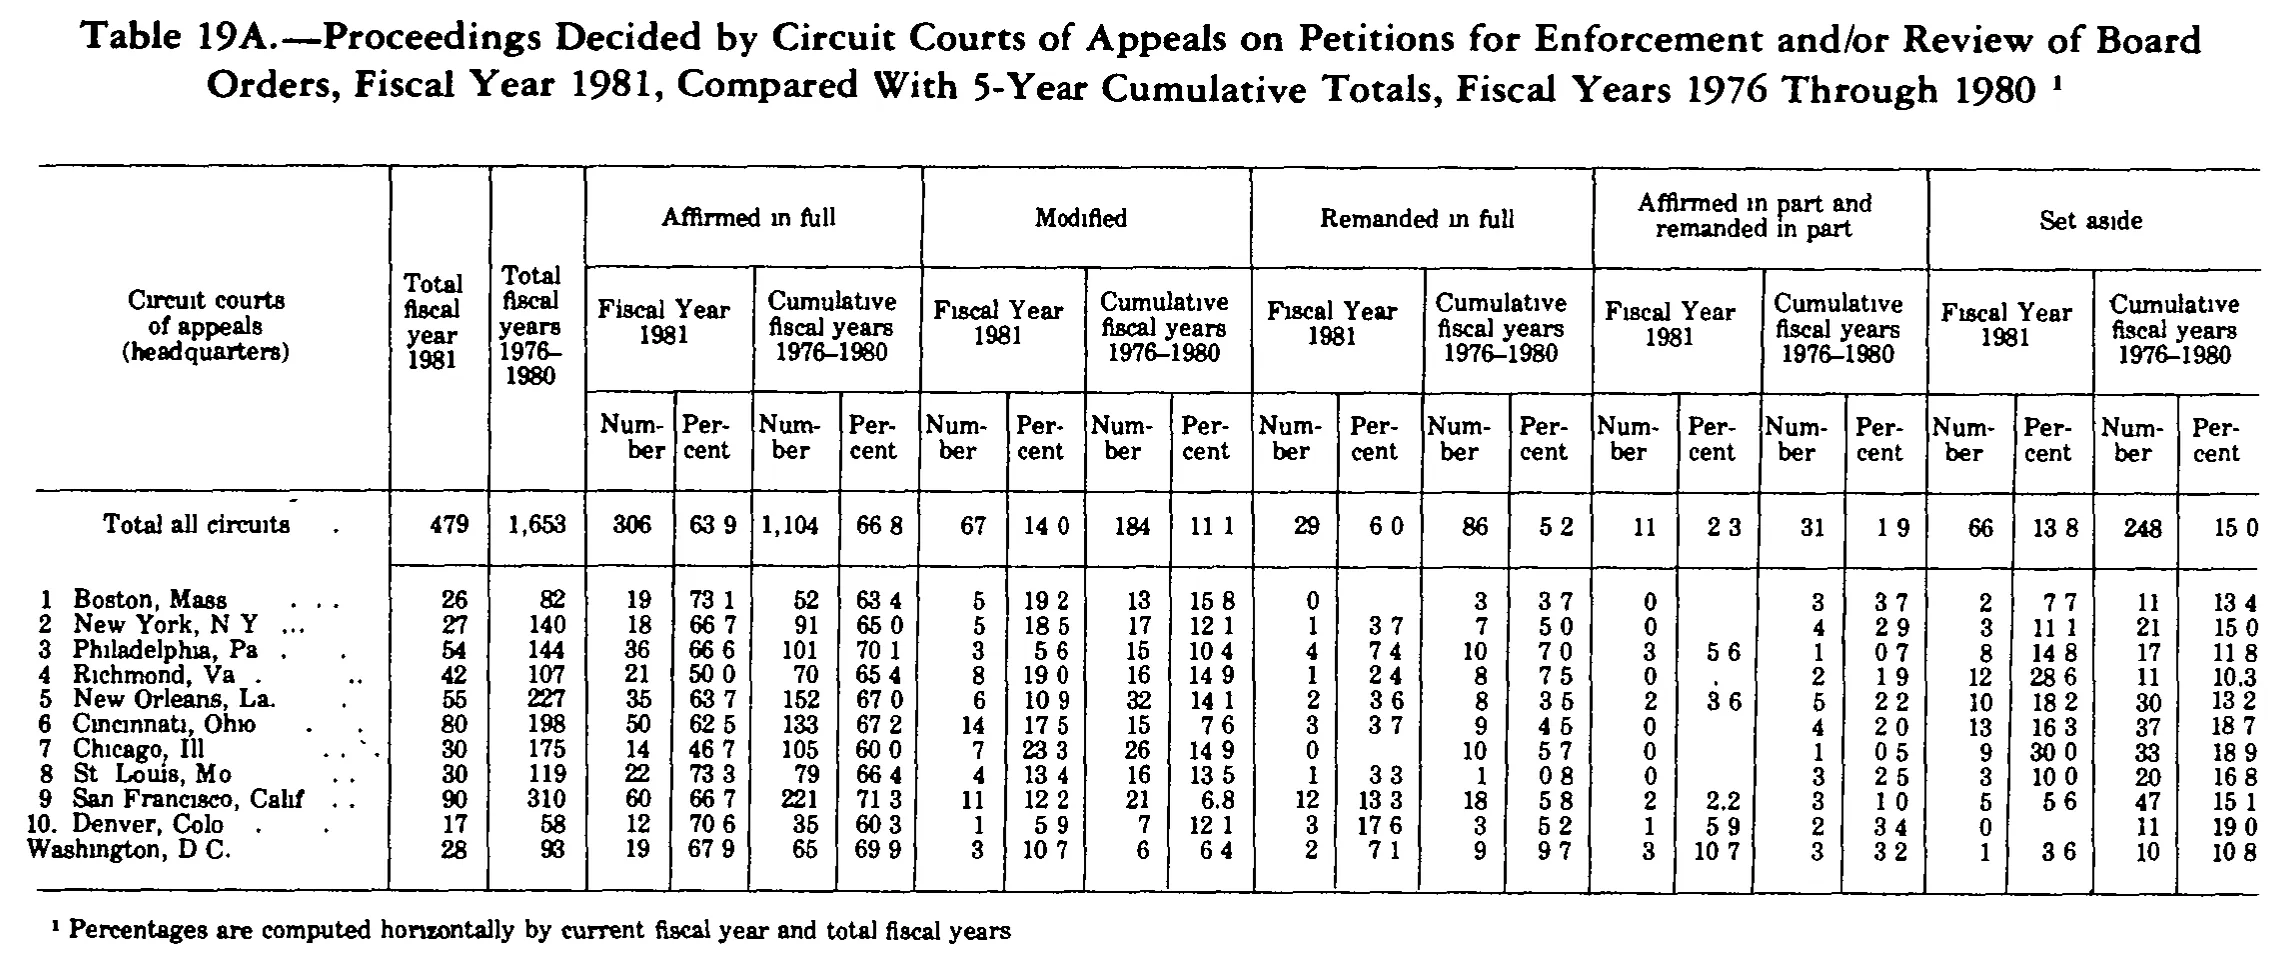
Proceedings Decided by Circuit Courts of Appeals on Petitions for Enforcement and/or Review of Board Orders, Fiscal Year 1981, Compared With 5-Year Cumulative Totals, Fiscal Years 1976 Through 1980
| Circuit courts of appeals (headquarters) | Total fiscal year 1981 | Total fiscal years 1976-1980 | Affirmed in full | Modified | Remanded in full | Affirmed in part and remanded in part | Set aside | |||||||||||||||
|---|---|---|---|---|---|---|---|---|---|---|---|---|---|---|---|---|---|---|---|---|---|---|
| Circuit courts of appeals (headquarters) | Total fiscal year 1981 | Total fiscal years 1976-1980 | Fiscal Year 1981 | Cumulative fiscal years 1976-1980 | Fiscal Year 1981 | Cumulative fiscal years 1976-1980 | Fiscal Year 1981 | Cumulative fiscal years 1976-1980 | Fiscal Year 1981 | Cumulative fiscal years 1976-1980 | Fiscal Year 1981 | Cumulative fiscal years 1976-1980 | ||||||||||
| Circuit courts of appeals (headquarters) | Total fiscal year 1981 | Total fiscal years 1976-1980 | Number | Percent | Number | Percent | Number | Percent | Number | Percent | Number | Percent | Number | Percent | Number | Percent | Number | Percent | Number | Percent | Number | Percent |
| Total all circuits | 479 | 1,653 | 306 | 63.9 | 1,104 | 66.8 | 67 | 14.0 | 184 | 11.1 | 29 | 6.0 | 86 | 5.2 | 11 | 2.3 | 31 | 1.9 | 66 | 13.8 | 248 | 15.0 |
| 1 Boston, Mass | 26 | 82 | 19 | 73.1 | 52 | 63.4 | 5 | 19.2 | 13 | 15.8 | 0 | 3 | 3.7 | 0 | 3 | 3.7 | 2 | 7.7 | 11 | 13.4 | ||
| 2 New York, N Y | 27 | 140 | 18 | 66.7 | 91 | 65.0 | 5 | 18.5 | 17 | 12.1 | 1 | 3.7 | 7 | 5.0 | 0 | 4 | 2.9 | 3 | 11.1 | 21 | 15.0 | |
| 3 Philadelphia, Pa | 54 | 144 | 36 | 66.6 | 101 | 70.1 | 3 | 5.6 | 15 | 10.4 | 4 | 7.4 | 10 | 7.0 | 3 | 5.6 | 1 | 0.7 | 8 | 14.8 | 17 | 11.8 |
| 4 Richmond, Va | 42 | 107 | 21 | 50.0 | 70 | 65.4 | 8 | 19.0 | 16 | 14.9 | 1 | 2.4 | 8 | 7.5 | 0 | 2 | 1.9 | 12 | 28.6 | 11 | 10.3 | |
| 5 New Orleans, La. | 55 | 227 | 35 | 63.7 | 152 | 67.0 | 6 | 10.9 | 32 | 14.1 | 2 | 3.6 | 8 | 3.5 | 2 | 3.6 | 5 | 2.2 | 10 | 18.2 | 30 | 13.2 |
| 6 Cincinnati, Ohio | 80 | 198 | 50 | 62.5 | 133 | 67.2 | 14 | 17.5 | 15 | 7.6 | 3 | 3.7 | 9 | 4.5 | 0 | 4 | 2.0 | 13 | 16.3 | 37 | 18.7 | |
| 7 Chicago, Ill | 30 | 175 | 14 | 46.7 | 105 | 60.0 | 7 | 23.3 | 26 | 14.9 | 0 | 10 | 5.7 | 0 | 1 | 0.5 | 9 | 30.0 | 33 | 18.9 | ||
| 8 St Louis, Mo | 30 | 119 | 22 | 73.3 | 79 | 66.4 | 4 | 13.4 | 16 | 13.5 | 1 | 3.3 | 1 | 0.8 | 0 | 3 | 2.5 | 3 | 10.0 | 20 | 16.8 | |
| 9 San Francisco, Calif | 90 | 310 | 60 | 66.7 | 221 | 71.3 | 11 | 12.2 | 21 | 6.8 | 12 | 13.3 | 18 | 5.8 | 2 | 2.2 | 3 | 1.0 | 5 | 5.6 | 47 | 15.1 |
| 10. Denver, Colo | 17 | 58 | 12 | 70.6 | 35 | 60.3 | 1 | 5.9 | 7 | 12.1 | 3 | 17.6 | 3 | 5.2 | 1 | 5.9 | 2 | 3.4 | 0 | 11 | 19.0 | |
| Washington, D C. | 28 | 93 | 19 | 67.9 | 65 | 69.9 | 3 | 10.7 | 6 | 6.4 | 2 | 7.1 | 9 | 9.7 | 3 | 10.7 | 3 | 3.2 | 1 | 3.6 | 10 | 10.8 |
- 1 Percentages are computed horizontally by current fiscal year and total fiscal years
135 of 135 figures sit in a row or column sum that works out.
Reader’s notes
p. 236. 23 columns: stub, two total columns, then five outcome groups of four columns each (Number/Percent for FY 1981 and for cumulative FY 1976-1980). DECIMAL POINTS IN PERCENT COLUMNS: this 1-bit scan drops most decimal points, so nearly every percent prints as e.g. \"63 9\", \"14 0\". A few cells retain a visible dot (San Francisco Modified cumulative \"6.8\", Richmond Set aside cumulative \"10.3\", San Francisco Affirmed-in-part FY1981 \"2.2\"), and every value is consistent with one decimal place, so all percent cells are transcribed with a decimal point. No other normalization was applied. BLANK PERCENTS: wherever a Number cell is 0 the matching Percent cell is left blank in the original; recorded as \"\". STRAY MARK: Richmond, Va, column \"Affirmed in part and remanded in part / Fiscal Year 1981 / Percent\" contains only a lone dot (its Number is 0); recorded as \"\". VERIFICATION: all ten count columns sum exactly to the printed \"Total all circuits\" row (479; 1,653; 306; 1,104; 67; 184; 29; 86; 11; 31; 66; 248), which confirms the column assignment of every integer. SUSPECTED MISPRINTS (transcribed as printed, not corrected) — printed percent disagrees with the horizontal computation the footnote describes: - Philadelphia, Pa, Affirmed in full / Fiscal Year 1981 / Percent: printed 66.6; 36/54 = 66.7. - New Orleans, La., Affirmed in full / Fiscal Year 1981 / Percent: printed 63.7; 35/55 = 63.6. - St Louis, Mo, Modified / Fiscal Year 1981 / Percent: printed 13.4; 4/30 = 13.3. - St Louis, Mo, Modified / Cumulative / Percent: printed 13.5; 16/119 = 13.4. The final digits of these four cells are the least certain readings in the table; elsewhere the table rounds inconsistently (it truncates in several places, e.g. Boston Modified cumulative 15.8 from 15.85), so arithmetic was not used to override what is printed. ROW LABELS: periods after abbreviations (Mass., N.Y., Pa., Va., Ill., St., Mo., Calif., Colo., D.C.) are largely lost in the scan and are transcribed only where legible; \"10.\" is the only row number with a visible period. The last row, Washington, D C., carries no circuit number in the original. Trailing leader dots were dropped per instruction. TYPOGRAPHY: the scan renders many dotless i's (\"Affirmed ın full\", \"Cıncınnatı\", \"Rıchmond\"); these are ordinary i's and are written as such.
Source image
Source data: U.S. NLRB Annual Reports (public domain). Reconstruction by NLRB Stats Archive. Read by claude-opus-5 (effort max, prompt extract_v1) from the 300-dpi scan; stitched by page. Updated October 2026.