NLRB Stats Archive › Annual Reports › FY1981 › Distribution of Unfair Labor Practice Situations Received, by Number of Employees in Establishments, Fiscal Year 1981
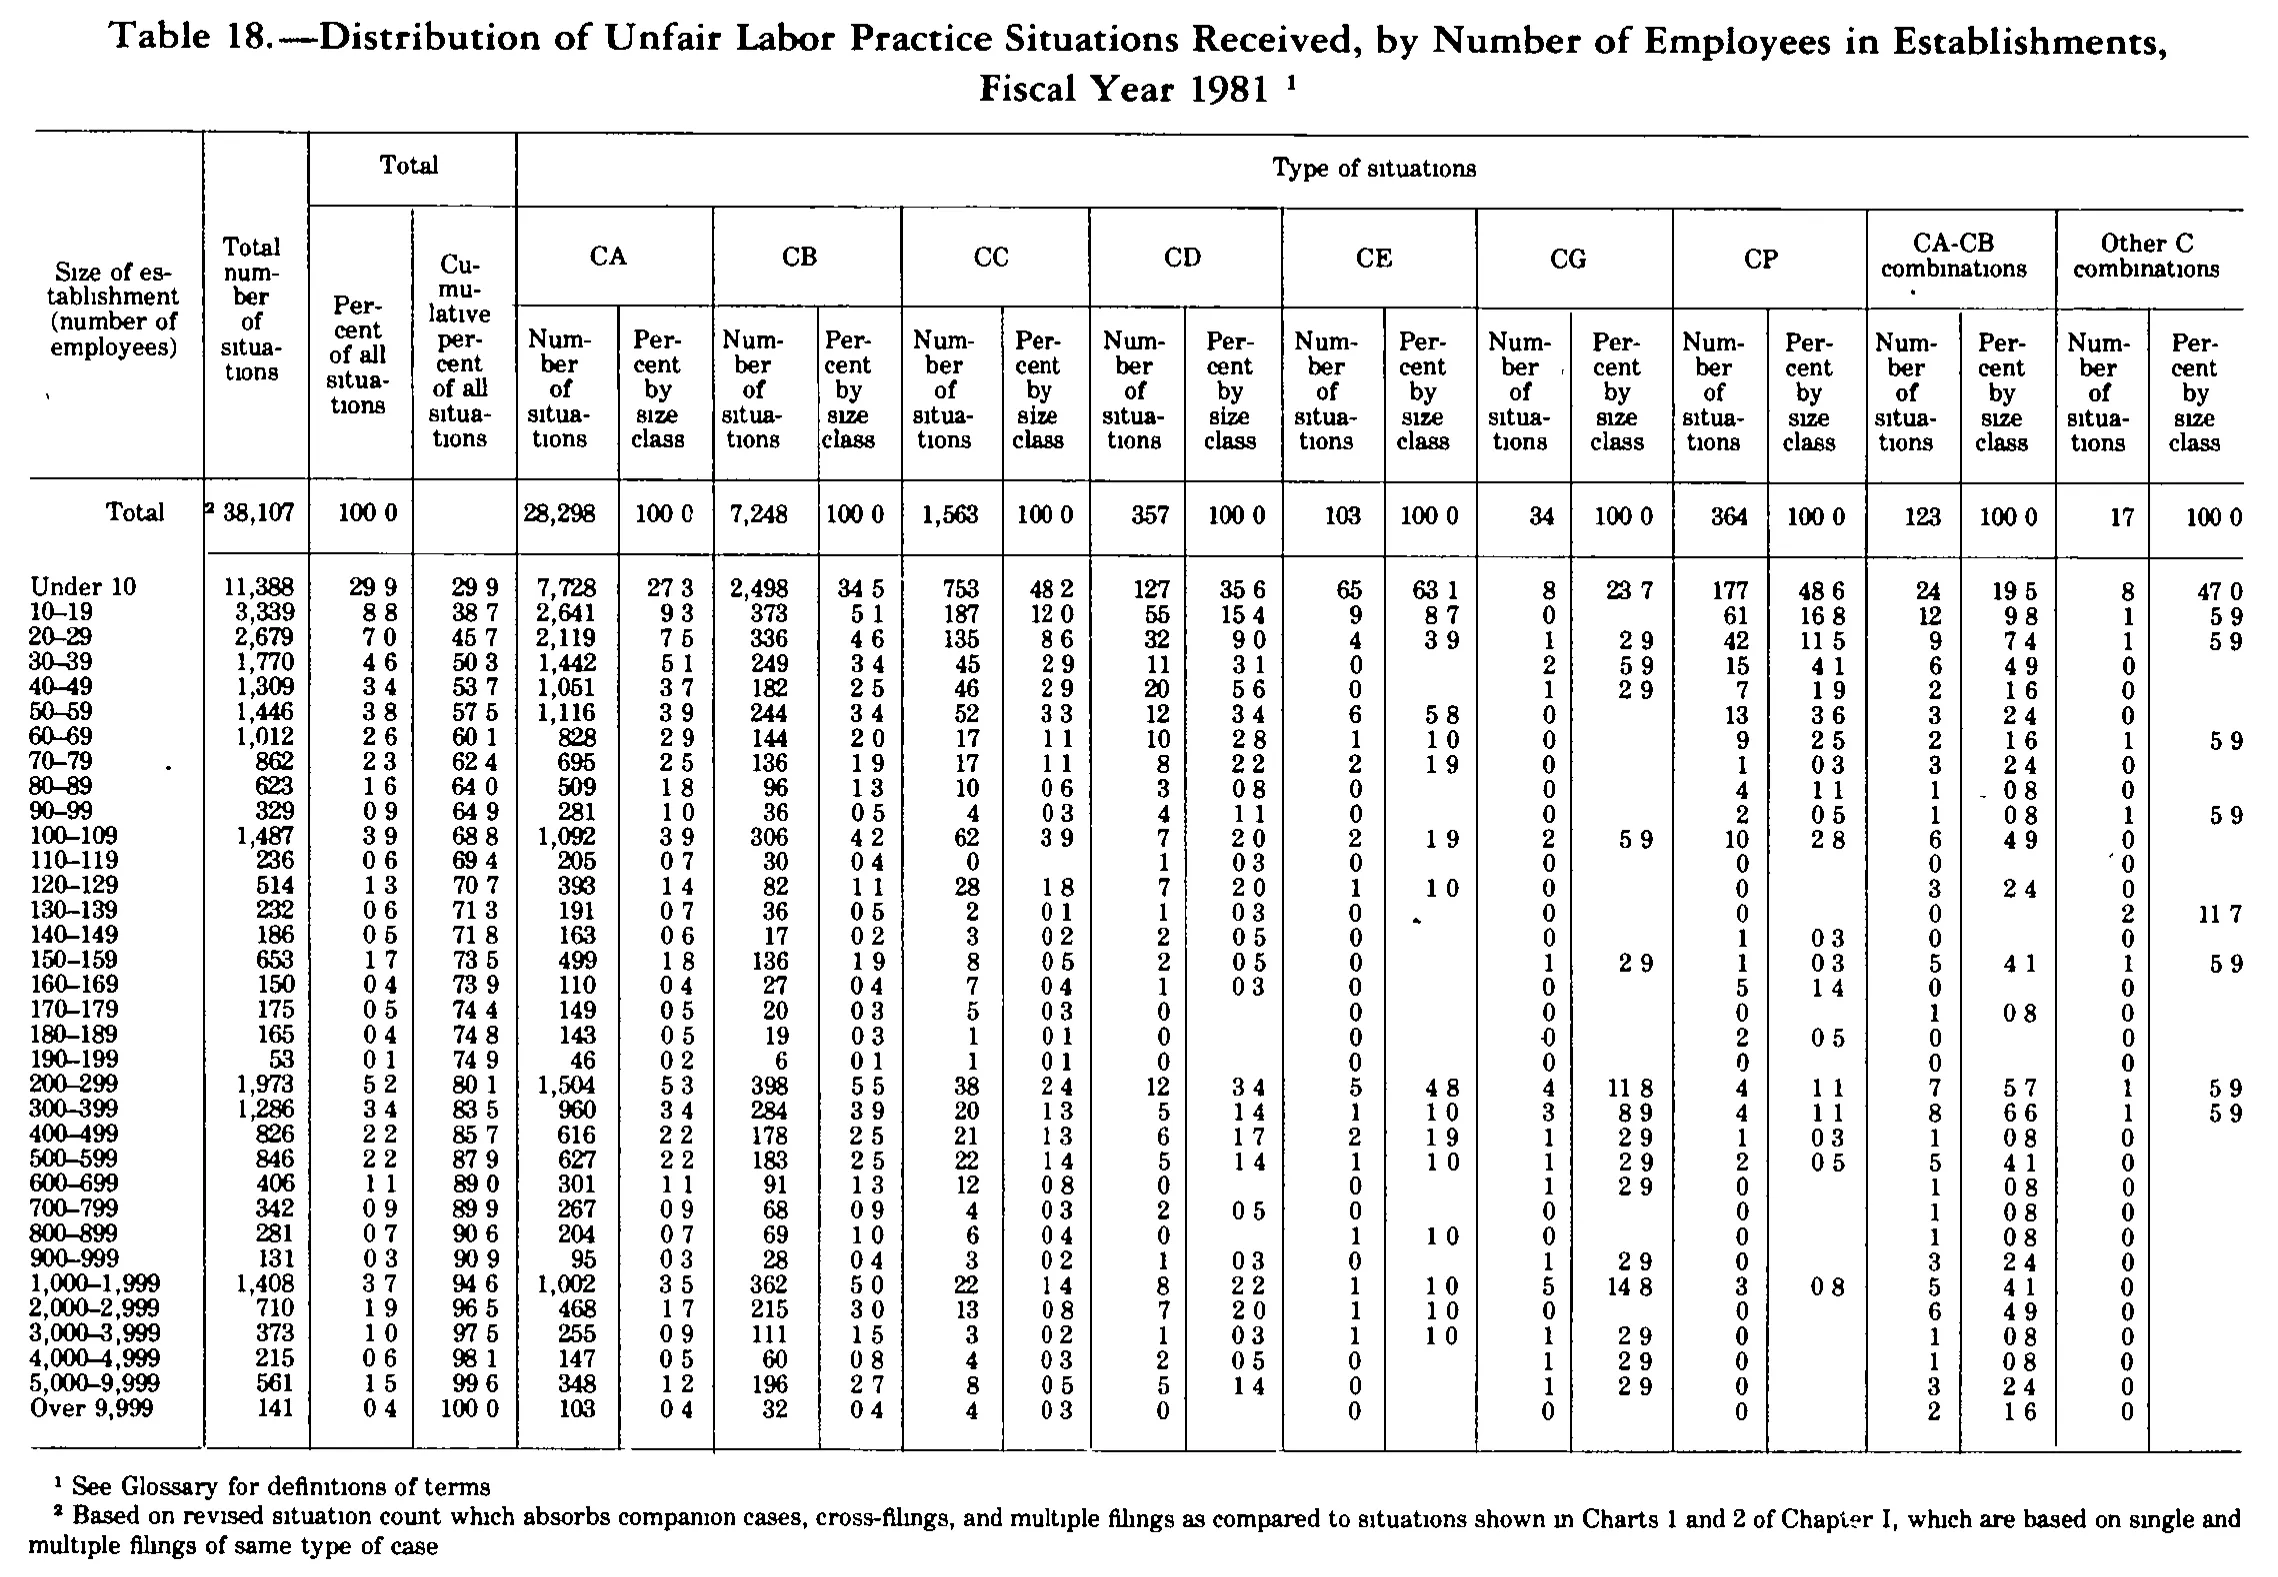
Distribution of Unfair Labor Practice Situations Received, by Number of Employees in Establishments, Fiscal Year 1981
| Size of establishment (number of employees) | Total number of situations | Total | Type of situations | ||||||||||||||||||
|---|---|---|---|---|---|---|---|---|---|---|---|---|---|---|---|---|---|---|---|---|---|
| Size of establishment (number of employees) | Total number of situations | Percent of all situations | Cumulative percent of all situations | CA | CB | CC | CD | CE | CG | CP | CA-CB combinations | Other C combinations | |||||||||
| Size of establishment (number of employees) | Total number of situations | Percent of all situations | Cumulative percent of all situations | Number of situations | Percent by size class | Number of situations | Percent by size class | Number of situations | Percent by size class | Number of situations | Percent by size class | Number of situations | Percent by size class | Number of situations | Percent by size class | Number of situations | Percent by size class | Number of situations | Percent by size class | Number of situations | Percent by size class |
| Total | 38,107 | 100.0 | 28,298 | 100.0 | 7,248 | 100.0 | 1,563 | 100.0 | 357 | 100.0 | 103 | 100.0 | 34 | 100.0 | 364 | 100.0 | 123 | 100.0 | 17 | 100.0 | |
| Under 10 | 11,388 | 29.9 | 29.9 | 7,728 | 27.3 | 2,498 | 34.5 | 753 | 48.2 | 127 | 35.6 | 65 | 63.1 | 8 | 23.7 | 177 | 48.6 | 24 | 19.5 | 8 | 47.0 |
| 10–19 | 3,339 | 8.8 | 38.7 | 2,641 | 9.3 | 373 | 5.1 | 187 | 12.0 | 55 | 15.4 | 9 | 8.7 | 0 | 61 | 16.8 | 12 | 9.8 | 1 | 5.9 | |
| 20–29 | 2,679 | 7.0 | 45.7 | 2,119 | 7.5 | 336 | 4.6 | 135 | 8.6 | 32 | 9.0 | 4 | 3.9 | 1 | 2.9 | 42 | 11.5 | 9 | 7.4 | 1 | 5.9 |
| 30–39 | 1,770 | 4.6 | 50.3 | 1,442 | 5.1 | 249 | 3.4 | 45 | 2.9 | 11 | 3.1 | 0 | 2 | 5.9 | 15 | 4.1 | 6 | 4.9 | 0 | ||
| 40–49 | 1,309 | 3.4 | 53.7 | 1,051 | 3.7 | 182 | 2.5 | 46 | 2.9 | 20 | 5.6 | 0 | 1 | 2.9 | 7 | 1.9 | 2 | 1.6 | 0 | ||
| 50–59 | 1,446 | 3.8 | 57.5 | 1,116 | 3.9 | 244 | 3.4 | 52 | 3.3 | 12 | 3.4 | 6 | 5.8 | 0 | 13 | 3.6 | 3 | 2.4 | 0 | ||
| 60–69 | 1,012 | 2.6 | 60.1 | 828 | 2.9 | 144 | 2.0 | 17 | 1.1 | 10 | 2.8 | 1 | 1.0 | 0 | 9 | 2.5 | 2 | 1.6 | 1 | 5.9 | |
| 70–79 | 862 | 2.3 | 62.4 | 695 | 2.5 | 136 | 1.9 | 17 | 1.1 | 8 | 2.2 | 2 | 1.9 | 0 | 1 | 0.3 | 3 | 2.4 | 0 | ||
| 80–89 | 623 | 1.6 | 64.0 | 509 | 1.8 | 96 | 1.3 | 10 | 0.6 | 3 | 0.8 | 0 | 0 | 4 | 1.1 | 1 | 0.8 | 0 | |||
| 90–99 | 329 | 0.9 | 64.9 | 281 | 1.0 | 36 | 0.5 | 4 | 0.3 | 4 | 1.1 | 0 | 0 | 2 | 0.5 | 1 | 0.8 | 1 | 5.9 | ||
| 100–109 | 1,487 | 3.9 | 68.8 | 1,092 | 3.9 | 306 | 4.2 | 62 | 3.9 | 7 | 2.0 | 2 | 1.9 | 2 | 5.9 | 10 | 2.8 | 6 | 4.9 | 0 | |
| 110–119 | 236 | 0.6 | 69.4 | 205 | 0.7 | 30 | 0.4 | 0 | 1 | 0.3 | 0 | 0 | 0 | 0 | 0 | ||||||
| 120–129 | 514 | 1.3 | 70.7 | 393 | 1.4 | 82 | 1.1 | 28 | 1.8 | 7 | 2.0 | 1 | 1.0 | 0 | 0 | 3 | 2.4 | 0 | |||
| 130–139 | 232 | 0.6 | 71.3 | 191 | 0.7 | 36 | 0.5 | 2 | 0.1 | 1 | 0.3 | 0 | 0 | 0 | 0 | 2 | 11.7 | ||||
| 140–149 | 186 | 0.5 | 71.8 | 163 | 0.6 | 17 | 0.2 | 3 | 0.2 | 2 | 0.5 | 0 | 0 | 1 | 0.3 | 0 | 0 | ||||
| 150–159 | 653 | 1.7 | 73.5 | 499 | 1.8 | 136 | 1.9 | 8 | 0.5 | 2 | 0.5 | 0 | 1 | 2.9 | 1 | 0.3 | 5 | 4.1 | 1 | 5.9 | |
| 160–169 | 150 | 0.4 | 73.9 | 110 | 0.4 | 27 | 0.4 | 7 | 0.4 | 1 | 0.3 | 0 | 0 | 5 | 1.4 | 0 | 0 | ||||
| 170–179 | 175 | 0.5 | 74.4 | 149 | 0.5 | 20 | 0.3 | 5 | 0.3 | 0 | 0 | 0 | 0 | 1 | 0.8 | 0 | |||||
| 180–189 | 165 | 0.4 | 74.8 | 143 | 0.5 | 19 | 0.3 | 1 | 0.1 | 0 | 0 | 0 | 2 | 0.5 | 0 | 0 | |||||
| 190–199 | 53 | 0.1 | 74.9 | 46 | 0.2 | 6 | 0.1 | 1 | 0.1 | 0 | 0 | 0 | 0 | 0 | 0 | ||||||
| 200–299 | 1,973 | 5.2 | 80.1 | 1,504 | 5.3 | 398 | 5.5 | 38 | 2.4 | 12 | 3.4 | 5 | 4.8 | 4 | 11.8 | 4 | 1.1 | 7 | 5.7 | 1 | 5.9 |
| 300–399 | 1,286 | 3.4 | 83.5 | 960 | 3.4 | 284 | 3.9 | 20 | 1.3 | 5 | 1.4 | 1 | 1.0 | 3 | 8.9 | 4 | 1.1 | 8 | 6.6 | 1 | 5.9 |
| 400–499 | 826 | 2.2 | 85.7 | 616 | 2.2 | 178 | 2.5 | 21 | 1.3 | 6 | 1.7 | 2 | 1.9 | 1 | 2.9 | 1 | 0.3 | 1 | 0.8 | 0 | |
| 500–599 | 846 | 2.2 | 87.9 | 627 | 2.2 | 183 | 2.5 | 22 | 1.4 | 5 | 1.4 | 1 | 1.0 | 1 | 2.9 | 2 | 0.5 | 5 | 4.1 | 0 | |
| 600–699 | 406 | 1.1 | 89.0 | 301 | 1.1 | 91 | 1.3 | 12 | 0.8 | 0 | 0 | 1 | 2.9 | 0 | 1 | 0.8 | 0 | ||||
| 700–799 | 342 | 0.9 | 89.9 | 267 | 0.9 | 68 | 0.9 | 4 | 0.3 | 2 | 0.5 | 0 | 0 | 0 | 1 | 0.8 | 0 | ||||
| 800–899 | 281 | 0.7 | 90.6 | 204 | 0.7 | 69 | 1.0 | 6 | 0.4 | 0 | 1 | 1.0 | 0 | 0 | 1 | 0.8 | 0 | ||||
| 900–999 | 131 | 0.3 | 90.9 | 95 | 0.3 | 28 | 0.4 | 3 | 0.2 | 1 | 0.3 | 0 | 1 | 2.9 | 0 | 3 | 2.4 | 0 | |||
| 1,000–1,999 | 1,408 | 3.7 | 94.6 | 1,002 | 3.5 | 362 | 5.0 | 22 | 1.4 | 8 | 2.2 | 1 | 1.0 | 5 | 14.8 | 3 | 0.8 | 5 | 4.1 | 0 | |
| 2,000–2,999 | 710 | 1.9 | 96.5 | 468 | 1.7 | 215 | 3.0 | 13 | 0.8 | 7 | 2.0 | 1 | 1.0 | 0 | 0 | 6 | 4.9 | 0 | |||
| 3,000–3,999 | 373 | 1.0 | 97.5 | 255 | 0.9 | 111 | 1.5 | 3 | 0.2 | 1 | 0.3 | 1 | 1.0 | 1 | 2.9 | 0 | 1 | 0.8 | 0 | ||
| 4,000–4,999 | 215 | 0.6 | 98.1 | 147 | 0.5 | 60 | 0.8 | 4 | 0.3 | 2 | 0.5 | 0 | 1 | 2.9 | 0 | 1 | 0.8 | 0 | |||
| 5,000–9,999 | 561 | 1.5 | 99.6 | 348 | 1.2 | 196 | 2.7 | 8 | 0.5 | 5 | 1.4 | 0 | 1 | 2.9 | 0 | 3 | 2.4 | 0 | |||
| Over 9,999 | 141 | 0.4 | 100.0 | 103 | 0.4 | 32 | 0.4 | 4 | 0.3 | 0 | 0 | 0 | 0 | 2 | 1.6 | 0 | |||||
- 1 See Glossary for definitions of terms
- 2 Based on revised situation count which absorbs companion cases, cross-filings, and multiple filings as compared to situations shown in Charts 1 and 2 of Chapter I, which are based on single and multiple filings of same type of case
262 of 262 figures sit in a row or column sum that works out.
Reader’s notes
p. 234. 22 columns: stub, total number, two "Total" percent columns, then Number/Percent pairs for CA, CB, CC, CD, CE, CG, CP, CA-CB combinations and Other C combinations. Decimal points: in this scan the decimal point in every percent value has dropped out, so the figures print as "29 9", "100 0", "11 7". They are plainly one-decimal percentages (the cumulative column runs 29.9 ... 100.0), so I have written them with the decimal point restored: "29 9" -> "29.9". No digits were altered. Verification: I checked the grid arithmetically. Every one of the nine type-of-situations count columns sums exactly to its printed Total-row figure (28,298; 7,248; 1,563; 357; 103; 34; 364; 123; 17), the total-number column sums to 38,107, each of the 34 size-class rows' nine counts sums to that row's printed total, each percent column sums to exactly 100.0, and the cumulative-percent column reproduces the running sum of the percent-of-all-situations column at every line. Nothing in the table appears misprinted. Some percentages look slightly off against a naive count/total (e.g. CG "Under 10" 8/34 = 23.5 but 23.7 is printed, CG 3/34 printed as 8.9, 5/34 as 14.8). These are printed as shown; the column was evidently adjusted so the percentages total exactly 100.0, and that adjusted column does sum to 100.0, so I read the digits as correct rather than as scan errors. The Total row has no entry in the cumulative-percent column (blank in the original), transcribed as "". The superscript 2 in the Total row is printed to the left of 38,107 and is recorded as 38,107^2. The footnote 1 marker belongs to the caption, which is omitted per instructions. Minor scan artifacts, none affecting values: stray ink dots sit under the "CA-CB combinations" heading, in the left margin beside the stub heading and beside the "70-79" row, and under the CE column in the "130-139" row; the scan also drops the dots from many lower-case "i"s in the headings and footnotes (e.g. "situatıons"), spelled normally here. The range dashes in the row labels are transcribed as en dashes.
Source image
Source data: U.S. NLRB Annual Reports (public domain). Reconstruction by NLRB Stats Archive. Read by claude-opus-5 (effort max, prompt extract_v1) from the 300-dpi scan; stitched by page. Updated October 2026.