NLRB Stats Archive › Annual Reports › FY1981 › Standard Federal Administrative Regional Distribution of Cases Received Fiscal Year 1981
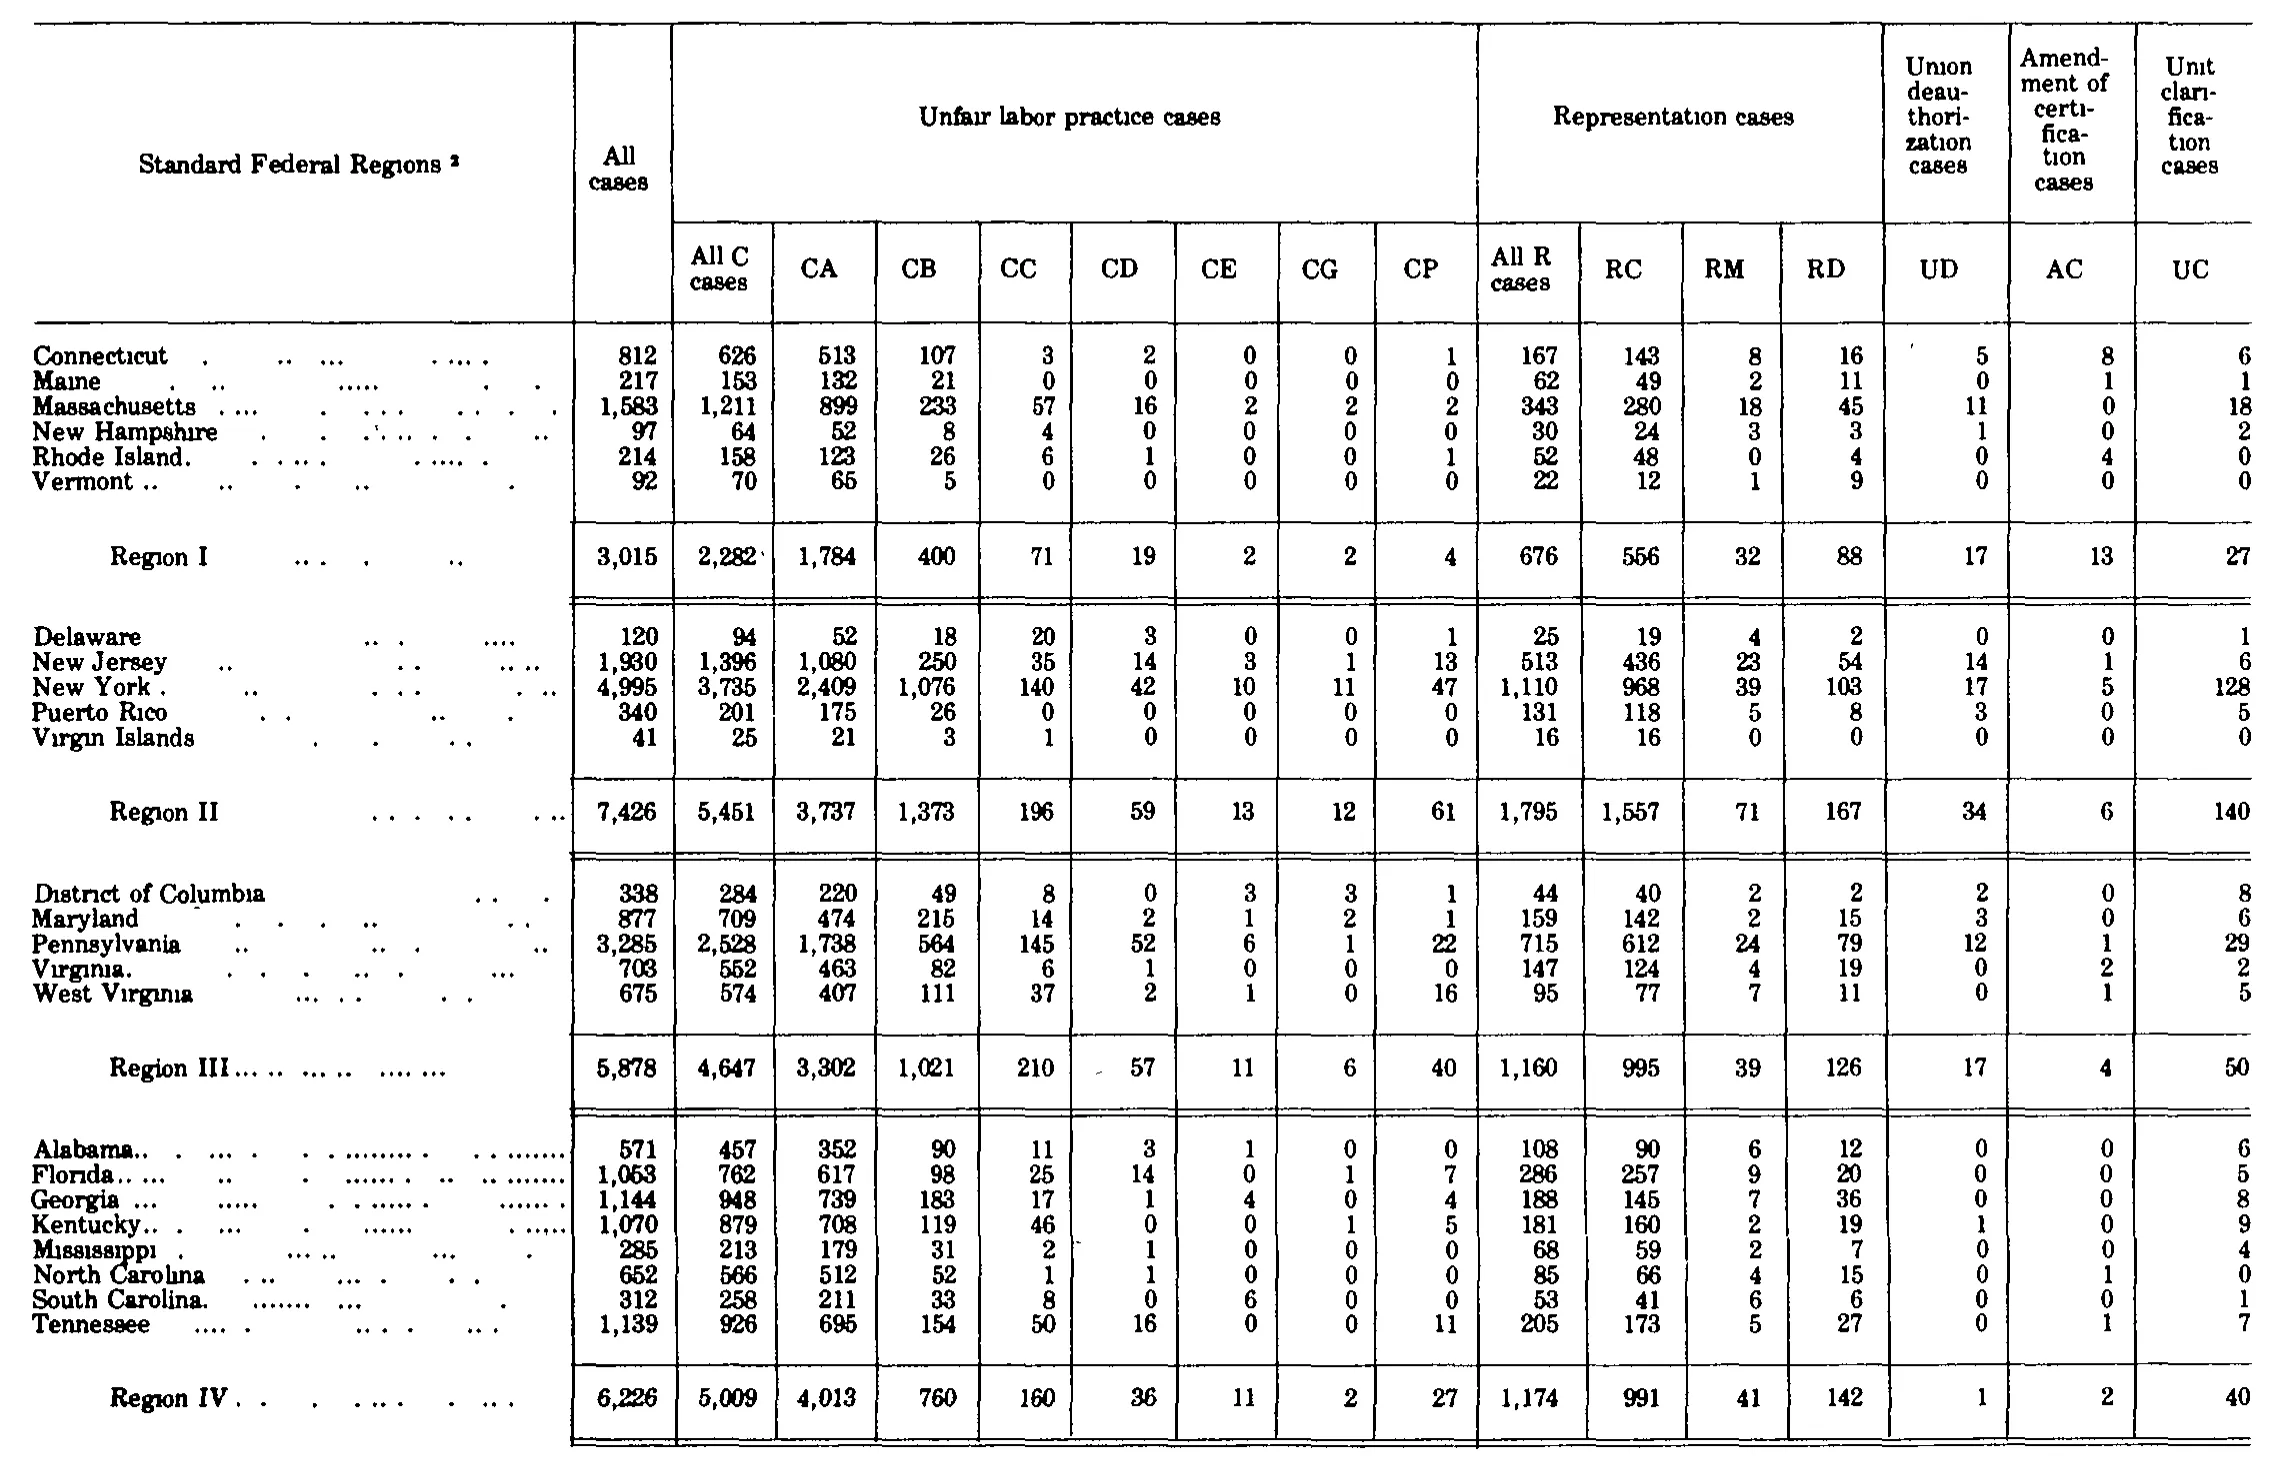
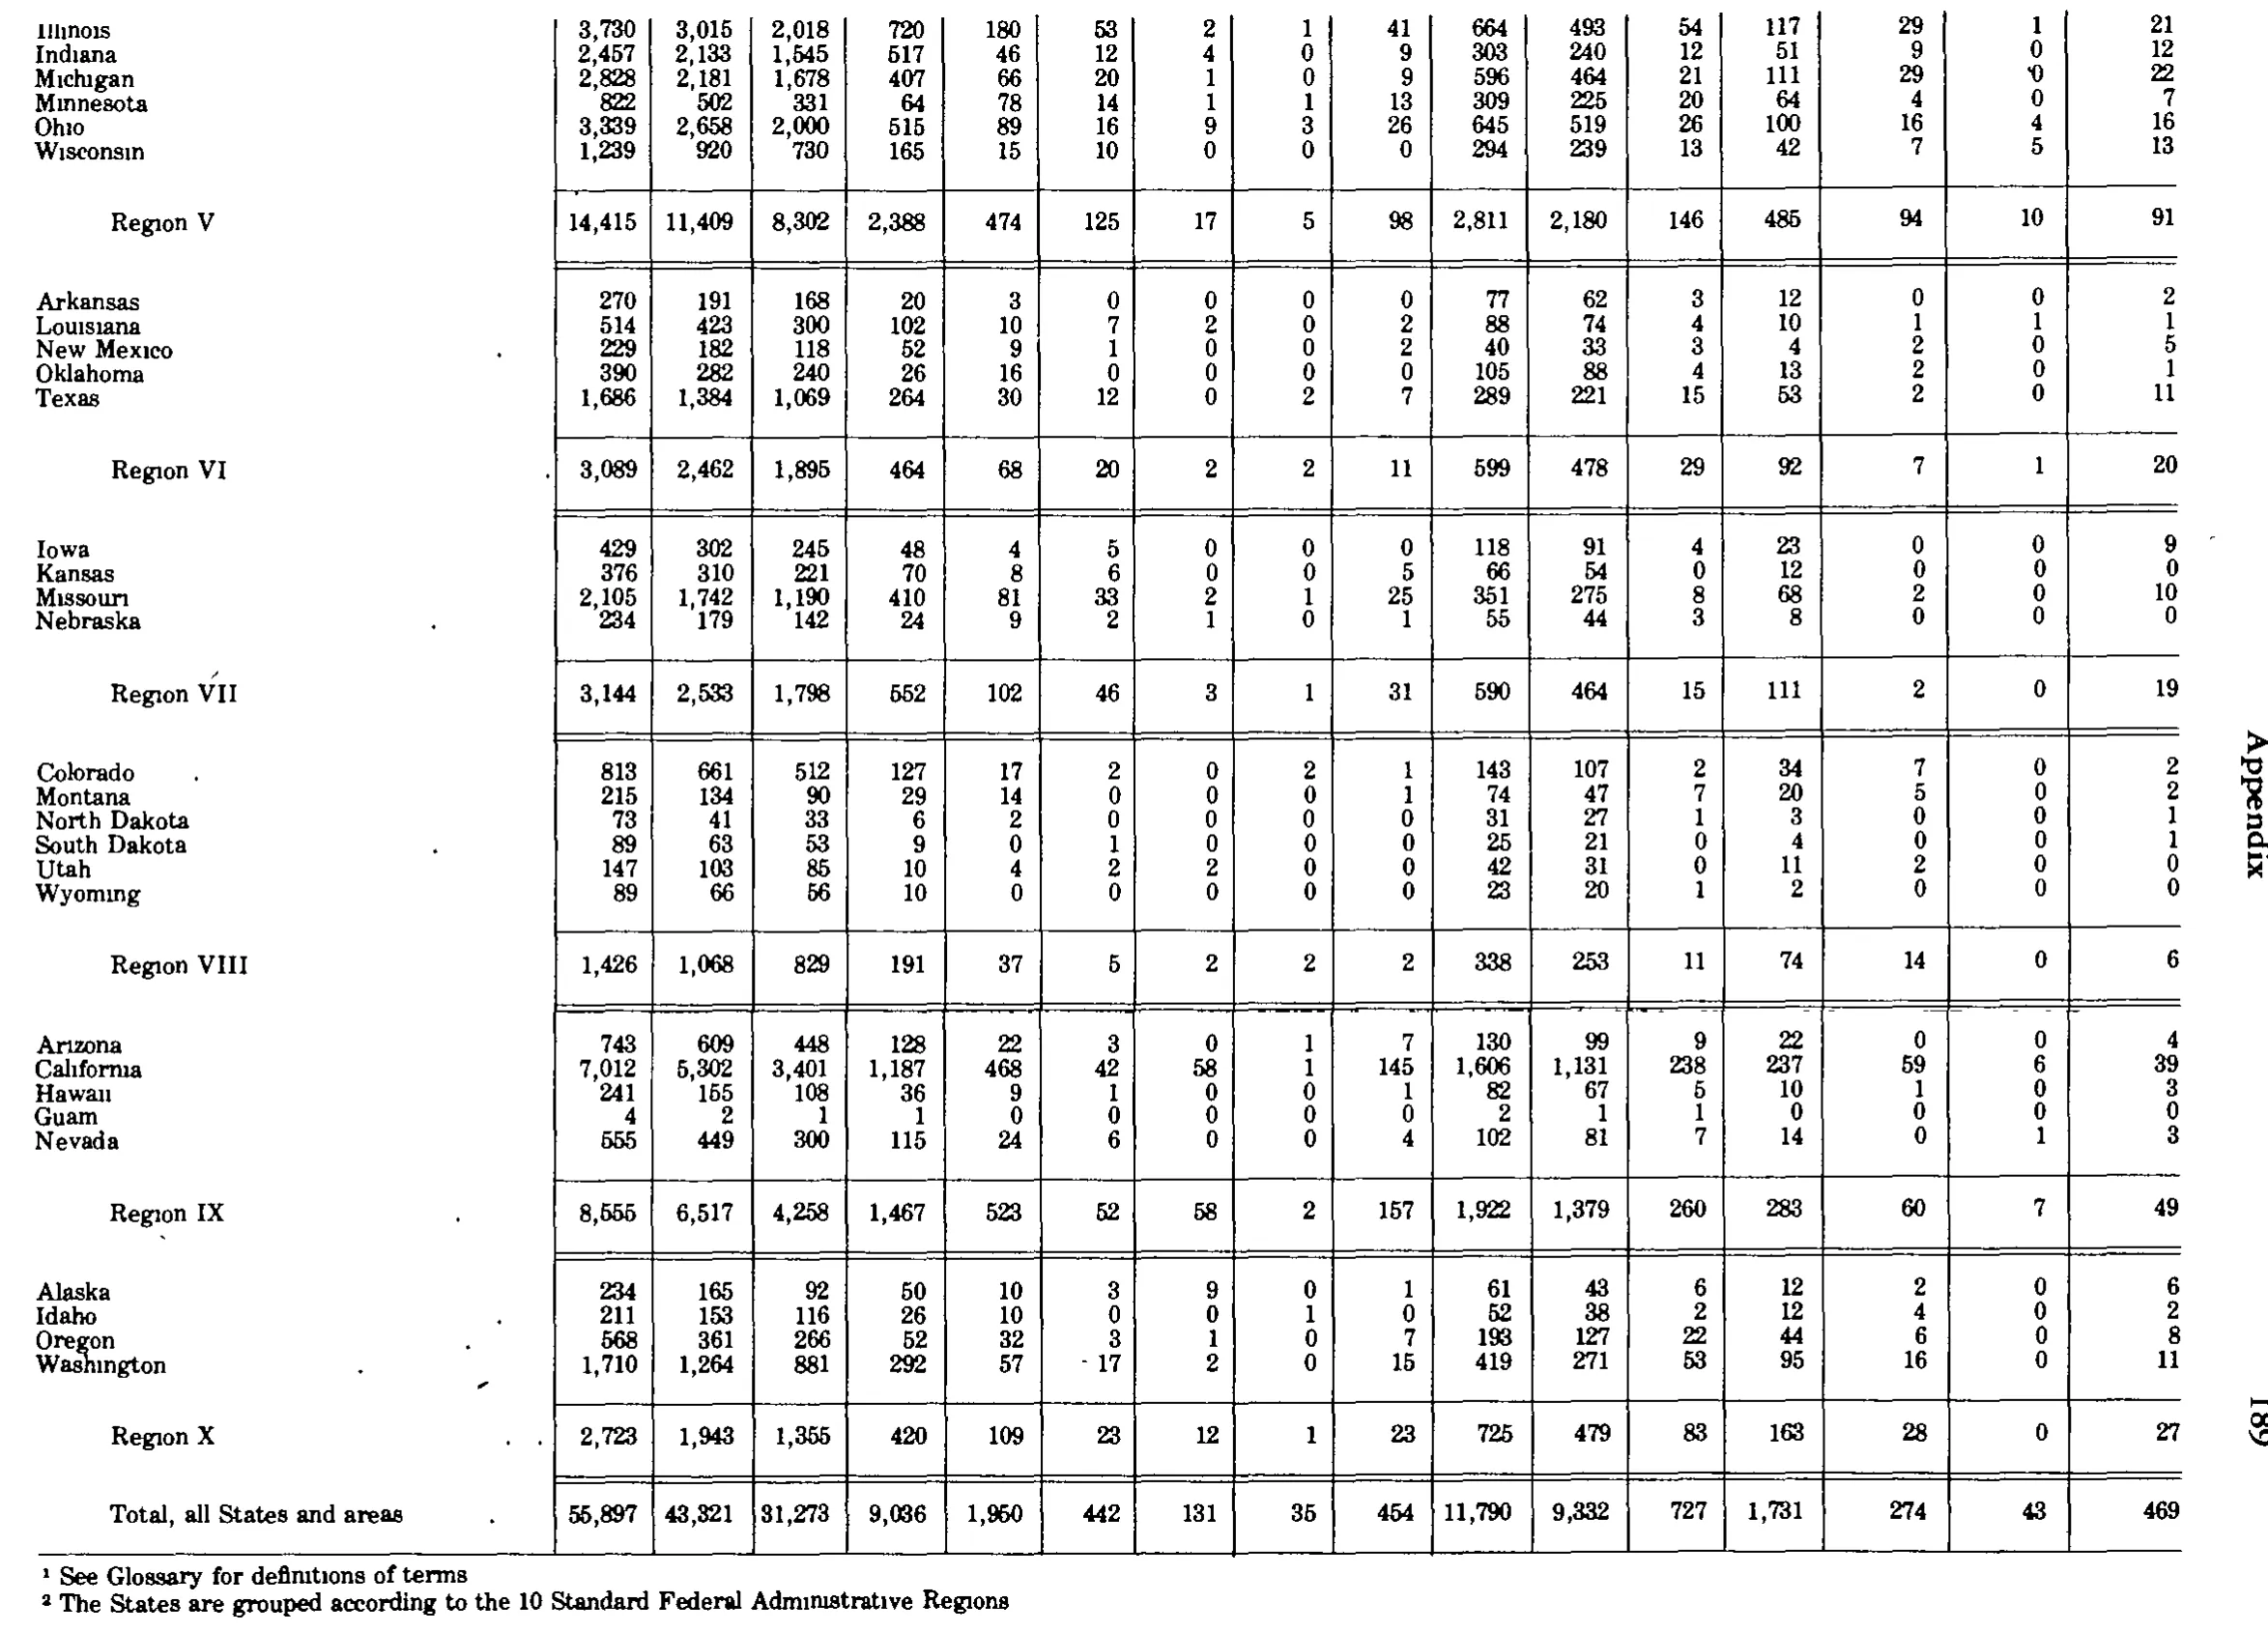
Standard Federal Administrative Regional Distribution of Cases Received Fiscal Year 1981
Stitched from pp. 200–201.
| Standard Federal Regions | All cases | Unfair labor practice cases | Representation cases | Union deauthorization cases | Amendment of certification cases | Unit clarification cases | ||||||||||
|---|---|---|---|---|---|---|---|---|---|---|---|---|---|---|---|---|
| Standard Federal Regions | All cases | All C cases | CA | CB | CC | CD | CE | CG | CP | All R cases | RC | RM | RD | UD | AC | UC |
| Connecticut | 812 | 626 | 513 | 107 | 3 | 2 | 0 | 0 | 1 | 167 | 143 | 8 | 16 | 5 | 8 | 6 |
| Maine | 217 | 153 | 132 | 21 | 0 | 0 | 0 | 0 | 0 | 62 | 49 | 2 | 11 | 0 | 1 | 1 |
| Massachusetts | 1,583 | 1,211 | 899 | 233 | 57 | 16 | 2 | 2 | 2 | 343 | 280 | 18 | 45 | 11 | 0 | 18 |
| New Hampshire | 97 | 64 | 52 | 8 | 4 | 0 | 0 | 0 | 0 | 30 | 24 | 3 | 3 | 1 | 0 | 2 |
| Rhode Island | 214 | 158 | 123 | 26 | 6 | 1 | 0 | 0 | 1 | 52 | 48 | 0 | 4 | 0 | 4 | 0 |
| Vermont | 92 | 70 | 65 | 5 | 0 | 0 | 0 | 0 | 0 | 22 | 12 | 1 | 9 | 0 | 0 | 0 |
| Region I | 3,015 | 2,282 | 1,784 | 400 | 71 | 19 | 2 | 2 | 4 | 676 | 556 | 32 | 88 | 17 | 13 | 27 |
| Delaware | 120 | 94 | 52 | 18 | 20 | 3 | 0 | 0 | 1 | 25 | 19 | 4 | 2 | 0 | 0 | 1 |
| New Jersey | 1,930 | 1,396 | 1,080 | 250 | 35 | 14 | 3 | 1 | 13 | 513 | 436 | 23 | 54 | 14 | 1 | 6 |
| New York | 4,995 | 3,735 | 2,409 | 1,076 | 140 | 42 | 10 | 11 | 47 | 1,110 | 968 | 39 | 103 | 17 | 5 | 128 |
| Puerto Rico | 340 | 201 | 175 | 26 | 0 | 0 | 0 | 0 | 0 | 131 | 118 | 5 | 8 | 3 | 0 | 5 |
| Virgin Islands | 41 | 25 | 21 | 3 | 1 | 0 | 0 | 0 | 0 | 16 | 16 | 0 | 0 | 0 | 0 | 0 |
| Region II | 7,426 | 5,451 | 3,737 | 1,373 | 196 | 59 | 13 | 12 | 61 | 1,795 | 1,557 | 71 | 167 | 34 | 6 | 140 |
| District of Columbia | 338 | 284 | 220 | 49 | 8 | 0 | 3 | 3 | 1 | 44 | 40 | 2 | 2 | 2 | 0 | 8 |
| Maryland | 877 | 709 | 474 | 215 | 14 | 2 | 1 | 2 | 1 | 159 | 142 | 2 | 15 | 3 | 0 | 6 |
| Pennsylvania | 3,285 | 2,528 | 1,738 | 564 | 145 | 52 | 6 | 1 | 22 | 715 | 612 | 24 | 79 | 12 | 1 | 29 |
| Virginia | 703 | 552 | 463 | 82 | 6 | 1 | 0 | 0 | 0 | 147 | 124 | 4 | 19 | 0 | 2 | 2 |
| West Virginia | 675 | 574 | 407 | 111 | 37 | 2 | 1 | 0 | 16 | 95 | 77 | 7 | 11 | 0 | 1 | 5 |
| Region III | 5,878 | 4,647 | 3,302 | 1,021 | 210 | 57 | 11 | 6 | 40 | 1,160 | 995 | 39 | 126 | 17 | 4 | 50 |
| Alabama | 571 | 457 | 352 | 90 | 11 | 3 | 1 | 0 | 0 | 108 | 90 | 6 | 12 | 0 | 0 | 6 |
| Florida | 1,053 | 762 | 617 | 98 | 25 | 14 | 0 | 1 | 7 | 286 | 257 | 9 | 20 | 0 | 0 | 5 |
| Georgia | 1,144 | 948 | 739 | 183 | 17 | 1 | 4 | 0 | 4 | 188 | 145 | 7 | 36 | 0 | 0 | 8 |
| Kentucky | 1,070 | 879 | 708 | 119 | 46 | 0 | 0 | 1 | 5 | 181 | 160 | 2 | 19 | 1 | 0 | 9 |
| Mississippi | 285 | 213 | 179 | 31 | 2 | 1 | 0 | 0 | 0 | 68 | 59 | 2 | 7 | 0 | 0 | 4 |
| North Carolina | 652 | 566 | 512 | 52 | 1 | 1 | 0 | 0 | 0 | 85 | 66 | 4 | 15 | 0 | 1 | 0 |
| South Carolina | 312 | 258 | 211 | 33 | 8 | 0 | 6 | 0 | 0 | 53 | 41 | 6 | 6 | 0 | 0 | 1 |
| Tennessee | 1,139 | 926 | 695 | 154 | 50 | 16 | 0 | 0 | 11 | 205 | 173 | 5 | 27 | 0 | 1 | 7 |
| Region IV | 6,226 | 5,009 | 4,013 | 760 | 160 | 36 | 11 | 2 | 27 | 1,174 | 991 | 41 | 142 | 1 | 2 | 40 |
| Illinois | 3,730 | 3,015 | 2,018 | 720 | 180 | 53 | 2 | 1 | 41 | 664 | 493 | 54 | 117 | 29 | 1 | 21 |
| Indiana | 2,457 | 2,133 | 1,545 | 517 | 46 | 12 | 4 | 0 | 9 | 303 | 240 | 12 | 51 | 9 | 0 | 12 |
| Michigan | 2,828 | 2,181 | 1,678 | 407 | 66 | 20 | 1 | 0 | 9 | 596 | 464 | 21 | 111 | 29 | 0 | 22 |
| Minnesota | 822 | 502 | 331 | 64 | 78 | 14 | 1 | 1 | 13 | 309 | 225 | 20 | 64 | 4 | 0 | 7 |
| Ohio | 3,339 | 2,658 | 2,000 | 515 | 89 | 16 | 9 | 3 | 26 | 645 | 519 | 26 | 100 | 16 | 4 | 16 |
| Wisconsin | 1,239 | 920 | 730 | 165 | 15 | 10 | 0 | 0 | 0 | 294 | 239 | 13 | 42 | 7 | 5 | 13 |
| Region V | 14,415 | 11,409 | 8,302 | 2,388 | 474 | 125 | 17 | 5 | 98 | 2,811 | 2,180 | 146 | 485 | 94 | 10 | 91 |
| Arkansas | 270 | 191 | 168 | 20 | 3 | 0 | 0 | 0 | 0 | 77 | 62 | 3 | 12 | 0 | 0 | 2 |
| Louisiana | 514 | 423 | 300 | 102 | 10 | 7 | 2 | 0 | 2 | 88 | 74 | 4 | 10 | 1 | 1 | 1 |
| New Mexico | 229 | 182 | 118 | 52 | 9 | 1 | 0 | 0 | 2 | 40 | 33 | 3 | 4 | 2 | 0 | 5 |
| Oklahoma | 390 | 282 | 240 | 26 | 16 | 0 | 0 | 0 | 0 | 105 | 88 | 4 | 13 | 2 | 0 | 1 |
| Texas | 1,686 | 1,384 | 1,069 | 264 | 30 | 12 | 0 | 2 | 7 | 289 | 221 | 15 | 53 | 2 | 0 | 11 |
| Region VI | 3,089 | 2,462 | 1,895 | 464 | 68 | 20 | 2 | 2 | 11 | 599 | 478 | 29 | 92 | 7 | 1 | 20 |
| Iowa | 429 | 302 | 245 | 48 | 4 | 5 | 0 | 0 | 0 | 118 | 91 | 4 | 23 | 0 | 0 | 9 |
| Kansas | 376 | 310 | 221 | 70 | 8 | 6 | 0 | 0 | 5 | 66 | 54 | 0 | 12 | 0 | 0 | 0 |
| Missouri | 2,105 | 1,742 | 1,190 | 410 | 81 | 33 | 2 | 1 | 25 | 351 | 275 | 8 | 68 | 2 | 0 | 10 |
| Nebraska | 234 | 179 | 142 | 24 | 9 | 2 | 1 | 0 | 1 | 55 | 44 | 3 | 8 | 0 | 0 | 0 |
| Region VII | 3,144 | 2,533 | 1,798 | 552 | 102 | 46 | 3 | 1 | 31 | 590 | 464 | 15 | 111 | 2 | 0 | 19 |
| Colorado | 813 | 661 | 512 | 127 | 17 | 2 | 0 | 2 | 1 | 143 | 107 | 2 | 34 | 7 | 0 | 2 |
| Montana | 215 | 134 | 90 | 29 | 14 | 0 | 0 | 0 | 1 | 74 | 47 | 7 | 20 | 5 | 0 | 2 |
| North Dakota | 73 | 41 | 33 | 6 | 2 | 0 | 0 | 0 | 0 | 31 | 27 | 1 | 3 | 0 | 0 | 1 |
| South Dakota | 89 | 63 | 53 | 9 | 0 | 1 | 0 | 0 | 0 | 25 | 21 | 0 | 4 | 0 | 0 | 1 |
| Utah | 147 | 103 | 85 | 10 | 4 | 2 | 2 | 0 | 0 | 42 | 31 | 0 | 11 | 2 | 0 | 0 |
| Wyoming | 89 | 66 | 56 | 10 | 0 | 0 | 0 | 0 | 0 | 23 | 20 | 1 | 2 | 0 | 0 | 0 |
| Region VIII | 1,426 | 1,068 | 829 | 191 | 37 | 5 | 2 | 2 | 2 | 338 | 253 | 11 | 74 | 14 | 0 | 6 |
| Arizona | 743 | 609 | 448 | 128 | 22 | 3 | 0 | 1 | 7 | 130 | 99 | 9 | 22 | 0 | 0 | 4 |
| California | 7,012 | 5,302 | 3,401 | 1,187 | 468 | 42 | 58 | 1 | 145 | 1,606 | 1,131 | 238 | 237 | 59 | 6 | 39 |
| Hawaii | 241 | 155 | 108 | 36 | 9 | 1 | 0 | 0 | 1 | 82 | 67 | 5 | 10 | 1 | 0 | 3 |
| Guam | 4 | 2 | 1 | 1 | 0 | 0 | 0 | 0 | 0 | 2 | 1 | 1 | 0 | 0 | 0 | 0 |
| Nevada | 555 | 449 | 300 | 115 | 24 | 6 | 0 | 0 | 4 | 102 | 81 | 7 | 14 | 0 | 1 | 3 |
| Region IX | 8,555 | 6,517 | 4,258 | 1,467 | 523 | 52 | 58 | 2 | 157 | 1,922 | 1,379 | 260 | 283 | 60 | 7 | 49 |
| Alaska | 234 | 165 | 92 | 50 | 10 | 3 | 9 | 0 | 1 | 61 | 43 | 6 | 12 | 2 | 0 | 6 |
| Idaho | 211 | 153 | 116 | 26 | 10 | 0 | 0 | 1 | 0 | 52 | 38 | 2 | 12 | 4 | 0 | 2 |
| Oregon | 568 | 361 | 266 | 52 | 32 | 3 | 3 | 0 | 7 | 193 | 127 | 22 | 44 | 6 | 0 | 8 |
| Washington | 1,710 | 1,264 | 881 | 292 | 57 | 17 | 2 | 0 | 15 | 419 | 271 | 53 | 95 | 16 | 0 | 11 |
| Region X | 2,723 | 1,943 | 1,355 | 420 | 109 | 23 | 12 | 1 | 23 | 725 | 479 | 83 | 163 | 28 | 0 | 27 |
| Total, all States and areas | 55,897 | 43,321 | 31,273 | 9,036 | 1,950 | 442 | 131 | 35 | 454 | 11,790 | 9,332 | 727 | 1,731 | 274 | 43 | 469 |
- 1 See Glossary for definitions of terms
- 2 The States are grouped according to the 10 Standard Federal Administrative Regions
848 of 850 figures sit in a row or column sum that works out. 4 cells break a sum: 'Rhode Island', column 3: prints 158, columns 4 to 10 add to 157; 'Oregon', column 3: prints 361, columns 4 to 10 add to 363; 'Region X', column 8: prints 12, rows 'Alaska' to 'Washington' add to 14; 'Region I', column 6: prints 71, rows 'Connecticut' to 'Vermont' add to 70.
Reader’s notes
p. 200. Crop shows 17 columns. The stub heading carries a raised footnote marker 2 ("Standard Federal Regions ^2"); the footnote text itself is not printed within this crop, so `footnotes` is empty. The headings "All cases" (col 1), "Union deauthorization cases", "Amendment of certification cases" and "Unit clarification cases" are tall single headings printed across both heading levels, and the UD / AC / UC column letters sit on the second heading level beneath the last three of them. The crop is cut off at the bottom: the table ends after the Region IV subtotal and continues on the following page(s) (Regions V onward and the grand total are not in this image). Doubtful cell: Rhode Island, column CC — I read the glyph as 6, but the arithmetic disagrees in two independent ways. The Rhode Island row's C-case components (123+26+6+1+0+0+1) give 157 against a printed "All C cases" of 158, and the Region I CC column (3+0+57+4+6+0) gives 70 against a printed subtotal of 71. A value of 7 in that cell would reconcile both, and no other single-cell change reconciles either. Transcribed as seen (6) rather than corrected; the cell should be re-checked against a higher-resolution scan. Every other cell in the crop is internally consistent: for all 24 state rows, "All cases" equals All C + All R + UD + AC + UC and "All C cases" equals CA+CB+CC+CD+CE+CG+CP; and all four regional subtotal rows (Regions I-IV) equal the column sums of their member states in all 16 numeric columns, with the single CC exception in Region I noted above. Minor scan artifacts, not transcribed: a stray tick after "2,282" in the Region I "All C cases" cell, a stray mark left of "57" in the Region III "CD" cell, and a stray apostrophe-like mark left of "5" in the Connecticut "UD" cell. Leader dots and the trailing periods they produce were dropped from row labels (e.g. "Rhode Island.", "Virginia.", "Alabama..", "South Carolina." in the image).
p. 201. This crop continues a table from the preceding page: no column headings are printed on it, so header_rows is empty. The grid is a stub plus 16 numeric columns, counted from the vertical column rules; the stub's leader dots (and the stray leader-dot remnants beside New Mexico, Nebraska, Colorado, South Dakota, Region VI, Region IX, Washington, Region X and the total row) have been dropped. Column assignment was checked by adding each region's member States: Regions V, VI, VII, VIII and IX reconcile with their printed subtotals in all 16 columns, confirming the alignment. Region X reconciles in 15 of 16 columns; in column 7 the four States as transcribed (Alaska 9, Idaho 0, Oregon 3, Washington 2) sum to 14 against a printed subtotal of 12. One of the Alaska or Oregon digits in that column is either a misprint or a misreading of the scan (Alaska 9 vs. a possible 7, or Oregon 3 vs. a possible 1); the cells are transcribed as they appear and nothing was adjusted to force the total. Michigan, column 15: a stray ink speck sits just left of the digit, giving it the look of an apostrophe; the digit is read as 0, which the Region V subtotal of 10 confirms. Washington, column 6: a stray dot precedes 17; the value is 17. The "Total, all States and areas" row cannot be verified from this crop because Regions I through IV are printed on the previous page. The right-margin running head ("Appendix") and page number ("189") are omitted.
Source image
Source data: U.S. NLRB Annual Reports (public domain). Reconstruction by NLRB Stats Archive. Read by claude-opus-5 (effort max, prompt extract_v1) from the 300-dpi scan; stitched by page. Updated October 2026.