NLRB Stats Archive › Annual Reports › FY1981 › Geographic Distribution of Cases Received, Fiscal Year 1981
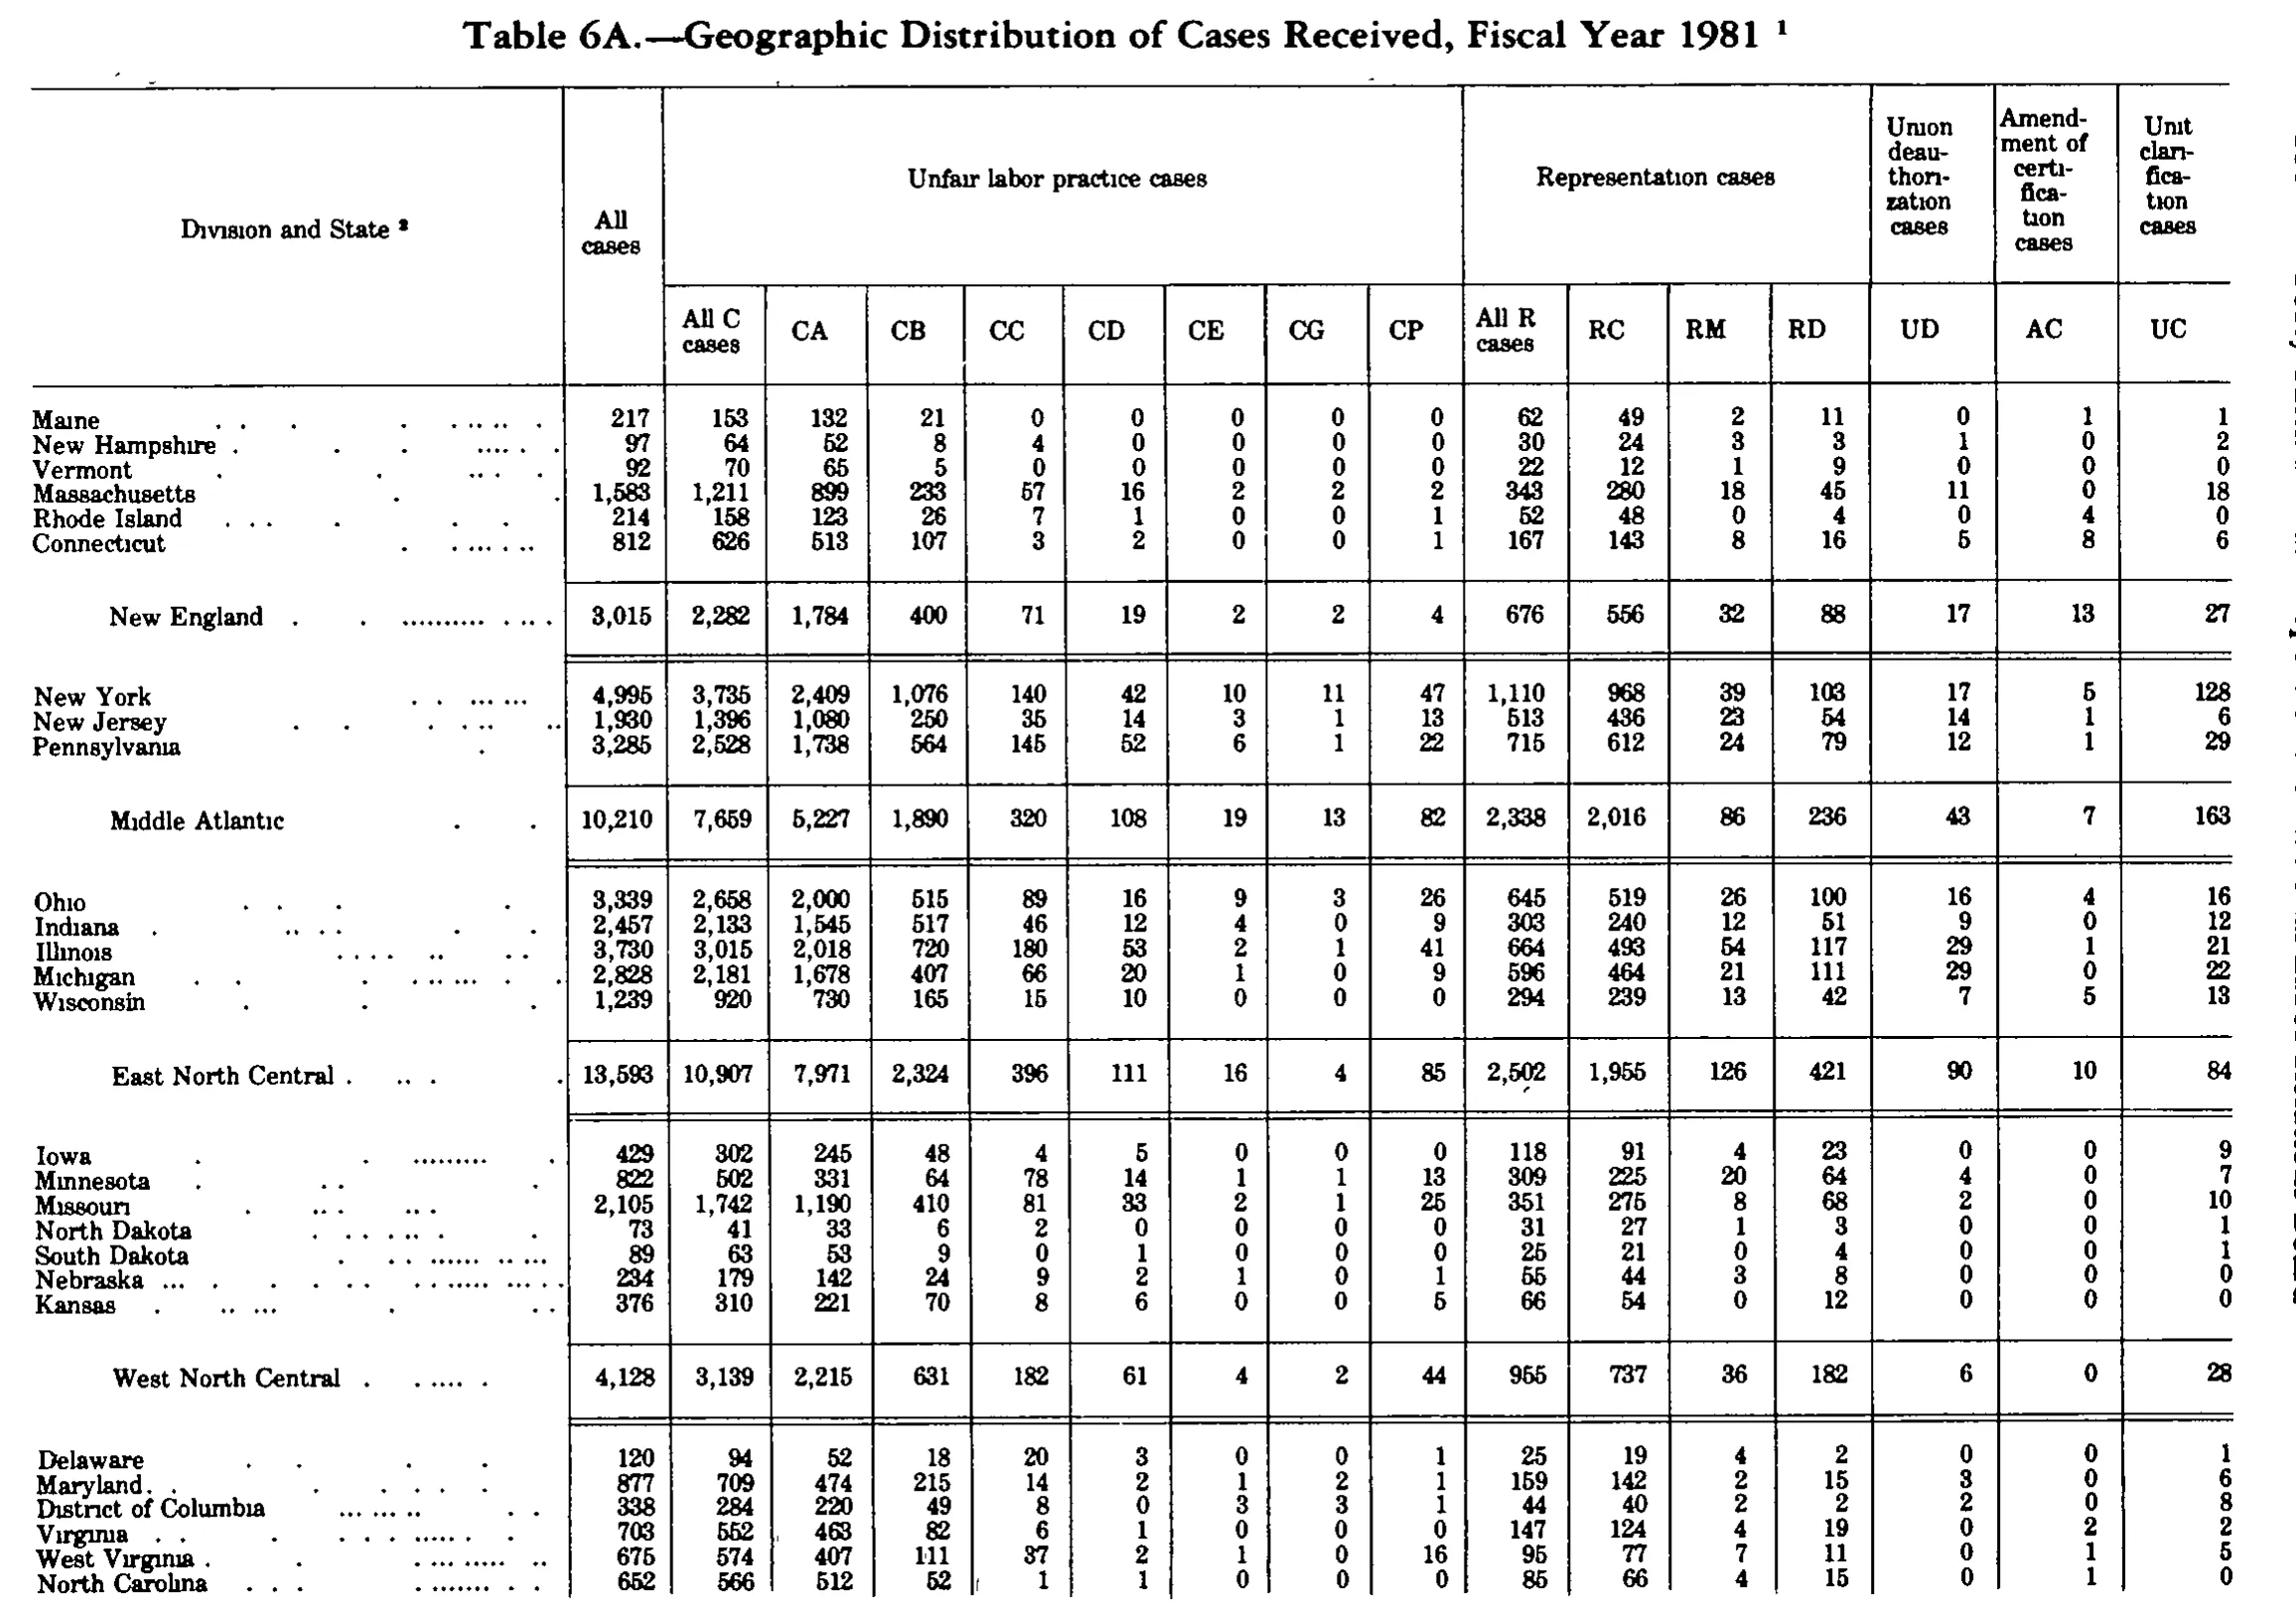
Geographic Distribution of Cases Received, Fiscal Year 1981
Pages shown separately: their columns differ (pp. 198, 199).
Page 198
| Division and State | All cases | Unfair labor practice cases | Representation cases | Union deauthorization cases | Amendment of certification cases | Unit clarification cases | ||||||||||
|---|---|---|---|---|---|---|---|---|---|---|---|---|---|---|---|---|
| Division and State | All cases | All C cases | CA | CB | CC | CD | CE | CG | CP | All R cases | RC | RM | RD | UD | AC | UC |
| Maine | 217 | 153 | 132 | 21 | 0 | 0 | 0 | 0 | 0 | 62 | 49 | 2 | 11 | 0 | 1 | 1 |
| New Hampshire | 97 | 64 | 52 | 8 | 4 | 0 | 0 | 0 | 0 | 30 | 24 | 3 | 3 | 1 | 0 | 2 |
| Vermont | 92 | 70 | 65 | 5 | 0 | 0 | 0 | 0 | 0 | 22 | 12 | 1 | 9 | 0 | 0 | 0 |
| Massachusetts | 1,583 | 1,211 | 899 | 233 | 57 | 16 | 2 | 2 | 2 | 343 | 280 | 18 | 45 | 11 | 0 | 18 |
| Rhode Island | 214 | 158 | 123 | 26 | 7 | 1 | 0 | 0 | 1 | 52 | 48 | 0 | 4 | 0 | 4 | 0 |
| Connecticut | 812 | 626 | 513 | 107 | 3 | 2 | 0 | 0 | 1 | 167 | 143 | 8 | 16 | 5 | 8 | 6 |
| New England | 3,015 | 2,282 | 1,784 | 400 | 71 | 19 | 2 | 2 | 4 | 676 | 556 | 32 | 88 | 17 | 13 | 27 |
| New York | 4,995 | 3,735 | 2,409 | 1,076 | 140 | 42 | 10 | 11 | 47 | 1,110 | 968 | 39 | 103 | 17 | 5 | 128 |
| New Jersey | 1,930 | 1,396 | 1,080 | 250 | 35 | 14 | 3 | 1 | 13 | 513 | 436 | 23 | 54 | 14 | 1 | 6 |
| Pennsylvania | 3,285 | 2,528 | 1,738 | 564 | 145 | 52 | 6 | 1 | 22 | 715 | 612 | 24 | 79 | 12 | 1 | 29 |
| Middle Atlantic | 10,210 | 7,659 | 5,227 | 1,890 | 320 | 108 | 19 | 13 | 82 | 2,338 | 2,016 | 86 | 236 | 43 | 7 | 163 |
| Ohio | 3,339 | 2,658 | 2,000 | 515 | 89 | 16 | 9 | 3 | 26 | 645 | 519 | 26 | 100 | 16 | 4 | 16 |
| Indiana | 2,457 | 2,133 | 1,545 | 517 | 46 | 12 | 4 | 0 | 9 | 303 | 240 | 12 | 51 | 9 | 0 | 12 |
| Illinois | 3,730 | 3,015 | 2,018 | 720 | 180 | 53 | 2 | 1 | 41 | 664 | 493 | 54 | 117 | 29 | 1 | 21 |
| Michigan | 2,828 | 2,181 | 1,678 | 407 | 66 | 20 | 1 | 0 | 9 | 596 | 464 | 21 | 111 | 29 | 0 | 22 |
| Wisconsin | 1,239 | 920 | 730 | 165 | 15 | 10 | 0 | 0 | 0 | 294 | 239 | 13 | 42 | 7 | 5 | 13 |
| East North Central | 13,593 | 10,907 | 7,971 | 2,324 | 396 | 111 | 16 | 4 | 85 | 2,502 | 1,955 | 126 | 421 | 90 | 10 | 84 |
| Iowa | 429 | 302 | 245 | 48 | 4 | 5 | 0 | 0 | 0 | 118 | 91 | 4 | 23 | 0 | 0 | 9 |
| Minnesota | 822 | 502 | 331 | 64 | 78 | 14 | 1 | 1 | 13 | 309 | 225 | 20 | 64 | 4 | 0 | 7 |
| Missouri | 2,105 | 1,742 | 1,190 | 410 | 81 | 33 | 2 | 1 | 25 | 351 | 275 | 8 | 68 | 2 | 0 | 10 |
| North Dakota | 73 | 41 | 33 | 6 | 2 | 0 | 0 | 0 | 0 | 31 | 27 | 1 | 3 | 0 | 0 | 1 |
| South Dakota | 89 | 63 | 53 | 9 | 0 | 1 | 0 | 0 | 0 | 25 | 21 | 0 | 4 | 0 | 0 | 1 |
| Nebraska | 234 | 179 | 142 | 24 | 9 | 2 | 1 | 0 | 1 | 55 | 44 | 3 | 8 | 0 | 0 | 0 |
| Kansas | 376 | 310 | 221 | 70 | 8 | 6 | 0 | 0 | 5 | 66 | 54 | 0 | 12 | 0 | 0 | 0 |
| West North Central | 4,128 | 3,139 | 2,215 | 631 | 182 | 61 | 4 | 2 | 44 | 955 | 737 | 36 | 182 | 6 | 0 | 28 |
| Delaware | 120 | 94 | 52 | 18 | 20 | 3 | 0 | 0 | 1 | 25 | 19 | 4 | 2 | 0 | 0 | 1 |
| Maryland | 877 | 709 | 474 | 215 | 14 | 2 | 1 | 2 | 1 | 159 | 142 | 2 | 15 | 3 | 0 | 6 |
| District of Columbia | 338 | 284 | 220 | 49 | 8 | 0 | 3 | 3 | 1 | 44 | 40 | 2 | 2 | 2 | 0 | 8 |
| Virginia | 703 | 552 | 463 | 82 | 6 | 1 | 0 | 0 | 0 | 147 | 124 | 4 | 19 | 0 | 2 | 2 |
| West Virginia | 675 | 574 | 407 | 111 | 37 | 2 | 1 | 0 | 16 | 95 | 77 | 7 | 11 | 0 | 1 | 5 |
| North Carolina | 652 | 566 | 512 | 52 | 1 | 1 | 0 | 0 | 0 | 85 | 66 | 4 | 15 | 0 | 1 | 0 |
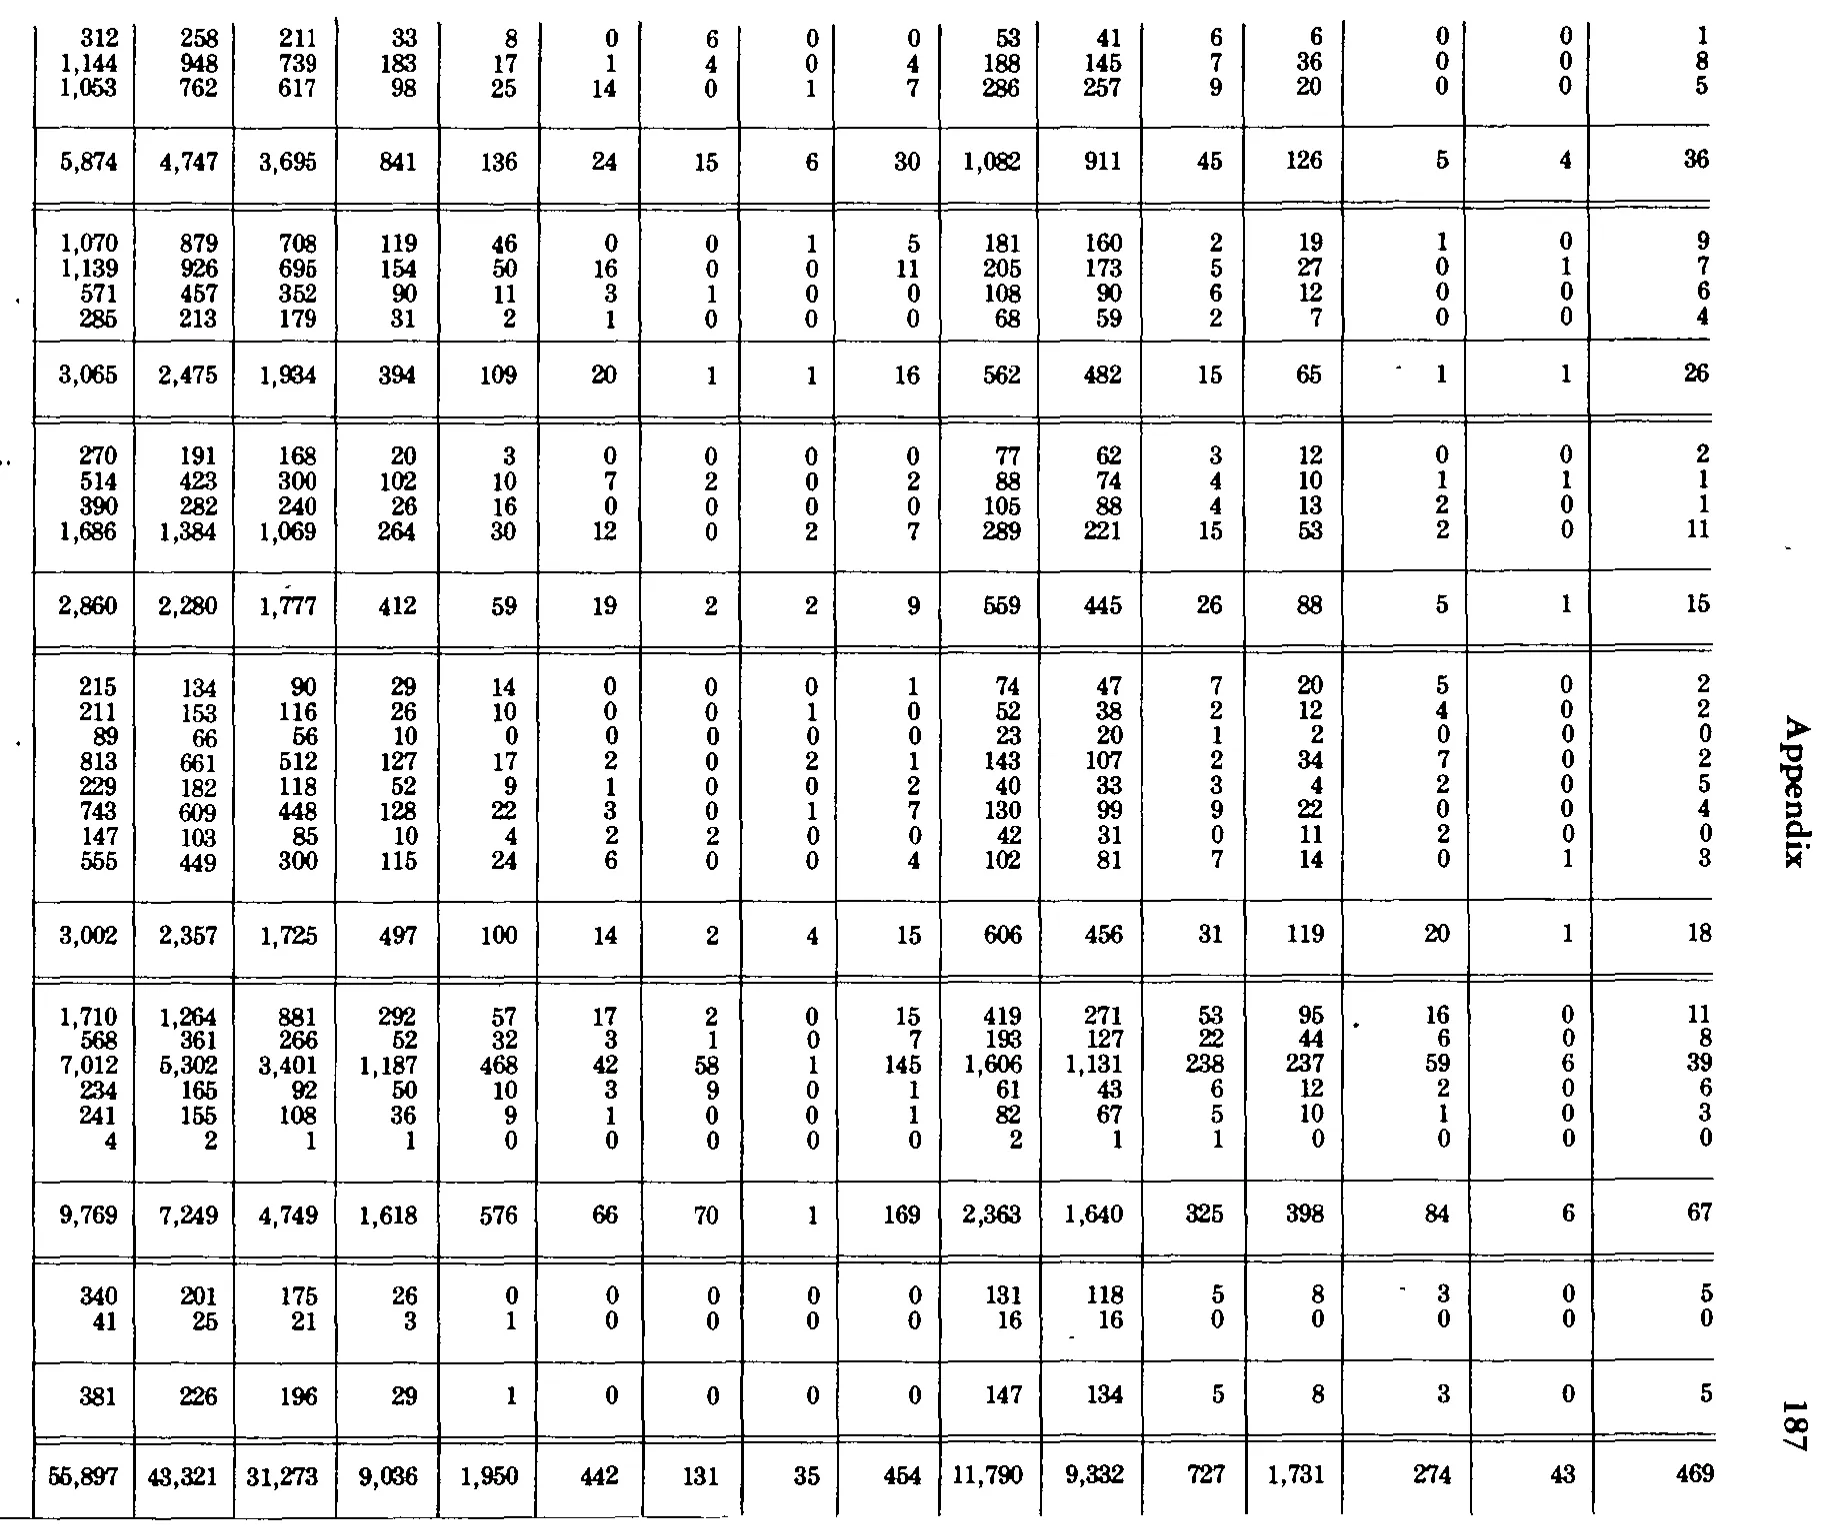
Page 199
| 312 | 258 | 211 | 33 | 8 | 0 | 6 | 0 | 0 | 53 | 41 | 6 | 6 | 0 | 0 | 1 |
|---|---|---|---|---|---|---|---|---|---|---|---|---|---|---|---|
| 1,144 | 948 | 739 | 183 | 17 | 1 | 4 | 0 | 4 | 188 | 145 | 7 | 36 | 0 | 0 | 8 |
| 1,053 | 762 | 617 | 98 | 25 | 14 | 0 | 1 | 7 | 286 | 257 | 9 | 20 | 0 | 0 | 5 |
| 5,874 | 4,747 | 3,695 | 841 | 136 | 24 | 15 | 6 | 30 | 1,082 | 911 | 45 | 126 | 5 | 4 | 36 |
| 1,070 | 879 | 708 | 119 | 46 | 0 | 0 | 1 | 5 | 181 | 160 | 2 | 19 | 1 | 0 | 9 |
| 1,139 | 926 | 695 | 154 | 50 | 16 | 0 | 0 | 11 | 205 | 173 | 5 | 27 | 0 | 1 | 7 |
| 571 | 457 | 352 | 90 | 11 | 3 | 1 | 0 | 0 | 108 | 90 | 6 | 12 | 0 | 0 | 6 |
| 285 | 213 | 179 | 31 | 2 | 1 | 0 | 0 | 0 | 68 | 59 | 2 | 7 | 0 | 0 | 4 |
| 3,065 | 2,475 | 1,934 | 394 | 109 | 20 | 1 | 1 | 16 | 562 | 482 | 15 | 65 | 1 | 1 | 26 |
| 270 | 191 | 168 | 20 | 3 | 0 | 0 | 0 | 0 | 77 | 62 | 3 | 12 | 0 | 0 | 2 |
| 514 | 423 | 300 | 102 | 10 | 7 | 2 | 0 | 2 | 88 | 74 | 4 | 10 | 1 | 1 | 1 |
| 390 | 282 | 240 | 26 | 16 | 0 | 0 | 0 | 0 | 105 | 88 | 4 | 13 | 2 | 0 | 1 |
| 1,686 | 1,384 | 1,069 | 264 | 30 | 12 | 0 | 2 | 7 | 289 | 221 | 15 | 53 | 2 | 0 | 11 |
| 2,860 | 2,280 | 1,777 | 412 | 59 | 19 | 2 | 2 | 9 | 559 | 445 | 26 | 88 | 5 | 1 | 15 |
| 215 | 134 | 90 | 29 | 14 | 0 | 0 | 0 | 1 | 74 | 47 | 7 | 20 | 5 | 0 | 2 |
| 211 | 153 | 116 | 26 | 10 | 0 | 0 | 1 | 0 | 52 | 38 | 2 | 12 | 4 | 0 | 2 |
| 89 | 66 | 56 | 10 | 0 | 0 | 0 | 0 | 0 | 23 | 20 | 1 | 2 | 0 | 0 | 0 |
| 813 | 661 | 512 | 127 | 17 | 2 | 0 | 2 | 1 | 143 | 107 | 2 | 34 | 7 | 0 | 2 |
| 229 | 182 | 118 | 52 | 9 | 1 | 0 | 0 | 2 | 40 | 33 | 3 | 4 | 2 | 0 | 5 |
| 743 | 609 | 448 | 128 | 22 | 3 | 0 | 1 | 7 | 130 | 99 | 9 | 22 | 0 | 0 | 4 |
| 147 | 103 | 85 | 10 | 4 | 2 | 2 | 0 | 0 | 42 | 31 | 0 | 11 | 2 | 0 | 0 |
| 555 | 449 | 300 | 115 | 24 | 6 | 0 | 0 | 4 | 102 | 81 | 7 | 14 | 0 | 1 | 3 |
| 3,002 | 2,357 | 1,725 | 497 | 100 | 14 | 2 | 4 | 15 | 606 | 456 | 31 | 119 | 20 | 1 | 18 |
| 1,710 | 1,264 | 881 | 292 | 57 | 17 | 2 | 0 | 15 | 419 | 271 | 53 | 95 | 16 | 0 | 11 |
| 568 | 361 | 266 | 52 | 32 | 3 | 1 | 0 | 7 | 193 | 127 | 22 | 44 | 6 | 0 | 8 |
| 7,012 | 5,302 | 3,401 | 1,187 | 468 | 42 | 58 | 1 | 145 | 1,606 | 1,131 | 238 | 237 | 59 | 6 | 39 |
| 234 | 165 | 92 | 50 | 10 | 3 | 9 | 0 | 1 | 61 | 43 | 6 | 12 | 2 | 0 | 6 |
| 241 | 155 | 108 | 36 | 9 | 1 | 0 | 0 | 1 | 82 | 67 | 5 | 10 | 1 | 0 | 3 |
| 4 | 2 | 1 | 1 | 0 | 0 | 0 | 0 | 0 | 2 | 1 | 1 | 0 | 0 | 0 | 0 |
| 9,769 | 7,249 | 4,749 | 1,618 | 576 | 66 | 70 | 1 | 169 | 2,363 | 1,640 | 325 | 398 | 84 | 6 | 67 |
| 340 | 201 | 175 | 26 | 0 | 0 | 0 | 0 | 0 | 131 | 118 | 5 | 8 | 3 | 0 | 5 |
| 41 | 25 | 21 | 3 | 1 | 0 | 0 | 0 | 0 | 16 | 16 | 0 | 0 | 0 | 0 | 0 |
| 381 | 226 | 196 | 29 | 1 | 0 | 0 | 0 | 0 | 147 | 134 | 5 | 8 | 3 | 0 | 5 |
| 55,897 | 43,321 | 31,273 | 9,036 | 1,950 | 442 | 131 | 35 | 454 | 11,790 | 9,332 | 727 | 1,731 | 274 | 43 | 469 |
Reader’s notes
p. 198. 17 columns: stub, "All cases", eight unfair-labor-practice columns, four representation columns, and the UD/AC/UC columns. The crop is cut off at the bottom: the table continues past "North Carolina" (the South Atlantic division subtotal and the remaining divisions are not on this image), and no footnote text is printed on this crop even though the caption carries a raised 1 and the stub heading a raised 2. The division subtotal rows (New England, Middle Atlantic, East North Central, West North Central) are indented and set off by rules in the original; they are transcribed as ordinary rows here. Every state row and every division subtotal shown was checked against its own component columns and all add correctly, so no misprints are suspected. The scan is a coarse bitmap in which the superscript dots over "i" often drop out (e.g. "Ohio", "Illinois", "Michigan", "Missouri", "Virginia"); labels are given in their standard spelling. The "AC" and "UC" readings for Rhode Island (4 and 0) and the "UD"/"AC"/"UC" readings for Connecticut (5, 8, 6) sit in tight columns but are confirmed by the New England subtotal.
p. 199. Crop structure: this is the right-hand page (printed page number 187, "Appendix" running head in the right margin) of a table printed across a two-page spread. It carries 16 ruled numeric columns and NO stub column — the row labels are printed on the facing left-hand page and are not on this image, so cell 0 here is the first printed numeric column (a grand-total column), not a row label. No column headings are printed on this crop either, so header_rows is empty. Row labels therefore cannot be supplied from this image alone. Row grouping as printed (horizontal rules): a partial section of 3 data rows + total (5,874...); then 4 data rows + total (3,065...); 4 data rows + total (2,860...); 8 data rows + total (3,002...); 6 data rows + total (9,769...); 2 data rows + total (381...); and a final grand-total row (55,897...). The first section is incomplete — its printed total 5,874 far exceeds the sum of the 3 rows shown (2,509), because the section's earlier rows are on the preceding page. Likewise the grand total 55,897 exceeds the sum of the section totals visible here (24,951). Verification: every visible row satisfies the table's internal identities — col0 = col1 + col9 + col13 + col14 + col15; col1 = sum of cols 2-8; col9 = col10 + col11 + col12 — and each complete section's column sums equal its printed total row. The grand-total row also satisfies both identities. Nothing appeared misprinted. Possible scan artifacts, read as dust and NOT transcribed as footnote markers or digits: a small dash/speck left of the "1" in the 3,065-total row col 13; a speck left of the "3" in the 340 row col 13; a speck right of "95" in the 1,710 row col 12; a speck under "16" in the 41 row col 10; and two stray dots in the left page margin outside the table rule.
Source image
Source data: U.S. NLRB Annual Reports (public domain). Reconstruction by NLRB Stats Archive. Read by claude-opus-5 (effort max, prompt extract_v1) from the 300-dpi scan; stitched by page. Updated October 2026.