NLRB Stats Archive › Annual Reports › FY1980 › Proceedings Decided by Circuit Courts of Appeals on Petitions for Enforcement and/or Review of Board Orders, Fiscal Year 1980, Compared With 5-Year Cumulative Totals, Fiscal Years 1975 Through 1979
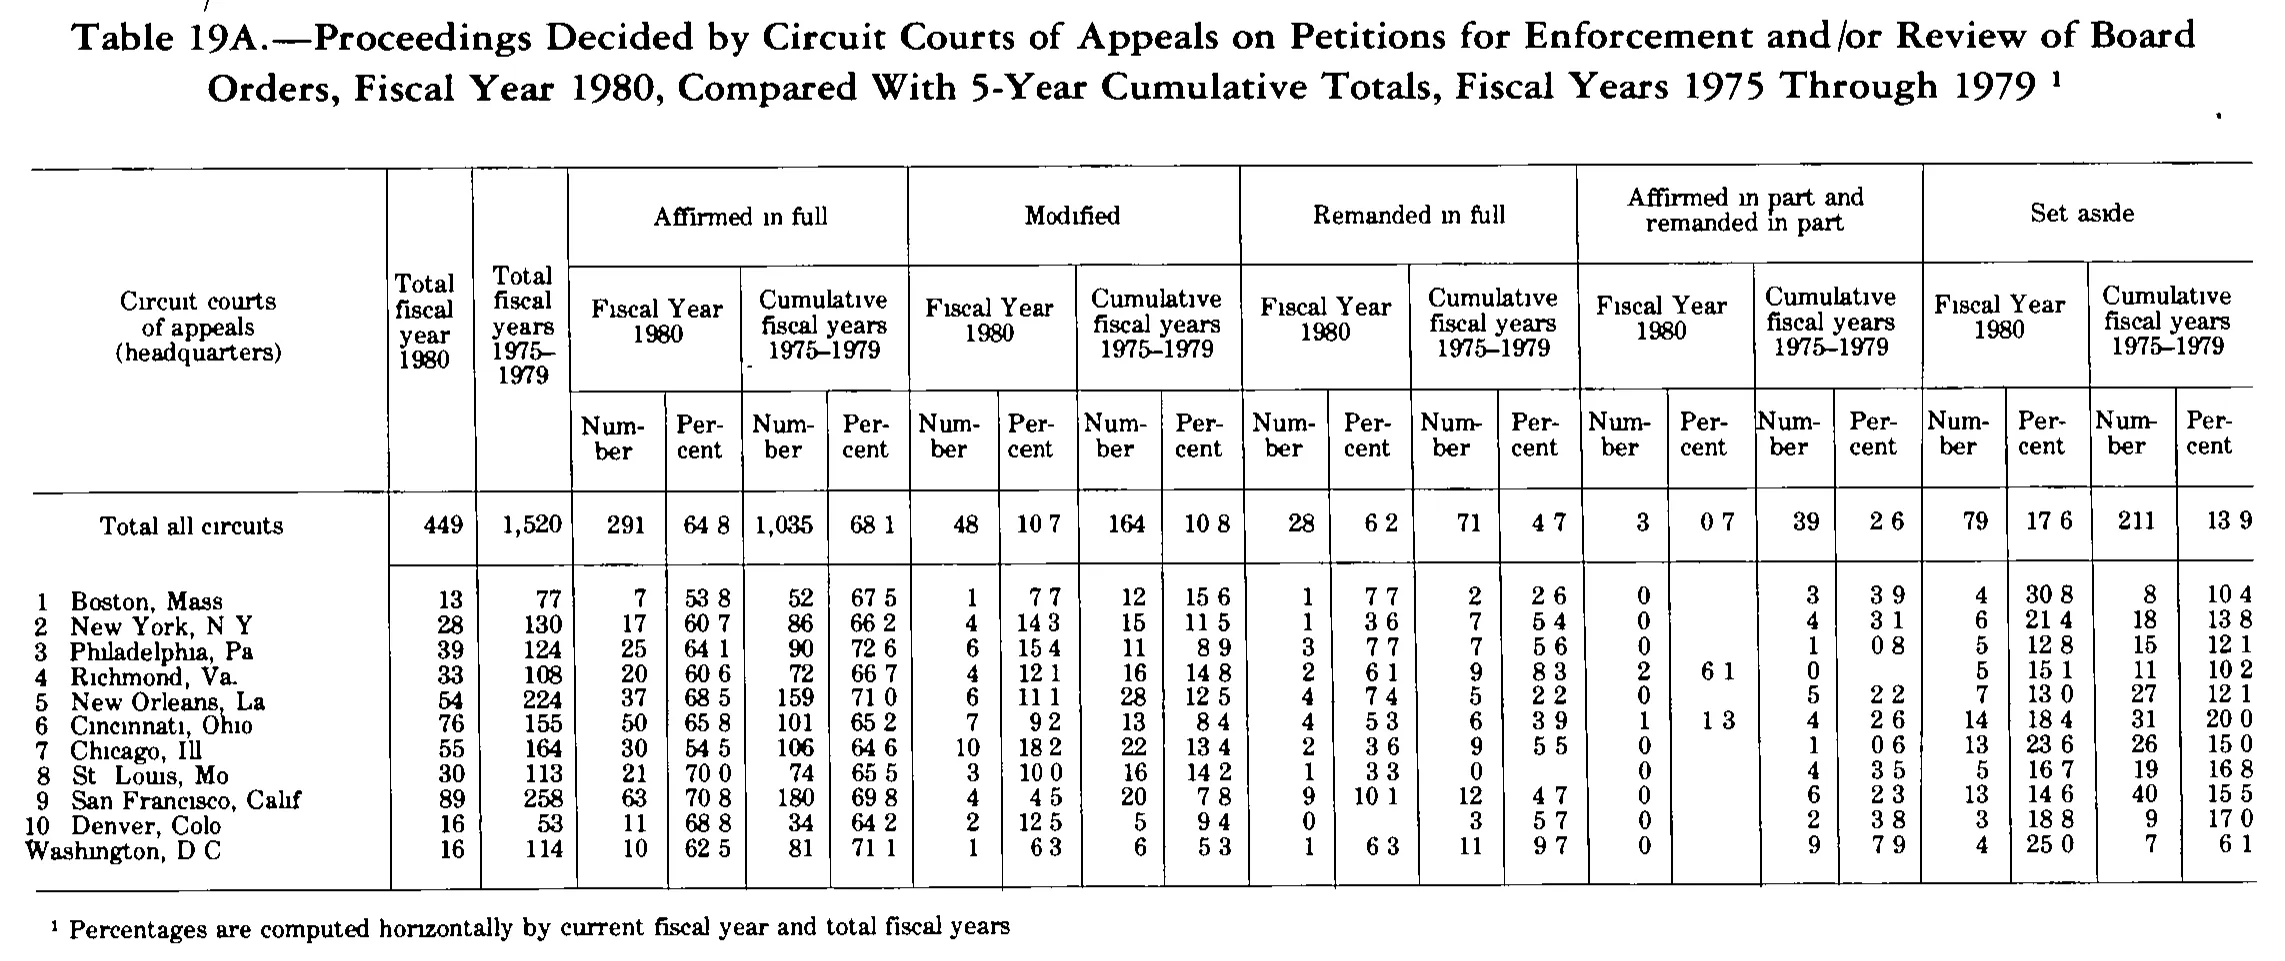
Proceedings Decided by Circuit Courts of Appeals on Petitions for Enforcement and/or Review of Board Orders, Fiscal Year 1980, Compared With 5-Year Cumulative Totals, Fiscal Years 1975 Through 1979
| Circuit courts of appeals (headquarters) | Total fiscal year 1980 | Total fiscal years 1975-1979 | Affirmed in full | Modified | Remanded in full | Affirmed in part and remanded in part | Set aside | |||||||||||||||
|---|---|---|---|---|---|---|---|---|---|---|---|---|---|---|---|---|---|---|---|---|---|---|
| Circuit courts of appeals (headquarters) | Total fiscal year 1980 | Total fiscal years 1975-1979 | Fiscal Year 1980 | Cumulative fiscal years 1975-1979 | Fiscal Year 1980 | Cumulative fiscal years 1975-1979 | Fiscal Year 1980 | Cumulative fiscal years 1975-1979 | Fiscal Year 1980 | Cumulative fiscal years 1975-1979 | Fiscal Year 1980 | Cumulative fiscal years 1975-1979 | ||||||||||
| Circuit courts of appeals (headquarters) | Total fiscal year 1980 | Total fiscal years 1975-1979 | Number | Percent | Number | Percent | Number | Percent | Number | Percent | Number | Percent | Number | Percent | Number | Percent | Number | Percent | Number | Percent | Number | Percent |
| Total all circuits | 449 | 1,520 | 291 | 64.8 | 1,035 | 68.1 | 48 | 10.7 | 164 | 10.8 | 28 | 6.2 | 71 | 4.7 | 3 | 0.7 | 39 | 2.6 | 79 | 17.6 | 211 | 13.9 |
| 1 Boston, Mass. | 13 | 77 | 7 | 53.8 | 52 | 67.5 | 1 | 7.7 | 12 | 15.6 | 1 | 7.7 | 2 | 2.6 | 0 | 3 | 3.9 | 4 | 30.8 | 8 | 10.4 | |
| 2 New York, N.Y. | 28 | 130 | 17 | 60.7 | 86 | 66.2 | 4 | 14.3 | 15 | 11.5 | 1 | 3.6 | 7 | 5.4 | 0 | 4 | 3.1 | 6 | 21.4 | 18 | 13.8 | |
| 3 Philadelphia, Pa. | 39 | 124 | 25 | 64.1 | 90 | 72.6 | 6 | 15.4 | 11 | 8.9 | 3 | 7.7 | 7 | 5.6 | 0 | 1 | 0.8 | 5 | 12.8 | 15 | 12.1 | |
| 4 Richmond, Va. | 33 | 108 | 20 | 60.6 | 72 | 66.7 | 4 | 12.1 | 16 | 14.8 | 2 | 6.1 | 9 | 8.3 | 2 | 6.1 | 0 | 5 | 15.1 | 11 | 10.2 | |
| 5 New Orleans, La. | 54 | 224 | 37 | 68.5 | 159 | 71.0 | 6 | 11.1 | 28 | 12.5 | 4 | 7.4 | 5 | 2.2 | 0 | 5 | 2.2 | 7 | 13.0 | 27 | 12.1 | |
| 6 Cincinnati, Ohio | 76 | 155 | 50 | 65.8 | 101 | 65.2 | 7 | 9.2 | 13 | 8.4 | 4 | 5.3 | 6 | 3.9 | 1 | 1.3 | 4 | 2.6 | 14 | 18.4 | 31 | 20.0 |
| 7 Chicago, Ill. | 55 | 164 | 30 | 54.5 | 106 | 64.6 | 10 | 18.2 | 22 | 13.4 | 2 | 3.6 | 9 | 5.5 | 0 | 1 | 0.6 | 13 | 23.6 | 26 | 15.0 | |
| 8 St. Louis, Mo. | 30 | 113 | 21 | 70.0 | 74 | 65.5 | 3 | 10.0 | 16 | 14.2 | 1 | 3.3 | 0 | 0 | 4 | 3.5 | 5 | 16.7 | 19 | 16.8 | ||
| 9 San Francisco, Calif. | 89 | 258 | 63 | 70.8 | 180 | 69.8 | 4 | 4.5 | 20 | 7.8 | 9 | 10.1 | 12 | 4.7 | 0 | 6 | 2.3 | 13 | 14.6 | 40 | 15.5 | |
| 10 Denver, Colo. | 16 | 53 | 11 | 68.8 | 34 | 64.2 | 2 | 12.5 | 5 | 9.4 | 0 | 3 | 5.7 | 0 | 2 | 3.8 | 3 | 18.8 | 9 | 17.0 | ||
| Washington, D.C. | 16 | 114 | 10 | 62.5 | 81 | 71.1 | 1 | 6.3 | 6 | 5.3 | 1 | 6.3 | 11 | 9.7 | 0 | 9 | 7.9 | 4 | 25.0 | 7 | 6.1 | |
- 1 Percentages are computed horizontally by current fiscal year and total fiscal years
132 of 132 figures sit in a row or column sum that works out.
Reader’s notes
p. 303. 23 columns: stub, two \"Total\" columns, then five outcome groups of four columns each (Fiscal Year 1980 Number/Percent, Cumulative fiscal years 1975-1979 Number/Percent).\n\nDecimal points: this is a 1-bit scan in which periods are largely lost, so every percent value prints as e.g. \"64 8\". I have restored the decimal point (64.8). This is supported throughout: every percent reproduces number/total for its row to one decimal (e.g. 291/449 = 64.8, 1,035/1,520 = 68.1), and values such as \"71 0\", \"20 0\", \"25 0\" are one-decimal figures. No value was computed or altered otherwise. For the same reason I restored the lost periods in the abbreviated row labels (Mass., N.Y., Pa., La., Ill., St., Mo., Calif., Colo., D.C.); only \"Richmond, Va.\" shows its period clearly in the scan. The footnote is transcribed without a closing period because none is visible.\n\nTwo percent cells disagree with the horizontal arithmetic and are transcribed as printed:\n- \"4 Richmond, Va.\", Set aside / Fiscal Year 1980 / Percent: printed 15.1; 5/33 = 15.15, which rounds to 15.2 (the rest of the table rounds rather than truncates).\n- \"7 Chicago, Ill.\", Set aside / Cumulative fiscal years 1975-1979 / Percent: printed 15.0; 26/164 = 15.85, i.e. 15.9. The final digit is a doubtful glyph in this scan (0 vs 9); I transcribed the character as it appears.\n\nWherever a Number cell is 0 the matching Percent cell is left blank on the page, and is \"\" here (Affirmed in part and remanded in part, Fiscal Year 1980, for most circuits; also Remanded in full cumulative for St. Louis, Remanded in full fiscal year 1980 for Denver, and Affirmed in part cumulative for Richmond).\n\nColumn placement in the \"Affirmed in part and remanded in part\" group is confirmed arithmetically: Richmond is the only circuit with a fiscal 1980 entry besides Cincinnati (2 + 1 = the printed total of 3) and is the only circuit with 0 in the cumulative column (the other ten sum to the printed 39). All twelve number columns sum to the printed \"Total all circuits\" line, and each circuit's five outcome counts sum to its own total, for both fiscal 1980 and the cumulative years.\n\nThe last row, the D.C. Circuit, carries no circuit number in the stub; its label is printed flush left.
Source image
Source data: U.S. NLRB Annual Reports (public domain). Reconstruction by NLRB Stats Archive. Read by claude-opus-5 (effort max, prompt extract_v1) from the 300-dpi scan; stitched by page. Updated October 2026.