NLRB Stats Archive › Annual Reports › FY1980 › Distribution of Unfair Labor Practice Situations Received, by Number of Employees in Establishments, Fiscal Year 1980
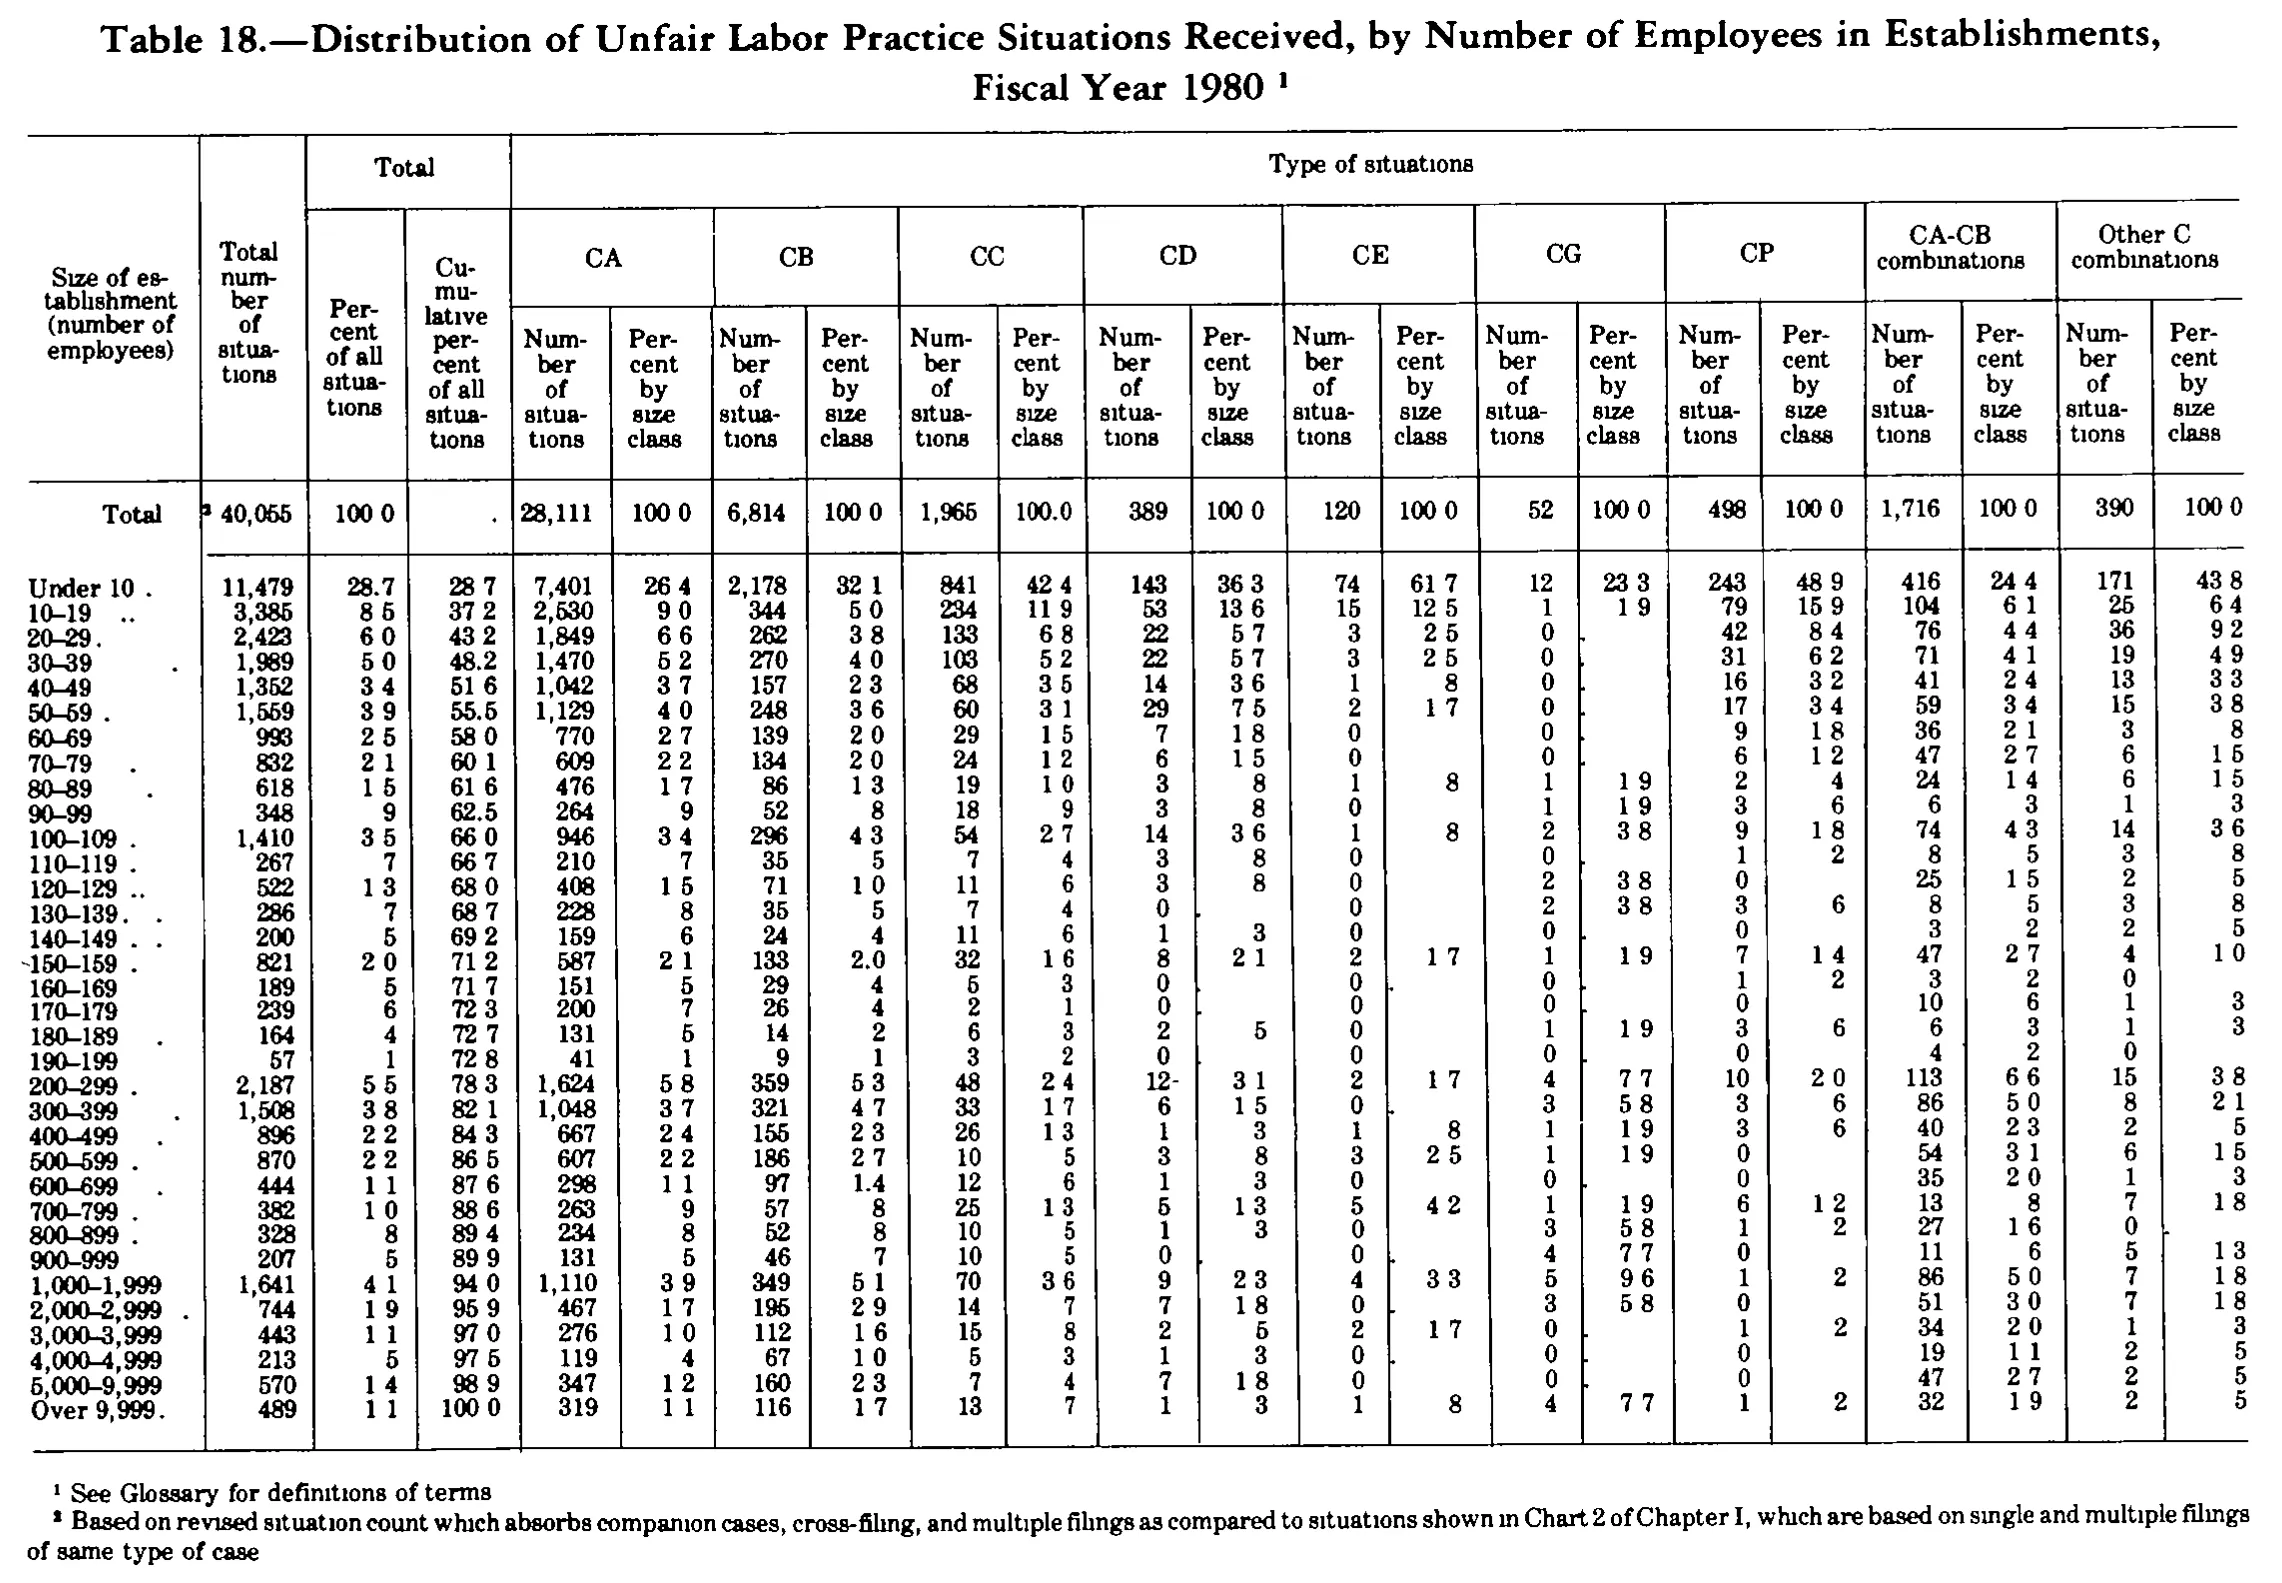
Distribution of Unfair Labor Practice Situations Received, by Number of Employees in Establishments, Fiscal Year 1980
| Size of establishment (number of employees) | Total number of situations | Total | Type of situations | ||||||||||||||||||
|---|---|---|---|---|---|---|---|---|---|---|---|---|---|---|---|---|---|---|---|---|---|
| Size of establishment (number of employees) | Total number of situations | Percent of all situations | Cumulative percent of all situations | CA | CB | CC | CD | CE | CG | CP | CA-CB combinations | Other C combinations | |||||||||
| Size of establishment (number of employees) | Total number of situations | Percent of all situations | Cumulative percent of all situations | Number of situations | Percent by size class | Number of situations | Percent by size class | Number of situations | Percent by size class | Number of situations | Percent by size class | Number of situations | Percent by size class | Number of situations | Percent by size class | Number of situations | Percent by size class | Number of situations | Percent by size class | Number of situations | Percent by size class |
| Total | 40,055 | 100.0 | 28,111 | 100.0 | 6,814 | 100.0 | 1,965 | 100.0 | 389 | 100.0 | 120 | 100.0 | 52 | 100.0 | 498 | 100.0 | 1,716 | 100.0 | 390 | 100.0 | |
| Under 10 | 11,479 | 28.7 | 28.7 | 7,401 | 26.4 | 2,178 | 32.1 | 841 | 42.4 | 143 | 36.3 | 74 | 61.7 | 12 | 23.3 | 243 | 48.9 | 416 | 24.4 | 171 | 43.8 |
| 10-19 | 3,385 | 8.5 | 37.2 | 2,530 | 9.0 | 344 | 5.0 | 234 | 11.9 | 53 | 13.6 | 15 | 12.5 | 1 | 1.9 | 79 | 15.9 | 104 | 6.1 | 25 | 6.4 |
| 20-29 | 2,423 | 6.0 | 43.2 | 1,849 | 6.6 | 262 | 3.8 | 133 | 6.8 | 22 | 5.7 | 3 | 2.5 | 0 | 42 | 8.4 | 76 | 4.4 | 36 | 9.2 | |
| 30-39 | 1,989 | 5.0 | 48.2 | 1,470 | 5.2 | 270 | 4.0 | 103 | 5.2 | 22 | 5.7 | 3 | 2.5 | 0 | 31 | 6.2 | 71 | 4.1 | 19 | 4.9 | |
| 40-49 | 1,352 | 3.4 | 51.6 | 1,042 | 3.7 | 157 | 2.3 | 68 | 3.5 | 14 | 3.6 | 1 | .8 | 0 | 16 | 3.2 | 41 | 2.4 | 13 | 3.3 | |
| 50-59 | 1,559 | 3.9 | 55.5 | 1,129 | 4.0 | 248 | 3.6 | 60 | 3.1 | 29 | 7.5 | 2 | 1.7 | 0 | 17 | 3.4 | 59 | 3.4 | 15 | 3.8 | |
| 60-69 | 993 | 2.5 | 58.0 | 770 | 2.7 | 139 | 2.0 | 29 | 1.5 | 7 | 1.8 | 0 | 0 | 9 | 1.8 | 36 | 2.1 | 3 | .8 | ||
| 70-79 | 832 | 2.1 | 60.1 | 609 | 2.2 | 134 | 2.0 | 24 | 1.2 | 6 | 1.5 | 0 | 0 | 6 | 1.2 | 47 | 2.7 | 6 | 1.5 | ||
| 80-89 | 618 | 1.5 | 61.6 | 476 | 1.7 | 86 | 1.3 | 19 | 1.0 | 3 | .8 | 1 | .8 | 1 | 1.9 | 2 | .4 | 24 | 1.4 | 6 | 1.5 |
| 90-99 | 348 | .9 | 62.5 | 264 | .9 | 52 | .8 | 18 | .9 | 3 | .8 | 0 | 1 | 1.9 | 3 | .6 | 6 | .3 | 1 | .3 | |
| 100-109 | 1,410 | 3.5 | 66.0 | 946 | 3.4 | 296 | 4.3 | 54 | 2.7 | 14 | 3.6 | 1 | .8 | 2 | 3.8 | 9 | 1.8 | 74 | 4.3 | 14 | 3.6 |
| 110-119 | 267 | .7 | 66.7 | 210 | .7 | 35 | .5 | 7 | .4 | 3 | .8 | 0 | 0 | 1 | .2 | 8 | .5 | 3 | .8 | ||
| 120-129 | 522 | 1.3 | 68.0 | 408 | 1.5 | 71 | 1.0 | 11 | .6 | 3 | .8 | 0 | 2 | 3.8 | 0 | 25 | 1.5 | 2 | .5 | ||
| 130-139 | 286 | .7 | 68.7 | 228 | .8 | 35 | .5 | 7 | .4 | 0 | 0 | 2 | 3.8 | 3 | .6 | 8 | .5 | 3 | .8 | ||
| 140-149 | 200 | .5 | 69.2 | 159 | .6 | 24 | .4 | 11 | .6 | 1 | .3 | 0 | 0 | 0 | 3 | .2 | 2 | .5 | |||
| 150-159 | 821 | 2.0 | 71.2 | 587 | 2.1 | 133 | 2.0 | 32 | 1.6 | 8 | 2.1 | 2 | 1.7 | 1 | 1.9 | 7 | 1.4 | 47 | 2.7 | 4 | 1.0 |
| 160-169 | 189 | .5 | 71.7 | 151 | .5 | 29 | .4 | 5 | .3 | 0 | 0 | 0 | 1 | .2 | 3 | .2 | 0 | ||||
| 170-179 | 239 | .6 | 72.3 | 200 | .7 | 26 | .4 | 2 | .1 | 0 | 0 | 0 | 0 | 10 | .6 | 1 | .3 | ||||
| 180-189 | 164 | .4 | 72.7 | 131 | .5 | 14 | .2 | 6 | .3 | 2 | .5 | 0 | 1 | 1.9 | 3 | .6 | 6 | .3 | 1 | .3 | |
| 190-199 | 57 | .1 | 72.8 | 41 | .1 | 9 | .1 | 3 | .2 | 0 | 0 | 0 | 0 | 4 | .2 | 0 | |||||
| 200-299 | 2,187 | 5.5 | 78.3 | 1,624 | 5.8 | 359 | 5.3 | 48 | 2.4 | 12 | 3.1 | 2 | 1.7 | 4 | 7.7 | 10 | 2.0 | 113 | 6.6 | 15 | 3.8 |
| 300-399 | 1,508 | 3.8 | 82.1 | 1,048 | 3.7 | 321 | 4.7 | 33 | 1.7 | 6 | 1.5 | 0 | 3 | 5.8 | 3 | .6 | 86 | 5.0 | 8 | 2.1 | |
| 400-499 | 896 | 2.2 | 84.3 | 667 | 2.4 | 155 | 2.3 | 26 | 1.3 | 1 | .3 | 1 | .8 | 1 | 1.9 | 3 | .6 | 40 | 2.3 | 2 | .5 |
| 500-599 | 870 | 2.2 | 86.5 | 607 | 2.2 | 186 | 2.7 | 10 | .5 | 3 | .8 | 3 | 2.5 | 1 | 1.9 | 0 | 54 | 3.1 | 6 | 1.5 | |
| 600-699 | 444 | 1.1 | 87.6 | 298 | 1.1 | 97 | 1.4 | 12 | .6 | 1 | .3 | 0 | 0 | 0 | 35 | 2.0 | 1 | .3 | |||
| 700-799 | 382 | 1.0 | 88.6 | 263 | .9 | 57 | .8 | 25 | 1.3 | 5 | 1.3 | 5 | 4.2 | 1 | 1.9 | 6 | 1.2 | 13 | .8 | 7 | 1.8 |
| 800-899 | 328 | .8 | 89.4 | 234 | .8 | 52 | .8 | 10 | .5 | 1 | .3 | 0 | 3 | 5.8 | 1 | .2 | 27 | 1.6 | 0 | ||
| 900-999 | 207 | .5 | 89.9 | 131 | .5 | 46 | .7 | 10 | .5 | 0 | 0 | 4 | 7.7 | 0 | 11 | .6 | 5 | 1.3 | |||
| 1,000-1,999 | 1,641 | 4.1 | 94.0 | 1,110 | 3.9 | 349 | 5.1 | 70 | 3.6 | 9 | 2.3 | 4 | 3.3 | 5 | 9.6 | 1 | .2 | 86 | 5.0 | 7 | 1.8 |
| 2,000-2,999 | 744 | 1.9 | 95.9 | 467 | 1.7 | 195 | 2.9 | 14 | .7 | 7 | 1.8 | 0 | 3 | 5.8 | 0 | 51 | 3.0 | 7 | 1.8 | ||
| 3,000-3,999 | 443 | 1.1 | 97.0 | 276 | 1.0 | 112 | 1.6 | 15 | .8 | 2 | .5 | 2 | 1.7 | 0 | 1 | .2 | 34 | 2.0 | 1 | .3 | |
| 4,000-4,999 | 213 | .5 | 97.5 | 119 | .4 | 67 | 1.0 | 5 | .3 | 1 | .3 | 0 | 0 | 0 | 19 | 1.1 | 2 | .5 | |||
| 5,000-9,999 | 570 | 1.4 | 98.9 | 347 | 1.2 | 160 | 2.3 | 7 | .4 | 7 | 1.8 | 0 | 0 | 0 | 47 | 2.7 | 2 | .5 | |||
| Over 9,999 | 489 | 1.1 | 100.0 | 319 | 1.1 | 116 | 1.7 | 13 | .7 | 1 | .3 | 1 | .8 | 4 | 7.7 | 1 | .2 | 32 | 1.9 | 2 | .5 |
- 1 See Glossary for definitions of terms
- 2 Based on revised situation count which absorbs companion cases, cross-filing, and multiple filings as compared to situations shown in Chart 2 of Chapter I, which are based on single and multiple filings of same type of case
299 of 299 figures sit in a row or column sum that works out.
Reader’s notes
p. 301. 22 columns: stub, "Total number of situations" (a tall heading standing outside the "Total" span), then "Total" over the two percent columns, then "Type of situations" over nine type groups of two columns each. DECIMAL POINTS: this is a 1-bit scan in which the periods inside the percent figures mostly failed to print; they survive in only a few cells (28.7, 48.2, 62.5, 2.0 at 150-159/CB, 1.4 at 600-699/CB, 100.0 at CC total). Every percent cell is a one-decimal figure and is printed in the body of the page as e.g. "28 7", "100 0". I have written the decimal point back in. Percentages below 1 are set without a leading zero, so a lone digit such as the "9" at 90-99 in "Percent of all situations" is ".9", not 9; I have transcribed those as ".9", ".8", ".3" etc. If your downstream convention wants the literal glyphs instead, these cells are the ones to revisit. VERIFICATION: every one of the 34 body rows sums across its nine type columns to the printed "Total number of situations", and each of the nine type-count columns sums to its printed total (28,111 / 6,814 / 1,965 / 389 / 120 / 52 / 498 / 1,716 / 390); the stub-column counts sum to 40,055. The "percent by size class" columns each sum to 100.0, with the "Under 10" cell carrying the rounding residual (e.g. CA "Under 10" is printed 26.4 although 7,401/28,111 = 26.3). Those are printed as shown, not corrected. Likewise "Over 9,999" percent of all situations is printed 1.1 (computed 1.2), which is what makes the cumulative column close at exactly 100.0. DOUBTFUL CELLS: - "Other C combinations / Number of situations" at row 800-899: the glyph is smudged and could be read as 7, but 0 is the only value consistent with both the row total (234+52+10+1+0+3+1+27 = 328) and the column total of 390, and the adjacent percent cell is blank as it is for every other zero count. Transcribed 0. - "CD / Number of situations" at row 200-299: a short stray dash follows the figure on the page ("12-"). The value is 12 (row and column sums agree); the dash is a printing artifact and has been dropped. - "CD / Percent by size class" at row 130-139 carries an isolated speck; the count there is 0 and the cell is treated as blank. - Cumulative percent in the "Total" row holds only a leader dot and is transcribed "". - The "Total" row's figure 40,055 is preceded by a raised 2; recorded as 40,055^2. - Range dashes in the stub are rendered as plain hyphens; at this scan resolution a hyphen cannot be told from an en dash. - The scan renders many dotless "i" shapes (e.g. "sıtuatıons", "filıngs"); headings and footnotes are transcribed with ordinary "i".
Source image
Source data: U.S. NLRB Annual Reports (public domain). Reconstruction by NLRB Stats Archive. Read by claude-opus-5 (effort max, prompt extract_v1) from the 300-dpi scan; stitched by page. Updated October 2026.