NLRB Stats Archive › Annual Reports › FY1980 › Size of Units in Representation Cases Closed, Fiscal Year 1980
Size of Units in Representation Cases Closed, Fiscal Year 1980
Stitched from pp. 299–300; a later page prints different headings, kept as rows.
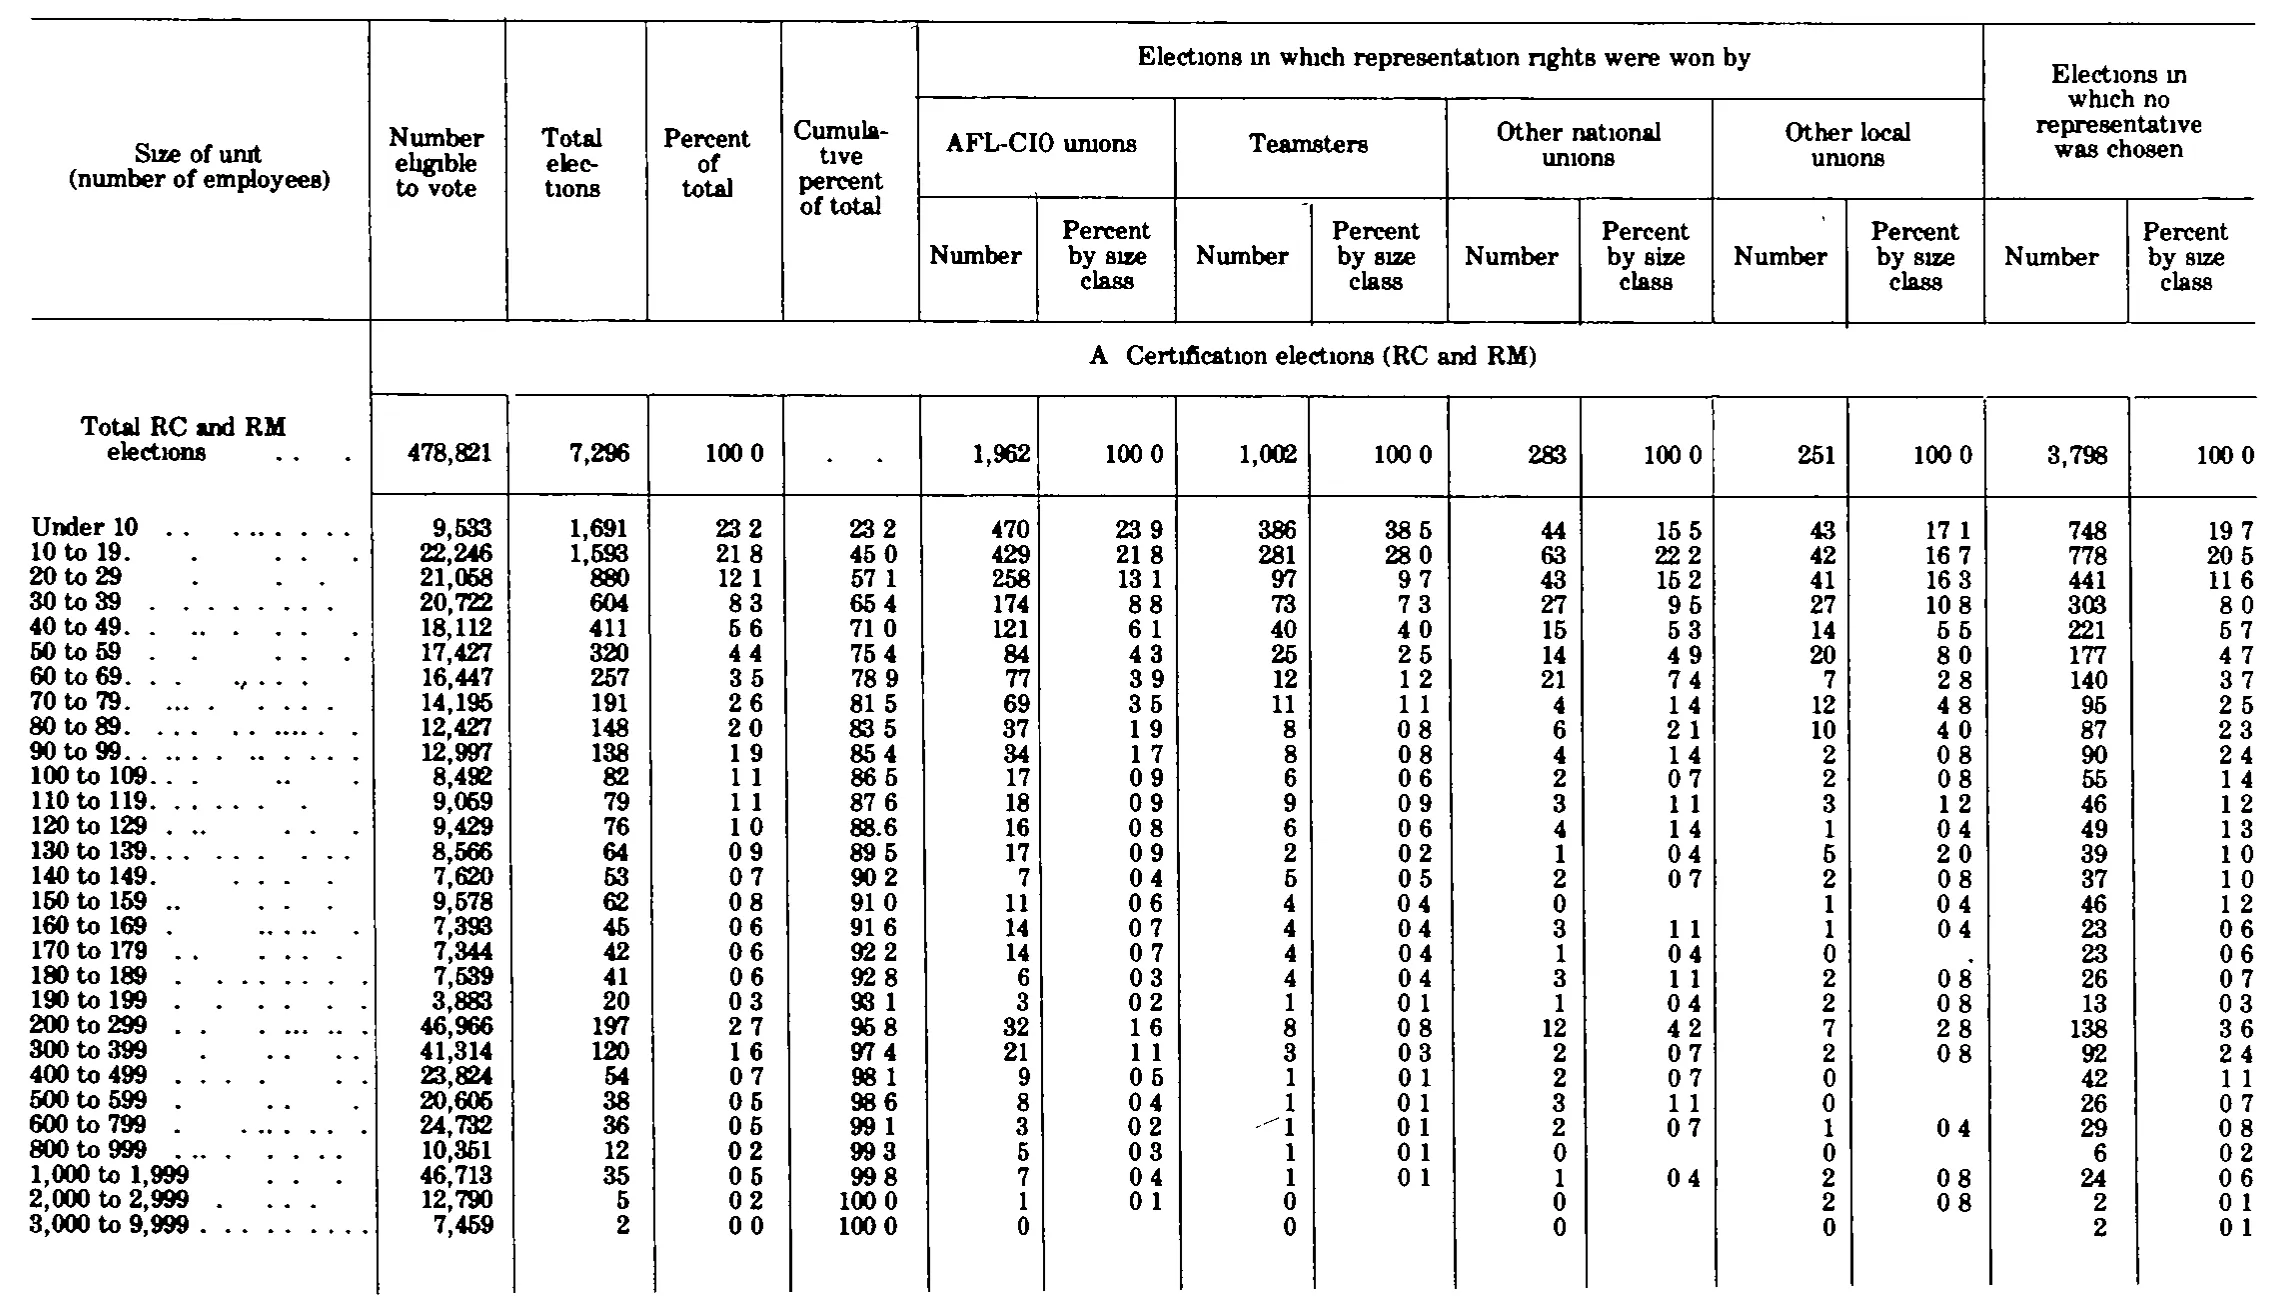
| Size of unit (number of employees) | Number eligible to vote | Total elections | Percent of total | Cumulative percent of total | Elections in which representation rights were won by | Elections in which no representative was chosen | ||||||||
|---|---|---|---|---|---|---|---|---|---|---|---|---|---|---|
| Size of unit (number of employees) | Number eligible to vote | Total elections | Percent of total | Cumulative percent of total | AFL-CIO unions | Teamsters | Other national unions | Other local unions | Elections in which no representative was chosen | |||||
| Size of unit (number of employees) | Number eligible to vote | Total elections | Percent of total | Cumulative percent of total | Number | Percent by size class | Number | Percent by size class | Number | Percent by size class | Number | Percent by size class | Number | Percent by size class |
| A. Certification elections (RC and RM) | ||||||||||||||
| Total RC and RM elections | 478,821 | 7,296 | 100.0 | 1,962 | 100.0 | 1,002 | 100.0 | 283 | 100.0 | 251 | 100.0 | 3,798 | 100.0 | |
| Under 10 | 9,533 | 1,691 | 23.2 | 23.2 | 470 | 23.9 | 386 | 38.5 | 44 | 15.5 | 43 | 17.1 | 748 | 19.7 |
| 10 to 19 | 22,246 | 1,593 | 21.8 | 45.0 | 429 | 21.8 | 281 | 28.0 | 63 | 22.2 | 42 | 16.7 | 778 | 20.5 |
| 20 to 29 | 21,058 | 880 | 12.1 | 57.1 | 258 | 13.1 | 97 | 9.7 | 43 | 15.2 | 41 | 16.3 | 441 | 11.6 |
| 30 to 39 | 20,722 | 604 | 8.3 | 65.4 | 174 | 8.8 | 73 | 7.3 | 27 | 9.5 | 27 | 10.8 | 303 | 8.0 |
| 40 to 49 | 18,112 | 411 | 5.6 | 71.0 | 121 | 6.1 | 40 | 4.0 | 15 | 5.3 | 14 | 5.5 | 221 | 5.7 |
| 50 to 59 | 17,427 | 320 | 4.4 | 75.4 | 84 | 4.3 | 25 | 2.5 | 14 | 4.9 | 20 | 8.0 | 177 | 4.7 |
| 60 to 69 | 16,447 | 257 | 3.5 | 78.9 | 77 | 3.9 | 12 | 1.2 | 21 | 7.4 | 7 | 2.8 | 140 | 3.7 |
| 70 to 79 | 14,195 | 191 | 2.6 | 81.5 | 69 | 3.5 | 11 | 1.1 | 4 | 1.4 | 12 | 4.8 | 95 | 2.5 |
| 80 to 89 | 12,427 | 148 | 2.0 | 83.5 | 37 | 1.9 | 8 | 0.8 | 6 | 2.1 | 10 | 4.0 | 87 | 2.3 |
| 90 to 99 | 12,997 | 138 | 1.9 | 85.4 | 34 | 1.7 | 8 | 0.8 | 4 | 1.4 | 2 | 0.8 | 90 | 2.4 |
| 100 to 109 | 8,492 | 82 | 1.1 | 86.5 | 17 | 0.9 | 6 | 0.6 | 2 | 0.7 | 2 | 0.8 | 55 | 1.4 |
| 110 to 119 | 9,059 | 79 | 1.1 | 87.6 | 18 | 0.9 | 9 | 0.9 | 3 | 1.1 | 3 | 1.2 | 46 | 1.2 |
| 120 to 129 | 9,429 | 76 | 1.0 | 88.6 | 16 | 0.8 | 6 | 0.6 | 4 | 1.4 | 1 | 0.4 | 49 | 1.3 |
| 130 to 139 | 8,566 | 64 | 0.9 | 89.5 | 17 | 0.9 | 2 | 0.2 | 1 | 0.4 | 5 | 2.0 | 39 | 1.0 |
| 140 to 149 | 7,620 | 53 | 0.7 | 90.2 | 7 | 0.4 | 5 | 0.5 | 2 | 0.7 | 2 | 0.8 | 37 | 1.0 |
| 150 to 159 | 9,578 | 62 | 0.8 | 91.0 | 11 | 0.6 | 4 | 0.4 | 0 | 1 | 0.4 | 46 | 1.2 | |
| 160 to 169 | 7,393 | 45 | 0.6 | 91.6 | 14 | 0.7 | 4 | 0.4 | 3 | 1.1 | 1 | 0.4 | 23 | 0.6 |
| 170 to 179 | 7,344 | 42 | 0.6 | 92.2 | 14 | 0.7 | 4 | 0.4 | 1 | 0.4 | 0 | 23 | 0.6 | |
| 180 to 189 | 7,539 | 41 | 0.6 | 92.8 | 6 | 0.3 | 4 | 0.4 | 3 | 1.1 | 2 | 0.8 | 26 | 0.7 |
| 190 to 199 | 3,883 | 20 | 0.3 | 93.1 | 3 | 0.2 | 1 | 0.1 | 1 | 0.4 | 2 | 0.8 | 13 | 0.3 |
| 200 to 299 | 46,966 | 197 | 2.7 | 95.8 | 32 | 1.6 | 8 | 0.8 | 12 | 4.2 | 7 | 2.8 | 138 | 3.6 |
| 300 to 399 | 41,314 | 120 | 1.6 | 97.4 | 21 | 1.1 | 3 | 0.3 | 2 | 0.7 | 2 | 0.8 | 92 | 2.4 |
| 400 to 499 | 23,824 | 54 | 0.7 | 98.1 | 9 | 0.5 | 1 | 0.1 | 2 | 0.7 | 0 | 42 | 1.1 | |
| 500 to 599 | 20,605 | 38 | 0.5 | 98.6 | 8 | 0.4 | 1 | 0.1 | 3 | 1.1 | 0 | 26 | 0.7 | |
| 600 to 799 | 24,732 | 36 | 0.5 | 99.1 | 3 | 0.2 | 1 | 0.1 | 2 | 0.7 | 1 | 0.4 | 29 | 0.8 |
| 800 to 999 | 10,351 | 12 | 0.2 | 99.3 | 5 | 0.3 | 1 | 0.1 | 0 | 0 | 6 | 0.2 | ||
| 1,000 to 1,999 | 46,713 | 35 | 0.5 | 99.8 | 7 | 0.4 | 1 | 0.1 | 1 | 0.4 | 2 | 0.8 | 24 | 0.6 |
| 2,000 to 2,999 | 12,790 | 5 | 0.2 | 100.0 | 1 | 0.1 | 0 | 0 | 2 | 0.8 | 2 | 0.1 | ||
| 3,000 to 9,999 | 7,459 | 2 | 0.0 | 100.0 | 0 | 0 | 0 | 0 | 2 | 0.1 | ||||
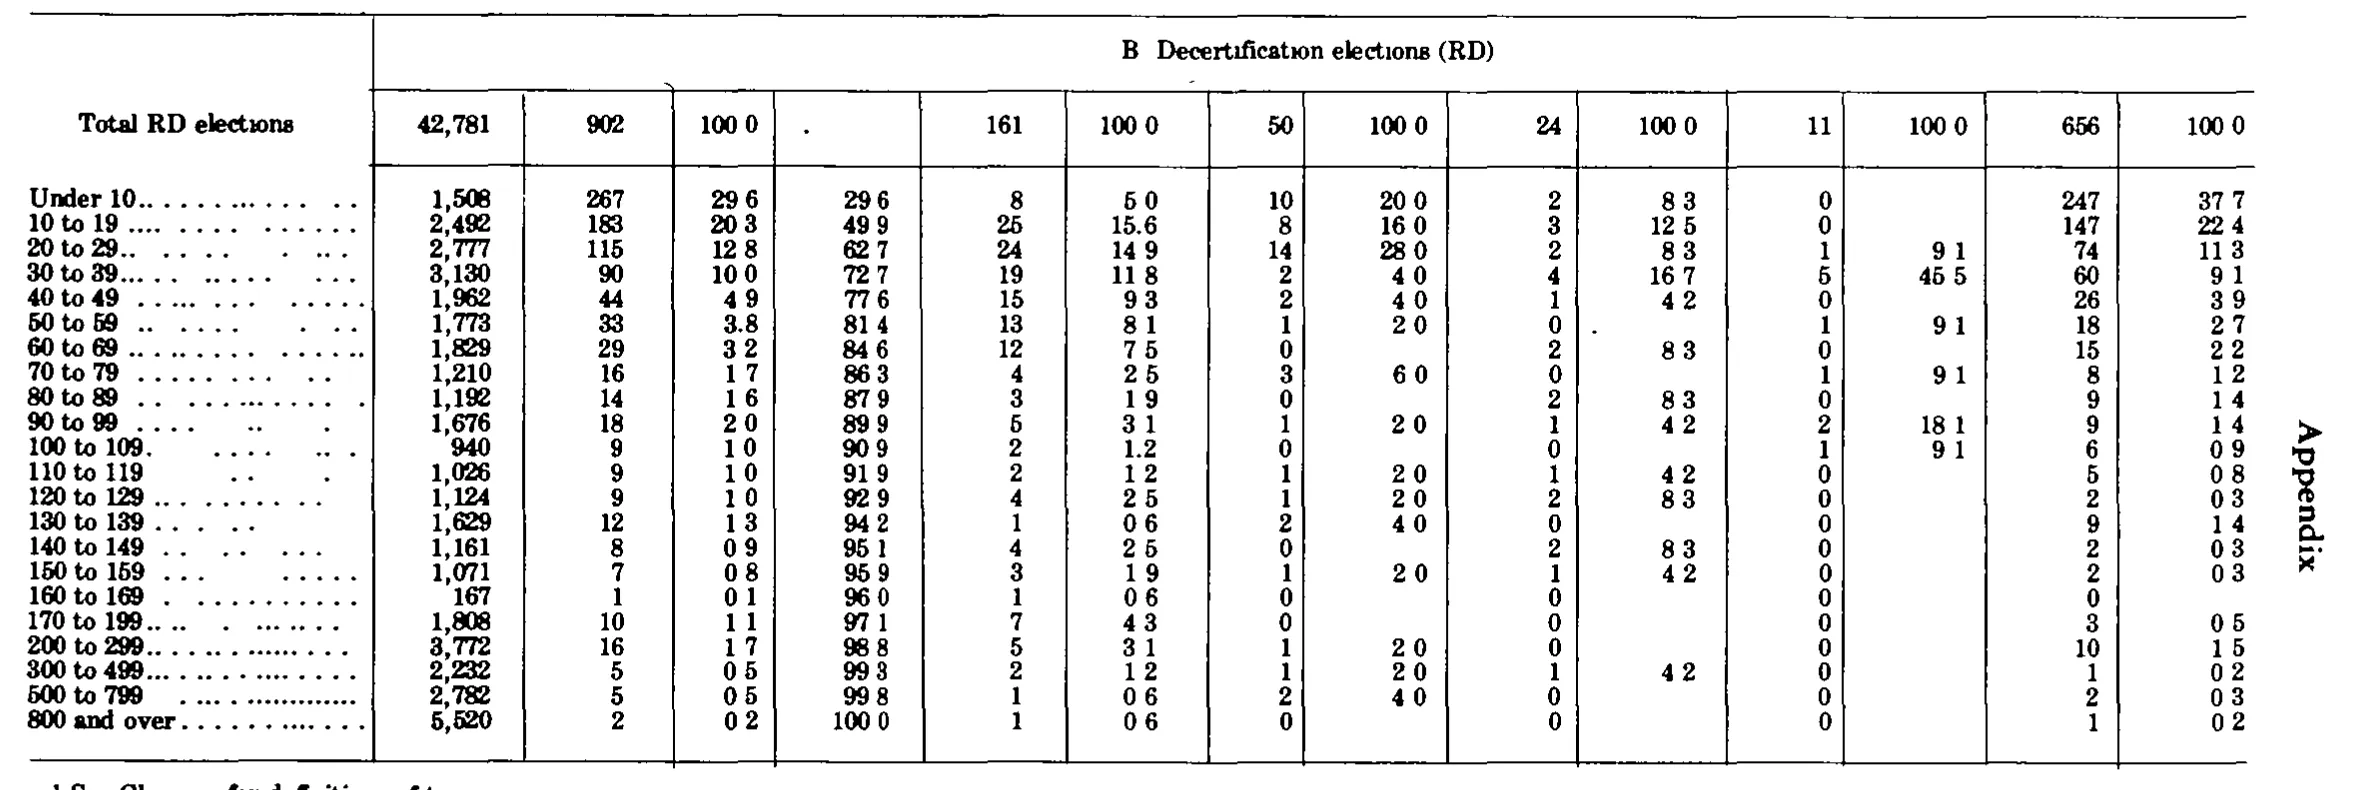
| B. Decertification elections (RD) | B. Decertification elections (RD) | B. Decertification elections (RD) | B. Decertification elections (RD) | B. Decertification elections (RD) | B. Decertification elections (RD) | B. Decertification elections (RD) | B. Decertification elections (RD) | B. Decertification elections (RD) | B. Decertification elections (RD) | B. Decertification elections (RD) | B. Decertification elections (RD) | B. Decertification elections (RD) | B. Decertification elections (RD) | |
| Total RD elections | 42,781 | 902 | 100.0 | 161 | 100.0 | 50 | 100.0 | 24 | 100.0 | 11 | 100.0 | 656 | 100.0 | |
| Under 10 | 1,508 | 267 | 29.6 | 29.6 | 8 | 5.0 | 10 | 20.0 | 2 | 8.3 | 0 | 247 | 37.7 | |
| 10 to 19 | 2,492 | 183 | 20.3 | 49.9 | 25 | 15.6 | 8 | 16.0 | 3 | 12.5 | 0 | 147 | 22.4 | |
| 20 to 29 | 2,777 | 115 | 12.8 | 62.7 | 24 | 14.9 | 14 | 28.0 | 2 | 8.3 | 1 | 9.1 | 74 | 11.3 |
| 30 to 39 | 3,130 | 90 | 10.0 | 72.7 | 19 | 11.8 | 2 | 4.0 | 4 | 16.7 | 5 | 45.5 | 60 | 9.1 |
| 40 to 49 | 1,962 | 44 | 4.9 | 77.6 | 15 | 9.3 | 2 | 4.0 | 1 | 4.2 | 0 | 26 | 3.9 | |
| 50 to 59 | 1,773 | 33 | 3.8 | 81.4 | 13 | 8.1 | 1 | 2.0 | 0 | 1 | 9.1 | 18 | 2.7 | |
| 60 to 69 | 1,829 | 29 | 3.2 | 84.6 | 12 | 7.5 | 0 | 2 | 8.3 | 0 | 15 | 2.2 | ||
| 70 to 79 | 1,210 | 16 | 1.7 | 86.3 | 4 | 2.5 | 3 | 6.0 | 0 | 1 | 9.1 | 8 | 1.2 | |
| 80 to 89 | 1,192 | 14 | 1.6 | 87.9 | 3 | 1.9 | 0 | 2 | 8.3 | 0 | 9 | 1.4 | ||
| 90 to 99 | 1,676 | 18 | 2.0 | 89.9 | 5 | 3.1 | 1 | 2.0 | 1 | 4.2 | 2 | 18.1 | 9 | 1.4 |
| 100 to 109 | 940 | 9 | 1.0 | 90.9 | 2 | 1.2 | 0 | 0 | 1 | 9.1 | 6 | 0.9 | ||
| 110 to 119 | 1,026 | 9 | 1.0 | 91.9 | 2 | 1.2 | 1 | 2.0 | 1 | 4.2 | 0 | 5 | 0.8 | |
| 120 to 129 | 1,124 | 9 | 1.0 | 92.9 | 4 | 2.5 | 1 | 2.0 | 2 | 8.3 | 0 | 2 | 0.3 | |
| 130 to 139 | 1,629 | 12 | 1.3 | 94.2 | 1 | 0.6 | 2 | 4.0 | 0 | 0 | 9 | 1.4 | ||
| 140 to 149 | 1,161 | 8 | 0.9 | 95.1 | 4 | 2.5 | 0 | 2 | 8.3 | 0 | 2 | 0.3 | ||
| 150 to 159 | 1,071 | 7 | 0.8 | 95.9 | 3 | 1.9 | 1 | 2.0 | 1 | 4.2 | 0 | 2 | 0.3 | |
| 160 to 169 | 167 | 1 | 0.1 | 96.0 | 1 | 0.6 | 0 | 0 | 0 | 0 | ||||
| 170 to 199 | 1,808 | 10 | 1.1 | 97.1 | 7 | 4.3 | 0 | 0 | 0 | 3 | 0.5 | |||
| 200 to 299 | 3,772 | 16 | 1.7 | 98.8 | 5 | 3.1 | 1 | 2.0 | 0 | 0 | 10 | 1.5 | ||
| 300 to 499 | 2,232 | 5 | 0.5 | 99.3 | 2 | 1.2 | 1 | 2.0 | 1 | 4.2 | 0 | 1 | 0.2 | |
| 500 to 799 | 2,782 | 5 | 0.5 | 99.8 | 1 | 0.6 | 2 | 4.0 | 0 | 0 | 2 | 0.3 | ||
| 800 and over | 5,520 | 2 | 0.2 | 100.0 | 1 | 0.6 | 0 | 0 | 0 | 1 | 0.2 | |||
- 1 See Glossary for definitions of terms.
326 of 326 figures sit in a row or column sum that works out.
Reader’s notes
p. 299. 15 columns: stub + 4 summary columns + four two-column union groups under "Elections in which representation rights were won by" + a two-column "Elections in which no representative was chosen" group. Decimal points: the scan reproduces almost all decimal points as faint gaps, so the percent columns read like "23 2", "100 0", "0 8". These are one-decimal percentages (a few, e.g. 88.6 in the cumulative column, still show the point clearly, and the cumulative series 23.2, 45.0, 57.1 ... 100.0 confirms the reading), so they are transcribed with the decimal point restored. The same loss affects the period after "A" in the section line "A. Certification elections (RC and RM)". Doubtful cell: "2,000 to 2,999", column "Percent of total" — read as 0.2, but 0.1 is possible (the glyph is small and the scan is degraded). Note that 5 of 7,296 elections is 0.07 percent, which would round to 0.1; however 0.1 would make the cumulative column run 99.8 -> 99.9 rather than the printed 100.0, so the printed figure is internally inconsistent either way. Transcribed as read, not corrected. Blank percent cells: where a union group has 0 elections in a size class the "Percent by size class" cell is blank (rows "150 to 159", "170 to 179", "400 to 499", "500 to 599", "800 to 999", "2,000 to 2,999", "3,000 to 9,999"); these are rendered as "". The "Cumulative percent of total" cell on the "Total RC and RM elections" row holds only leader dots and is likewise "". A few stray specks appear in the scan (a dot above the "Percent by size class" cell of "Other local unions" in the header, and one in the "no representative was chosen / Number" column near the "170 to 179" row); they are printing noise, not digits. The crop shows only panel A of the table; the table caption and any panel B (and therefore any footnotes printed beneath the whole table) fall outside this crop.
p. 300. COLUMN STRUCTURE: 15 columns (stub + 14 data). Only the panel heading "B. Decertification elections (RD)", spanning all 14 data columns, is printed on this crop; the individual column headings sit above the crop / on the facing page, so header_rows has a single level and the stub has no printed heading. Arithmetic identifies the columns: col 1 = employees eligible to vote (rows sum exactly to the printed 42,781), col 2 = number of elections (sums exactly to 902), col 3 = percent, col 4 = cumulative percent (equals the running sum of col 3 at every row), and cols 5-14 are five number/percent pairs whose counts 161+50+24+11+656 = 902. Every percent column (3, 6, 8, 10, 12, 14) sums to exactly 100.0. DECIMAL POINTS: the 1-bit scan drops most periods, so percentages appear as "100 0", "29 6", "0 2" with a gap where the decimal point is set. A few survive legibly ("15.6" at 10 to 19 / col 6, "3.8" at 50 to 59 / col 3, "1.2" at 100 to 109 / col 6), and the one-decimal reading is confirmed by every percent column summing to exactly 100.0 and by the cumulative column tracking the percent column. Decimal points are therefore restored throughout. The same artifact removes the period after the "B" in the panel heading, written here as "B.". BLANK / STRAY CELLS: in the "Total RD elections" row the cumulative-percent column (col 4) carries only a small stray speck, transcribed as "". Similar specks sit in col 10 at "50 to 59" and "60 to 69" (both rows with a 0 count in col 9) and are likewise left blank. All other blanks are genuine: the percent cell is left empty wherever its paired count is 0. DOUBTFUL CELLS: col 12 at "90 to 99" reads 18.1, though 2/11 would round to 18.2; the digit after the gap is faint, but 18.1 makes that column total exactly 100.0, so it is transcribed as read. Col 3 at "50 to 59" reads 3.8 although 33/902 is about 3.7; the printed cumulative 81.4 is consistent with 3.8, so it stands as printed. OTHER: the row sequence jumps from "160 to 169" to "170 to 199" with no 180s or 190s lines — as printed. The footnote line is sliced by the bottom edge of the crop (only the upper half of the letterforms is inside the image); it is read as the standard "1 See Glossary for definitions of terms." The vertical "Appendix" running head at the right edge is excluded.
Source image
Source data: U.S. NLRB Annual Reports (public domain). Reconstruction by NLRB Stats Archive. Read by claude-opus-5 (effort max, prompt extract_v1) from the 300-dpi scan; stitched by page. Updated October 2026.