NLRB Stats Archive › Annual Reports › FY1980 › Industrial Distribution of Representation Elections Held in Cases Closed, Fiscal Year 1980
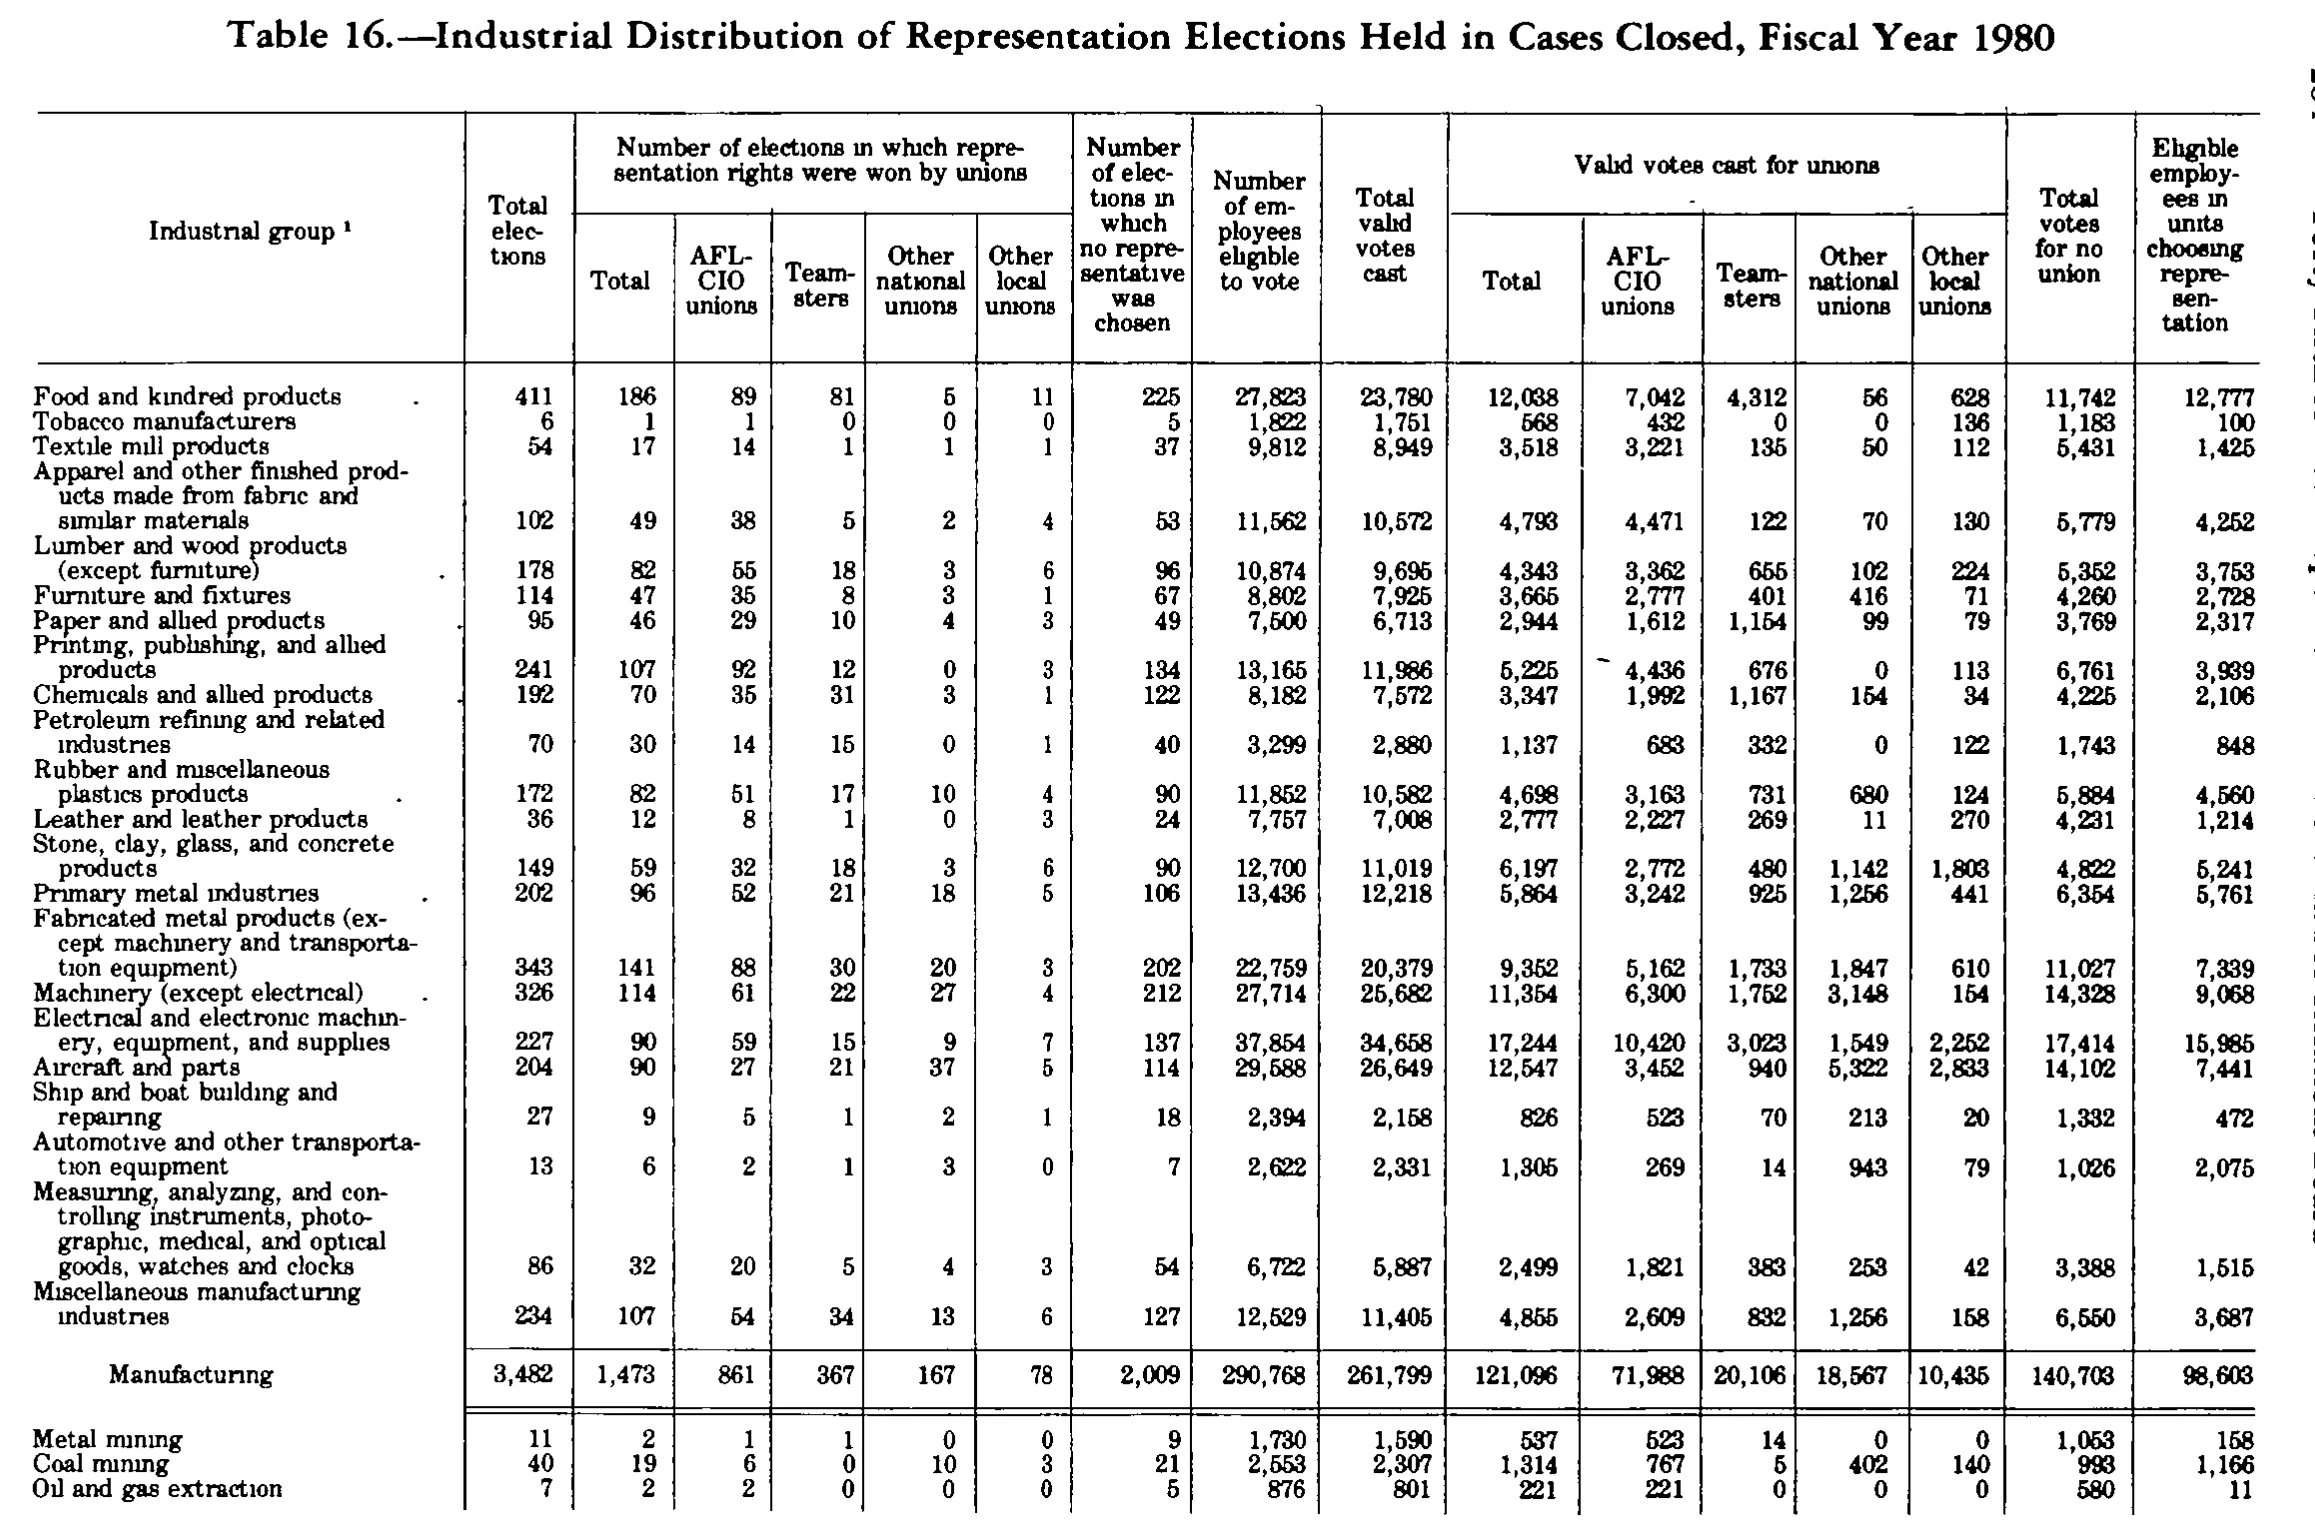
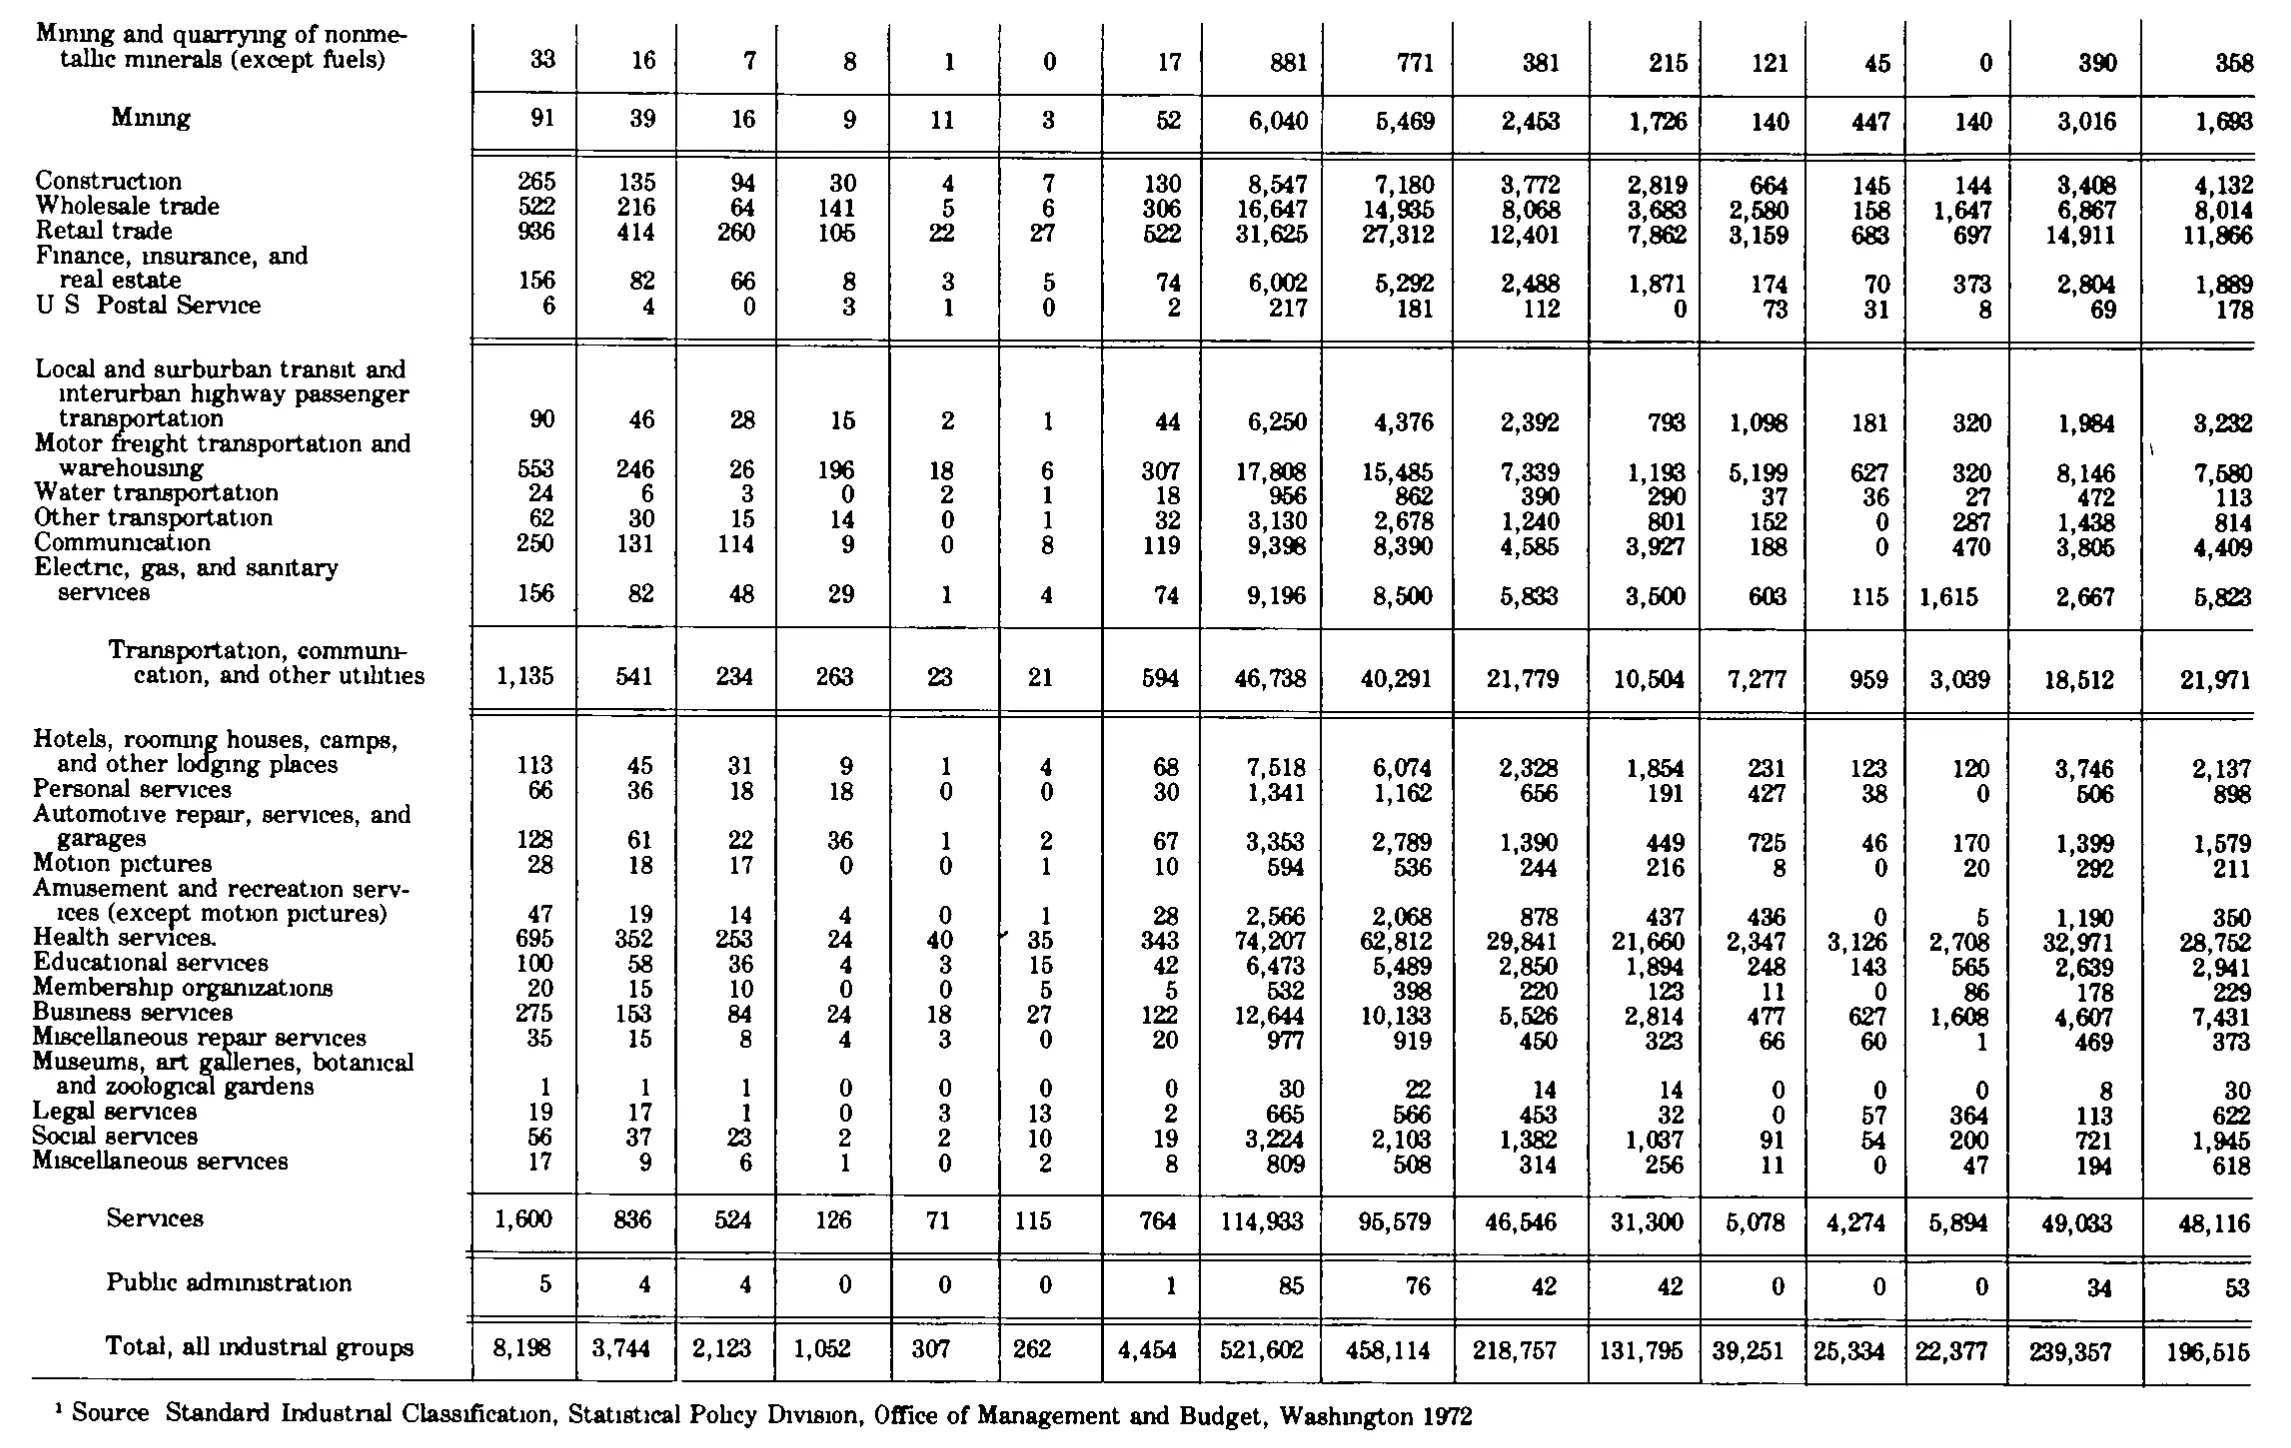
Industrial Distribution of Representation Elections Held in Cases Closed, Fiscal Year 1980
Stitched from pp. 297–298.
| Industrial group | Total elections | Number of elections in which representation rights were won by unions | Number of elections in which no representative was chosen | Number of employees eligible to vote | Total valid votes cast | Valid votes cast for unions | Total votes for no union | Eligible employees in units choosing representation | ||||||||
|---|---|---|---|---|---|---|---|---|---|---|---|---|---|---|---|---|
| Industrial group | Total elections | Total | AFL-CIO unions | Teamsters | Other national unions | Other local unions | Number of elections in which no representative was chosen | Number of employees eligible to vote | Total valid votes cast | Total | AFL-CIO unions | Teamsters | Other national unions | Other local unions | Total votes for no union | Eligible employees in units choosing representation |
| Food and kindred products | 411 | 186 | 89 | 81 | 5 | 11 | 225 | 27,823 | 23,780 | 12,038 | 7,042 | 4,312 | 56 | 628 | 11,742 | 12,777 |
| Tobacco manufacturers | 6 | 1 | 1 | 0 | 0 | 0 | 5 | 1,822 | 1,751 | 568 | 432 | 0 | 0 | 136 | 1,183 | 100 |
| Textile mill products | 54 | 17 | 14 | 1 | 1 | 1 | 37 | 9,812 | 8,949 | 3,518 | 3,221 | 135 | 50 | 112 | 5,431 | 1,425 |
| Apparel and other finished products made from fabric and similar materials | 102 | 49 | 38 | 5 | 2 | 4 | 53 | 11,562 | 10,572 | 4,793 | 4,471 | 122 | 70 | 130 | 5,779 | 4,252 |
| Lumber and wood products (except furniture) | 178 | 82 | 55 | 18 | 3 | 6 | 96 | 10,874 | 9,695 | 4,343 | 3,362 | 655 | 102 | 224 | 5,352 | 3,753 |
| Furniture and fixtures | 114 | 47 | 35 | 8 | 3 | 1 | 67 | 8,802 | 7,925 | 3,665 | 2,777 | 401 | 416 | 71 | 4,260 | 2,728 |
| Paper and allied products | 95 | 46 | 29 | 10 | 4 | 3 | 49 | 7,500 | 6,713 | 2,944 | 1,612 | 1,154 | 99 | 79 | 3,769 | 2,317 |
| Printing, publishing, and allied products | 241 | 107 | 92 | 12 | 0 | 3 | 134 | 13,165 | 11,986 | 5,225 | 4,436 | 676 | 0 | 113 | 6,761 | 3,939 |
| Chemicals and allied products | 192 | 70 | 35 | 31 | 3 | 1 | 122 | 8,182 | 7,572 | 3,347 | 1,992 | 1,167 | 154 | 34 | 4,225 | 2,106 |
| Petroleum refining and related industries | 70 | 30 | 14 | 15 | 0 | 1 | 40 | 3,299 | 2,880 | 1,137 | 683 | 332 | 0 | 122 | 1,743 | 848 |
| Rubber and miscellaneous plastics products | 172 | 82 | 51 | 17 | 10 | 4 | 90 | 11,852 | 10,582 | 4,698 | 3,163 | 731 | 680 | 124 | 5,884 | 4,560 |
| Leather and leather products | 36 | 12 | 8 | 1 | 0 | 3 | 24 | 7,757 | 7,008 | 2,777 | 2,227 | 269 | 11 | 270 | 4,231 | 1,214 |
| Stone, clay, glass, and concrete products | 149 | 59 | 32 | 18 | 3 | 6 | 90 | 12,700 | 11,019 | 6,197 | 2,772 | 480 | 1,142 | 1,803 | 4,822 | 5,241 |
| Primary metal industries | 202 | 96 | 52 | 21 | 18 | 5 | 106 | 13,436 | 12,218 | 5,864 | 3,242 | 925 | 1,256 | 441 | 6,354 | 5,761 |
| Fabricated metal products (except machinery and transportation equipment) | 343 | 141 | 88 | 30 | 20 | 3 | 202 | 22,759 | 20,379 | 9,352 | 5,162 | 1,733 | 1,847 | 610 | 11,027 | 7,339 |
| Machinery (except electrical) | 326 | 114 | 61 | 22 | 27 | 4 | 212 | 27,714 | 25,682 | 11,354 | 6,300 | 1,752 | 3,148 | 154 | 14,328 | 9,068 |
| Electrical and electronic machinery, equipment, and supplies | 227 | 90 | 59 | 15 | 9 | 7 | 137 | 37,854 | 34,658 | 17,244 | 10,420 | 3,023 | 1,549 | 2,252 | 17,414 | 15,985 |
| Aircraft and parts | 204 | 90 | 27 | 21 | 37 | 5 | 114 | 29,588 | 26,649 | 12,547 | 3,452 | 940 | 5,322 | 2,833 | 14,102 | 7,441 |
| Ship and boat building and repairing | 27 | 9 | 5 | 1 | 2 | 1 | 18 | 2,394 | 2,158 | 826 | 523 | 70 | 213 | 20 | 1,332 | 472 |
| Automotive and other transportation equipment | 13 | 6 | 2 | 1 | 3 | 0 | 7 | 2,622 | 2,331 | 1,305 | 269 | 14 | 943 | 79 | 1,026 | 2,075 |
| Measuring, analyzing, and controlling instruments, photographic, medical, and optical goods, watches and clocks | 86 | 32 | 20 | 5 | 4 | 3 | 54 | 6,722 | 5,887 | 2,499 | 1,821 | 383 | 253 | 42 | 3,388 | 1,515 |
| Miscellaneous manufacturing industries | 234 | 107 | 54 | 34 | 13 | 6 | 127 | 12,529 | 11,405 | 4,855 | 2,609 | 832 | 1,256 | 158 | 6,550 | 3,687 |
| Manufacturing | 3,482 | 1,473 | 861 | 367 | 167 | 78 | 2,009 | 290,768 | 261,799 | 121,096 | 71,988 | 20,106 | 18,567 | 10,435 | 140,703 | 98,603 |
| Metal mining | 11 | 2 | 1 | 1 | 0 | 0 | 9 | 1,730 | 1,590 | 537 | 523 | 14 | 0 | 0 | 1,053 | 158 |
| Coal mining | 40 | 19 | 6 | 0 | 10 | 3 | 21 | 2,553 | 2,307 | 1,314 | 767 | 5 | 402 | 140 | 993 | 1,166 |
| Oil and gas extraction | 7 | 2 | 2 | 0 | 0 | 0 | 5 | 876 | 801 | 221 | 221 | 0 | 0 | 0 | 580 | 11 |
| Mining and quarrying of nonmetallic minerals (except fuels) | 33 | 16 | 7 | 8 | 1 | 0 | 17 | 881 | 771 | 381 | 215 | 121 | 45 | 0 | 390 | 358 |
| Mining | 91 | 39 | 16 | 9 | 11 | 3 | 52 | 6,040 | 5,469 | 2,453 | 1,726 | 140 | 447 | 140 | 3,016 | 1,693 |
| Construction | 265 | 135 | 94 | 30 | 4 | 7 | 130 | 8,547 | 7,180 | 3,772 | 2,819 | 664 | 145 | 144 | 3,408 | 4,132 |
| Wholesale trade | 522 | 216 | 64 | 141 | 5 | 6 | 306 | 16,647 | 14,935 | 8,068 | 3,683 | 2,580 | 158 | 1,647 | 6,867 | 8,014 |
| Retail trade | 936 | 414 | 260 | 105 | 22 | 27 | 522 | 31,625 | 27,312 | 12,401 | 7,862 | 3,159 | 683 | 697 | 14,911 | 11,866 |
| Finance, insurance, and real estate | 156 | 82 | 66 | 8 | 3 | 5 | 74 | 6,002 | 5,292 | 2,488 | 1,871 | 174 | 70 | 373 | 2,804 | 1,889 |
| U S Postal Service | 6 | 4 | 0 | 3 | 1 | 0 | 2 | 217 | 181 | 112 | 0 | 73 | 31 | 8 | 69 | 178 |
| Local and surburban transit and interurban highway passenger transportation | 90 | 46 | 28 | 15 | 2 | 1 | 44 | 6,250 | 4,376 | 2,392 | 793 | 1,098 | 181 | 320 | 1,984 | 3,232 |
| Motor freight transportation and warehousing | 553 | 246 | 26 | 196 | 18 | 6 | 307 | 17,808 | 15,485 | 7,339 | 1,193 | 5,199 | 627 | 320 | 8,146 | 7,580 |
| Water transportation | 24 | 6 | 3 | 0 | 2 | 1 | 18 | 956 | 862 | 390 | 290 | 37 | 36 | 27 | 472 | 113 |
| Other transportation | 62 | 30 | 15 | 14 | 0 | 1 | 32 | 3,130 | 2,678 | 1,240 | 801 | 152 | 0 | 287 | 1,438 | 814 |
| Communication | 250 | 131 | 114 | 9 | 0 | 8 | 119 | 9,398 | 8,390 | 4,585 | 3,927 | 188 | 0 | 470 | 3,805 | 4,409 |
| Electric, gas, and sanitary services | 156 | 82 | 48 | 29 | 1 | 4 | 74 | 9,196 | 8,500 | 5,833 | 3,500 | 603 | 115 | 1,615 | 2,667 | 5,823 |
| Transportation, communication, and other utilities | 1,135 | 541 | 234 | 263 | 23 | 21 | 594 | 46,738 | 40,291 | 21,779 | 10,504 | 7,277 | 959 | 3,039 | 18,512 | 21,971 |
| Hotels, rooming houses, camps, and other lodging places | 113 | 45 | 31 | 9 | 1 | 4 | 68 | 7,518 | 6,074 | 2,328 | 1,854 | 231 | 123 | 120 | 3,746 | 2,137 |
| Personal services | 66 | 36 | 18 | 18 | 0 | 0 | 30 | 1,341 | 1,162 | 656 | 191 | 427 | 38 | 0 | 506 | 898 |
| Automotive repair, services, and garages | 128 | 61 | 22 | 36 | 1 | 2 | 67 | 3,353 | 2,789 | 1,390 | 449 | 725 | 46 | 170 | 1,399 | 1,579 |
| Motion pictures | 28 | 18 | 17 | 0 | 0 | 1 | 10 | 594 | 536 | 244 | 216 | 8 | 0 | 20 | 292 | 211 |
| Amusement and recreation services (except motion pictures) | 47 | 19 | 14 | 4 | 0 | 1 | 28 | 2,566 | 2,068 | 878 | 437 | 436 | 0 | 5 | 1,190 | 350 |
| Health services | 695 | 352 | 253 | 24 | 40 | 35 | 343 | 74,207 | 62,812 | 29,841 | 21,660 | 2,347 | 3,126 | 2,708 | 32,971 | 28,752 |
| Educational services | 100 | 58 | 36 | 4 | 3 | 15 | 42 | 6,473 | 5,489 | 2,850 | 1,894 | 248 | 143 | 565 | 2,639 | 2,941 |
| Membership organizations | 20 | 15 | 10 | 0 | 0 | 5 | 5 | 532 | 398 | 220 | 123 | 11 | 0 | 86 | 178 | 229 |
| Business services | 275 | 153 | 84 | 24 | 18 | 27 | 122 | 12,644 | 10,133 | 5,526 | 2,814 | 477 | 627 | 1,608 | 4,607 | 7,431 |
| Miscellaneous repair services | 35 | 15 | 8 | 4 | 3 | 0 | 20 | 977 | 919 | 450 | 323 | 66 | 60 | 1 | 469 | 373 |
| Museums, art galleries, botanical and zoological gardens | 1 | 1 | 1 | 0 | 0 | 0 | 0 | 30 | 22 | 14 | 14 | 0 | 0 | 0 | 8 | 30 |
| Legal services | 19 | 17 | 1 | 0 | 3 | 13 | 2 | 665 | 566 | 453 | 32 | 0 | 57 | 364 | 113 | 622 |
| Social services | 56 | 37 | 23 | 2 | 2 | 10 | 19 | 3,224 | 2,103 | 1,382 | 1,037 | 91 | 54 | 200 | 721 | 1,945 |
| Miscellaneous services | 17 | 9 | 6 | 1 | 0 | 2 | 8 | 809 | 508 | 314 | 256 | 11 | 0 | 47 | 194 | 618 |
| Services | 1,600 | 836 | 524 | 126 | 71 | 115 | 764 | 114,933 | 95,579 | 46,546 | 31,300 | 5,078 | 4,274 | 5,894 | 49,033 | 48,116 |
| Public administration | 5 | 4 | 4 | 0 | 0 | 0 | 1 | 85 | 76 | 42 | 42 | 0 | 0 | 0 | 34 | 53 |
| Total, all industrial groups | 8,198 | 3,744 | 2,123 | 1,052 | 307 | 262 | 4,454 | 521,602 | 458,114 | 218,757 | 131,795 | 39,251 | 25,334 | 22,377 | 239,357 | 196,515 |
- 1 Source Standard Industrial Classification, Statistical Policy Division, Office of Management and Budget, Washington 1972
851 of 851 figures sit in a row or column sum that works out.
Reader’s notes
p. 297. The crop is cut off at the bottom: the table continues past "Oil and gas extraction" (the mining/non-manufacturing section is incomplete and no grand total is shown). The footnote marker 1 on the stub heading "Industrial group" is printed, but the footnote text itself falls below the crop, so `footnotes` is empty. Scan quality: the OCR-era type renders "i" with a flat/dotless look (e.g. "Industrial", "mining"), but wording was legible throughout. Internal arithmetic checks pass on every transcribed row (component union columns sum to each "Total", and union + no-union votes equal total valid votes cast; the 22 manufacturing industry rows sum exactly to the "Manufacturing" line in all six election-count columns), which supports the digit readings and the column assignments. Two cells where stray marks appear near the figures but the values read cleanly: "Printing, publishing, and allied products" / Valid votes cast for unions – AFL-CIO unions (4,436, with a stray dash to its left) and the header rule above "Valid votes cast for unions" – AFL-CIO unions.
p. 298. Continuation page: the crop shows no column headings at all (the table's head is on the preceding page), so header_rows is empty. The grid has 17 columns (stub + 16 numeric), counted from the column rules and confirmed on every row including the total line. The transcription was checked against the table's own arithmetic, which holds throughout and makes the column placement reliable: col2 = col3+col4+col5+col6 and col1 = col2+col7 on every row; col10 = col11+col12+col13+col14 on every row; col15 = col9-col10 on every row; and the "Transportation, communication, and other utilities", "Services" and "Mining" lines equal the sums of their component rows in all of columns 8-16 (e.g. Services col16: 2,137+898+...+618 = 48,116 as printed). No printed value appeared to be in error. The first row and the "Mining" subtotal continue the Mining group begun on the previous page; "Mining", "Transportation, communication, and other utilities", "Services" and "Total, all industrial groups" are centred group-total lines, not data rows. Punctuation transcribed as it appears in this scan, which has dropped some small marks: the stub reads "U S Postal Service" (the periods of "U.S." are not visible) and the footnote reads "Source" followed by a gap where a colon would normally stand, and "Washington 1972" with no comma. The original print very likely had "U.S." and "Source:" / "Washington, 1972"; I did not add them. "Local and surburban transit and interurban highway passenger transportation" is transcribed as printed; "surburban" is a misprint for "suburban". Two small stray ink marks are present and are not footnote markers: one at the far right edge beside the "Motor freight transportation and warehousing" row (right of 7,580), and one just left of the "35" in column 6 of the "Health services" row.
Source image
Source data: U.S. NLRB Annual Reports (public domain). Reconstruction by NLRB Stats Archive. Read by claude-opus-5 (effort max, prompt extract_v1) from the 300-dpi scan; stitched by page. Updated October 2026.