NLRB Stats Archive › Annual Reports › FY1980 › Final outcome of representation elections in cases closed
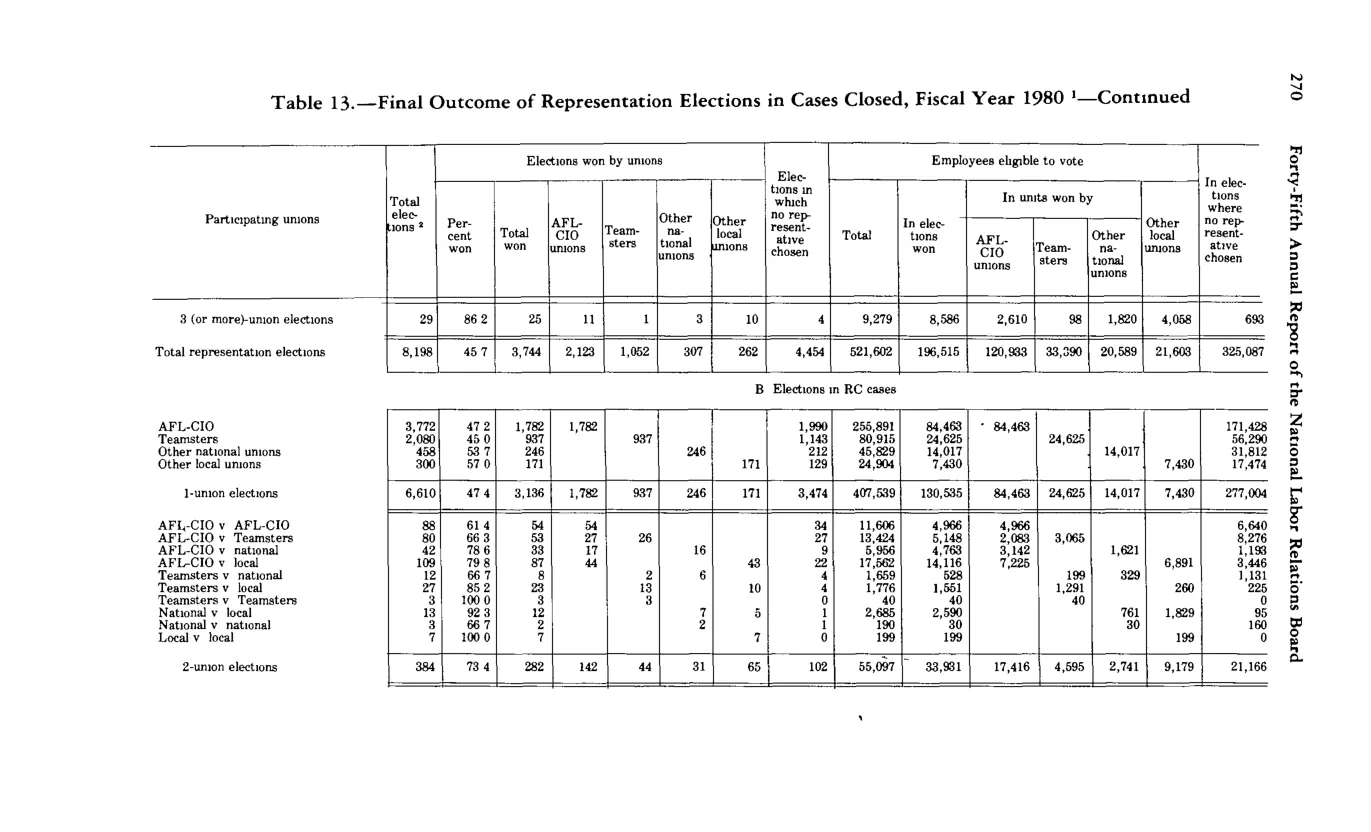
Final outcome of representation elections in cases closed
| Total elections | Percent won | Elections won by unions — Total won | Elections won by unions — AFL-CIO unions | Elections won by unions — Teamsters | Elections won by unions — Other national unions | Elections won by unions — Other local unions | Elections in which no representative chosen | Employees eligible to vote — Total | Employees eligible to vote — In elections won | Employees eligible to vote — In units won by AFL-CIO | Employees eligible to vote — Teamsters | Employees eligible to vote — Other national unions | Employees eligible to vote — Other local unions | Employees eligible to vote — In elections in which no representative chosen | |
|---|---|---|---|---|---|---|---|---|---|---|---|---|---|---|---|
| 3 (or more)-union elections | 29 | 86.2 | 25 | 11 | 1 | 3 | 10 | 4 | 9,279 | 8,586 | 2,610 | 98 | 1,820 | 4,058 | 693 |
| Total representation elections | 8,198 | 45.7 | 3,744 | 2,123 | 1,052 | 207 | 262 | 4,454 | 120,983 | 33,290 | 20,569 | 21,653 | 325,087 | ||
| RC 1-union — AFL-CIO | 3,772 | 47.2 | 1,782 | 1,782 | 255,891 | 84,453 | 84,453 | 171,438 | |||||||
| RC 1-union — Teamsters | 2,080 | 43.9 | 937 | 937 | 24,625 | 56,290 | |||||||||
| RC 1-union — Other national unions | 482 | 51 | 246 | 246 | 14,017 | ||||||||||
| RC 1-union — Other local unions | 300 | 57 | 171 | 171 | 7,430 | ||||||||||
| RC 1-union elections (subtotal) | 6,610 | 47.4 | 3,136 | 1,782 | 937 | 246 | 171 | 3,474 | 497,539 | 84,453 | 84,453 | 24,625 | 14,017 | 7,430 | 277,004 |
| RC 2-union elections (subtotal) | 384 | 78.6 | 282 | 142 | 44 | 31 | 65 | 102 | 55,097 | 33,931 | 17,416 | 4,305 | 2,761 | 9,179 | 21,166 |
Source image
Source data: U.S. NLRB Annual Reports (public domain). Reconstruction by NLRB Stats Archive. Updated June 2026.