NLRB Stats Archive › Annual Reports › FY1980 › Court of appeals dispositions of NLRB orders
Court of appeals dispositions of NLRB orders
Pages shown separately: their columns differ (pp. 33, 34).
Page 33
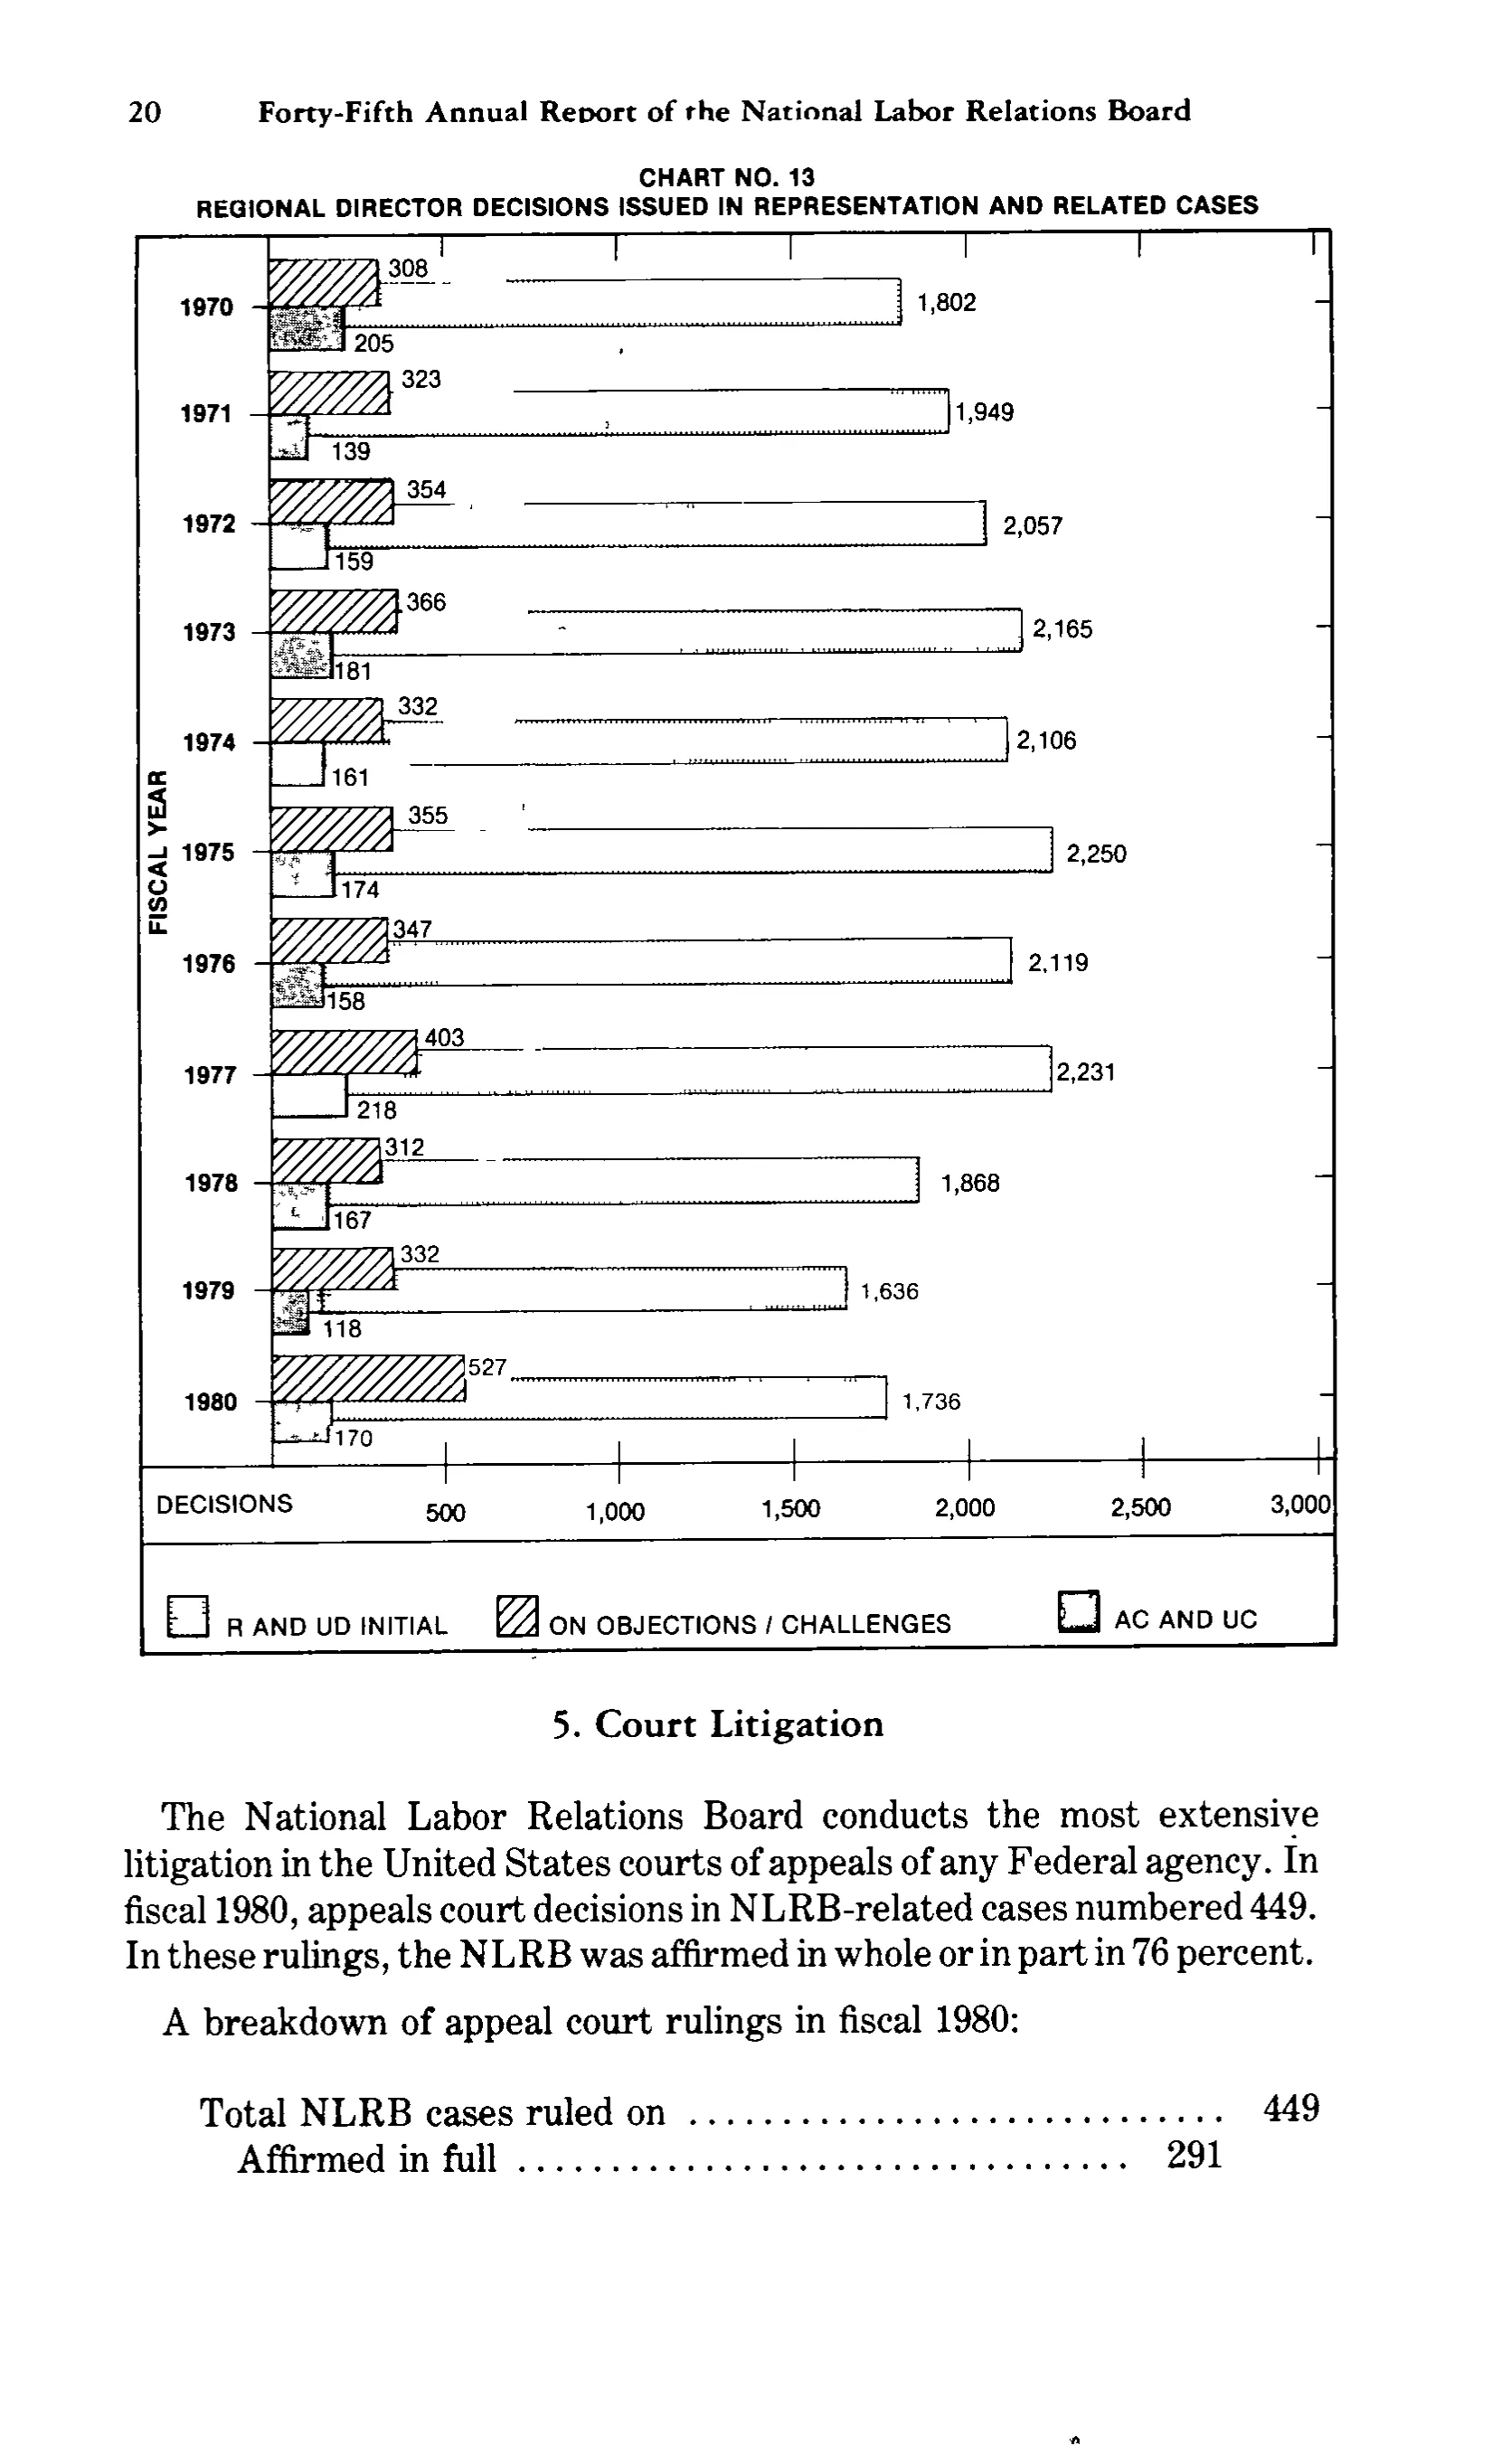
| FISCAL YEAR | ON OBJECTIONS / CHALLENGES | R AND UD INITIAL | AC AND UC |
|---|---|---|---|
| 1970 | 308 | 1,802 | 205 |
| 1971 | 323 | 1,949 | 139 |
| 1972 | 354 | 2,057 | 159 |
| 1973 | 366 | 2,165 | 181 |
| 1974 | 332 | 2,106 | 161 |
| 1975 | 355 | 2,250 | 174 |
| 1976 | 347 | 2,119 | 158 |
| 1977 | 403 | 2,231 | 218 |
| 1978 | 312 | 1,868 | 167 |
| 1979 | 332 | 1,636 | 118 |
| 1980 | 527 | 1,736 | 170 |
Page 34
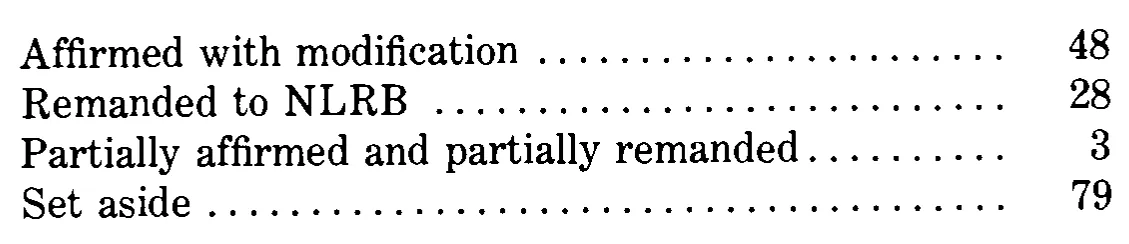
| Affirmed with modification | 48 |
|---|---|
| Remanded to NLRB | 28 |
| Partially affirmed and partially remanded | 3 |
| Set aside | 79 |
Reader’s notes
p. 33. The crop is not a ruled statistical table: it is CHART NO. 13, "REGIONAL DIRECTOR DECISIONS ISSUED IN REPRESENTATION AND RELATED CASES", a horizontal bar chart. The grid above reproduces the printed data labels at the end of each bar; there are no printed column rules or column headings. Structure of the chart and how it was mapped to columns: the vertical axis is labelled "FISCAL YEAR" (used here as the stub heading) and runs 1970 at the top to 1980 at the bottom; the horizontal axis is labelled "DECISIONS" with tick labels 500, 1,000, 1,500, 2,000, 2,500, 3,000. Each fiscal year carries three bars, and the three column headings are taken verbatim from the legend box printed below the chart: "R AND UD INITIAL" (open box), "ON OBJECTIONS / CHALLENGES" (diagonally hatched box), "AC AND UC" (stippled box). Columns are ordered as the bars are printed top-to-bottom within each year group (hatched bar first, then the long open bar, then the stippled bar), which is NOT the left-to-right order of the legend; the legend order is R AND UD INITIAL, ON OBJECTIONS / CHALLENGES, AC AND UC. The pattern-to-legend matching is my reading of a degraded 1-bit scan in which the open and stippled fills are partly broken up (e.g. the 1980 bottom bar is faint); the magnitudes support it, the long ~1,600-2,250 bar being R and UD initial decisions and the ~120-220 bar being AC and UC. Values are read off short leader lines from each bar; the leader for the middle bar is dotted and in a few years (1974, 1976, 1979) runs close to the label of the neighbouring bar, but each printed figure sits unambiguously at the end of its own bar. Not included in the grid, as they are running text rather than part of the chart: the section head "5. Court Litigation", the two paragraphs beneath it, and the leader-dot tabulation that begins "Total NLRB cases ruled on .... 449 / Affirmed in full .... 291". That tabulation is cut off by the bottom of the crop and continues on the page below.
p. 34. The crop is a fragment that continues a table from the preceding page: no column headings, no caption and no footnotes are printed on this image, so header_rows is empty. The grid has two columns, a stub of row labels and a single column of counts, both read clearly. All four printed rows are transcribed; nothing appears cut off at the left or right edge, though the crop begins and ends mid-table vertically.
Source image
Source data: U.S. NLRB Annual Reports (public domain). Reconstruction by NLRB Stats Archive. Read by claude-opus-5 (effort max, prompt extract_v1) from the 300-dpi scan; stitched by page. Updated October 2026.