NLRB Stats Archive › Annual Reports › FY1979 › Proceedings Decided by Circuit Courts of Appeals on Petitions for Enforcement and/or Review of Board Orders, Fiscal Year 1979 Compared With 5-Year Cumulative Totals, Fiscal Years 1974 Through 1978
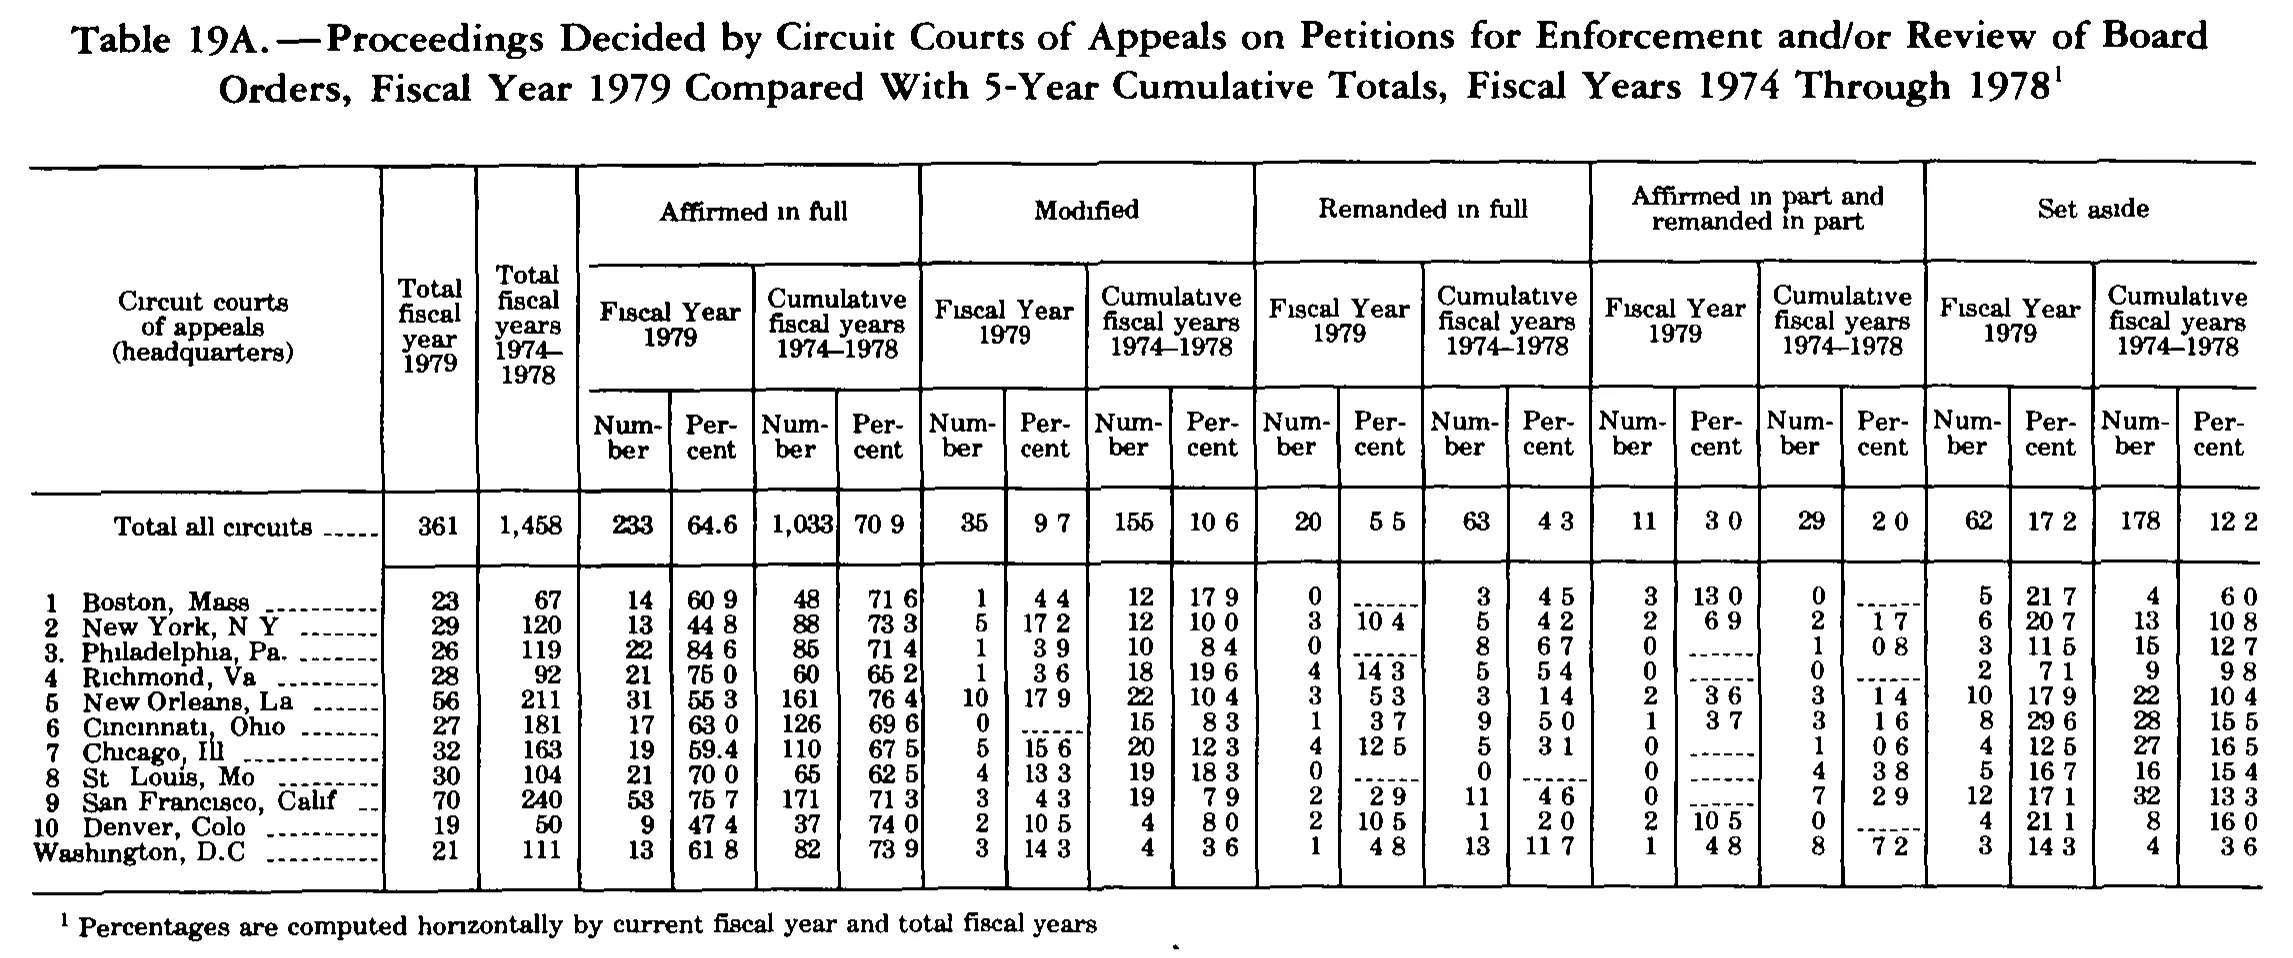
Proceedings Decided by Circuit Courts of Appeals on Petitions for Enforcement and/or Review of Board Orders, Fiscal Year 1979 Compared With 5-Year Cumulative Totals, Fiscal Years 1974 Through 1978
| Circuit courts of appeals (headquarters) | Total fiscal year 1979 | Total fiscal years 1974-1978 | Affirmed in full | Modified | Remanded in full | Affirmed in part and remanded in part | Set aside | |||||||||||||||
|---|---|---|---|---|---|---|---|---|---|---|---|---|---|---|---|---|---|---|---|---|---|---|
| Circuit courts of appeals (headquarters) | Total fiscal year 1979 | Total fiscal years 1974-1978 | Fiscal Year 1979 | Cumulative fiscal years 1974-1978 | Fiscal Year 1979 | Cumulative fiscal years 1974-1978 | Fiscal Year 1979 | Cumulative fiscal years 1974-1978 | Fiscal Year 1979 | Cumulative fiscal years 1974-1978 | Fiscal Year 1979 | Cumulative fiscal years 1974-1978 | ||||||||||
| Circuit courts of appeals (headquarters) | Total fiscal year 1979 | Total fiscal years 1974-1978 | Number | Percent | Number | Percent | Number | Percent | Number | Percent | Number | Percent | Number | Percent | Number | Percent | Number | Percent | Number | Percent | Number | Percent |
| Total all circuits | 361 | 1,458 | 233 | 64.6 | 1,033 | 70.9 | 35 | 9.7 | 155 | 10.6 | 20 | 5.5 | 63 | 4.3 | 11 | 3.0 | 29 | 2.0 | 62 | 17.2 | 178 | 12.2 |
| 1 Boston, Mass | 23 | 67 | 14 | 60.9 | 48 | 71.6 | 1 | 4.4 | 12 | 17.9 | 0 | 3 | 4.5 | 3 | 13.0 | 0 | 5 | 21.7 | 4 | 6.0 | ||
| 2 New York, N Y | 29 | 120 | 13 | 44.8 | 88 | 73.3 | 5 | 17.2 | 12 | 10.0 | 3 | 10.4 | 5 | 4.2 | 2 | 6.9 | 2 | 1.7 | 6 | 20.7 | 13 | 10.8 |
| 3. Philadelphia, Pa. | 26 | 119 | 22 | 84.6 | 85 | 71.4 | 1 | 3.9 | 10 | 8.4 | 0 | 8 | 6.7 | 0 | 1 | 0.8 | 3 | 11.5 | 15 | 12.7 | ||
| 4 Richmond, Va | 28 | 92 | 21 | 75.0 | 60 | 65.2 | 1 | 3.6 | 18 | 19.6 | 4 | 14.3 | 5 | 5.4 | 0 | 0 | 2 | 7.1 | 9 | 9.8 | ||
| 5 New Orleans, La | 56 | 211 | 31 | 55.3 | 161 | 76.4 | 10 | 17.9 | 22 | 10.4 | 3 | 5.3 | 3 | 1.4 | 2 | 3.6 | 3 | 1.4 | 10 | 17.9 | 22 | 10.4 |
| 6 Cincinnati, Ohio | 27 | 181 | 17 | 63.0 | 126 | 69.6 | 0 | 15 | 8.3 | 1 | 3.7 | 9 | 5.0 | 1 | 3.7 | 3 | 1.6 | 8 | 29.6 | 28 | 15.5 | |
| 7 Chicago, Ill | 32 | 163 | 19 | 59.4 | 110 | 67.5 | 5 | 15.6 | 20 | 12.3 | 4 | 12.5 | 5 | 3.1 | 0 | 1 | 0.6 | 4 | 12.5 | 27 | 16.5 | |
| 8 St Louis, Mo | 30 | 104 | 21 | 70.0 | 65 | 62.5 | 4 | 13.3 | 19 | 18.3 | 0 | 0 | 0 | 4 | 3.8 | 5 | 16.7 | 16 | 15.4 | |||
| 9 San Francisco, Calif | 70 | 240 | 53 | 75.7 | 171 | 71.3 | 3 | 4.3 | 19 | 7.9 | 2 | 2.9 | 11 | 4.6 | 0 | 7 | 2.9 | 12 | 17.1 | 32 | 13.3 | |
| 10 Denver, Colo | 19 | 50 | 9 | 47.4 | 37 | 74.0 | 2 | 10.5 | 4 | 8.0 | 2 | 10.5 | 1 | 2.0 | 2 | 10.5 | 0 | 4 | 21.1 | 8 | 16.0 | |
| Washington, D.C | 21 | 111 | 13 | 61.8 | 82 | 73.9 | 3 | 14.3 | 4 | 3.6 | 1 | 4.8 | 13 | 11.7 | 1 | 4.8 | 8 | 7.2 | 3 | 14.3 | 4 | 3.6 |
- 1 Percentages are computed horizontally by current fiscal year and total fiscal years
131 of 131 figures sit in a row or column sum that works out.
Reader’s notes
p. 327. 23 columns: stub, two "Total" columns that span all three heading levels, then five outcome groups ("Affirmed in full", "Modified", "Remanded in full", "Affirmed in part and remanded in part", "Set aside"), each split Fiscal Year 1979 / Cumulative fiscal years 1974-1978 and each of those into Number / Percent. DECIMAL POINTS IN PERCENT COLUMNS: this 1-bit scan drops most of the small decimal points, so nearly every percent prints as digits separated by a gap ("70 9", "9 7", "13 3"); only a few survive legibly ("64.6" in the total row, "59.4" for Chicago). All percents are one-decimal figures, so I have written them with the decimal point restored (e.g. "70 9" -> "70.9"). This is the only normalisation applied; no digits were changed. VERIFICATION: every column of counts sums across the eleven circuits to the printed "Total all circuits" figure (361; 1,458; 233; 1,033; 35; 155; 20; 63; 11; 29; 62; 178), and every circuit's five counts sum to its own row total in both the FY1979 and the cumulative panels. Each row's five percents sums to 100.0. This cross-check confirms the column assignment of every number. A few printed percents are rounded away from the exact quotient so the row reaches 100.0 (e.g. 64.6 for 233/361 = 64.54; 76.4 for 161/211 = 76.30; 12.7 for 15/119 = 12.61; 61.8 for 13/21 = 61.90). Transcribed as printed, not recomputed. Cells holding only a dash rule ("------"), which the table uses for a zero percentage, are given as "". St. Louis has three such percent cells (Remanded in full FY1979, Remanded in full cumulative, Affirmed in part FY1979) beside printed counts of 0. ROW LABELS: the scan loses many of the small periods in the circuit labels, so abbreviations are transcribed as legible rather than as certainly printed — "3. Philadelphia, Pa." shows its periods clearly while "1 Boston, Mass", "2 New York, N Y", "8 St Louis, Mo" and "Washington, D.C" do not. The underlying print very likely carries periods throughout ("1. Boston, Mass.", "N.Y.", "St. Louis", "D.C."). The last row carries no circuit number in the stub; the label begins at the left margin. The footnote marker 1 appears on "1978" in the table caption, which is excluded per instructions; the footnote text itself is retained.
Source image
Source data: U.S. NLRB Annual Reports (public domain). Reconstruction by NLRB Stats Archive. Read by claude-opus-5 (effort max, prompt extract_v1) from the 300-dpi scan; stitched by page. Updated October 2026.