NLRB Stats Archive › Annual Reports › FY1979 › Distribution of Unfair Labor Practice Situations Received, by Number of Employees in Establishments, Fiscal Year 1979
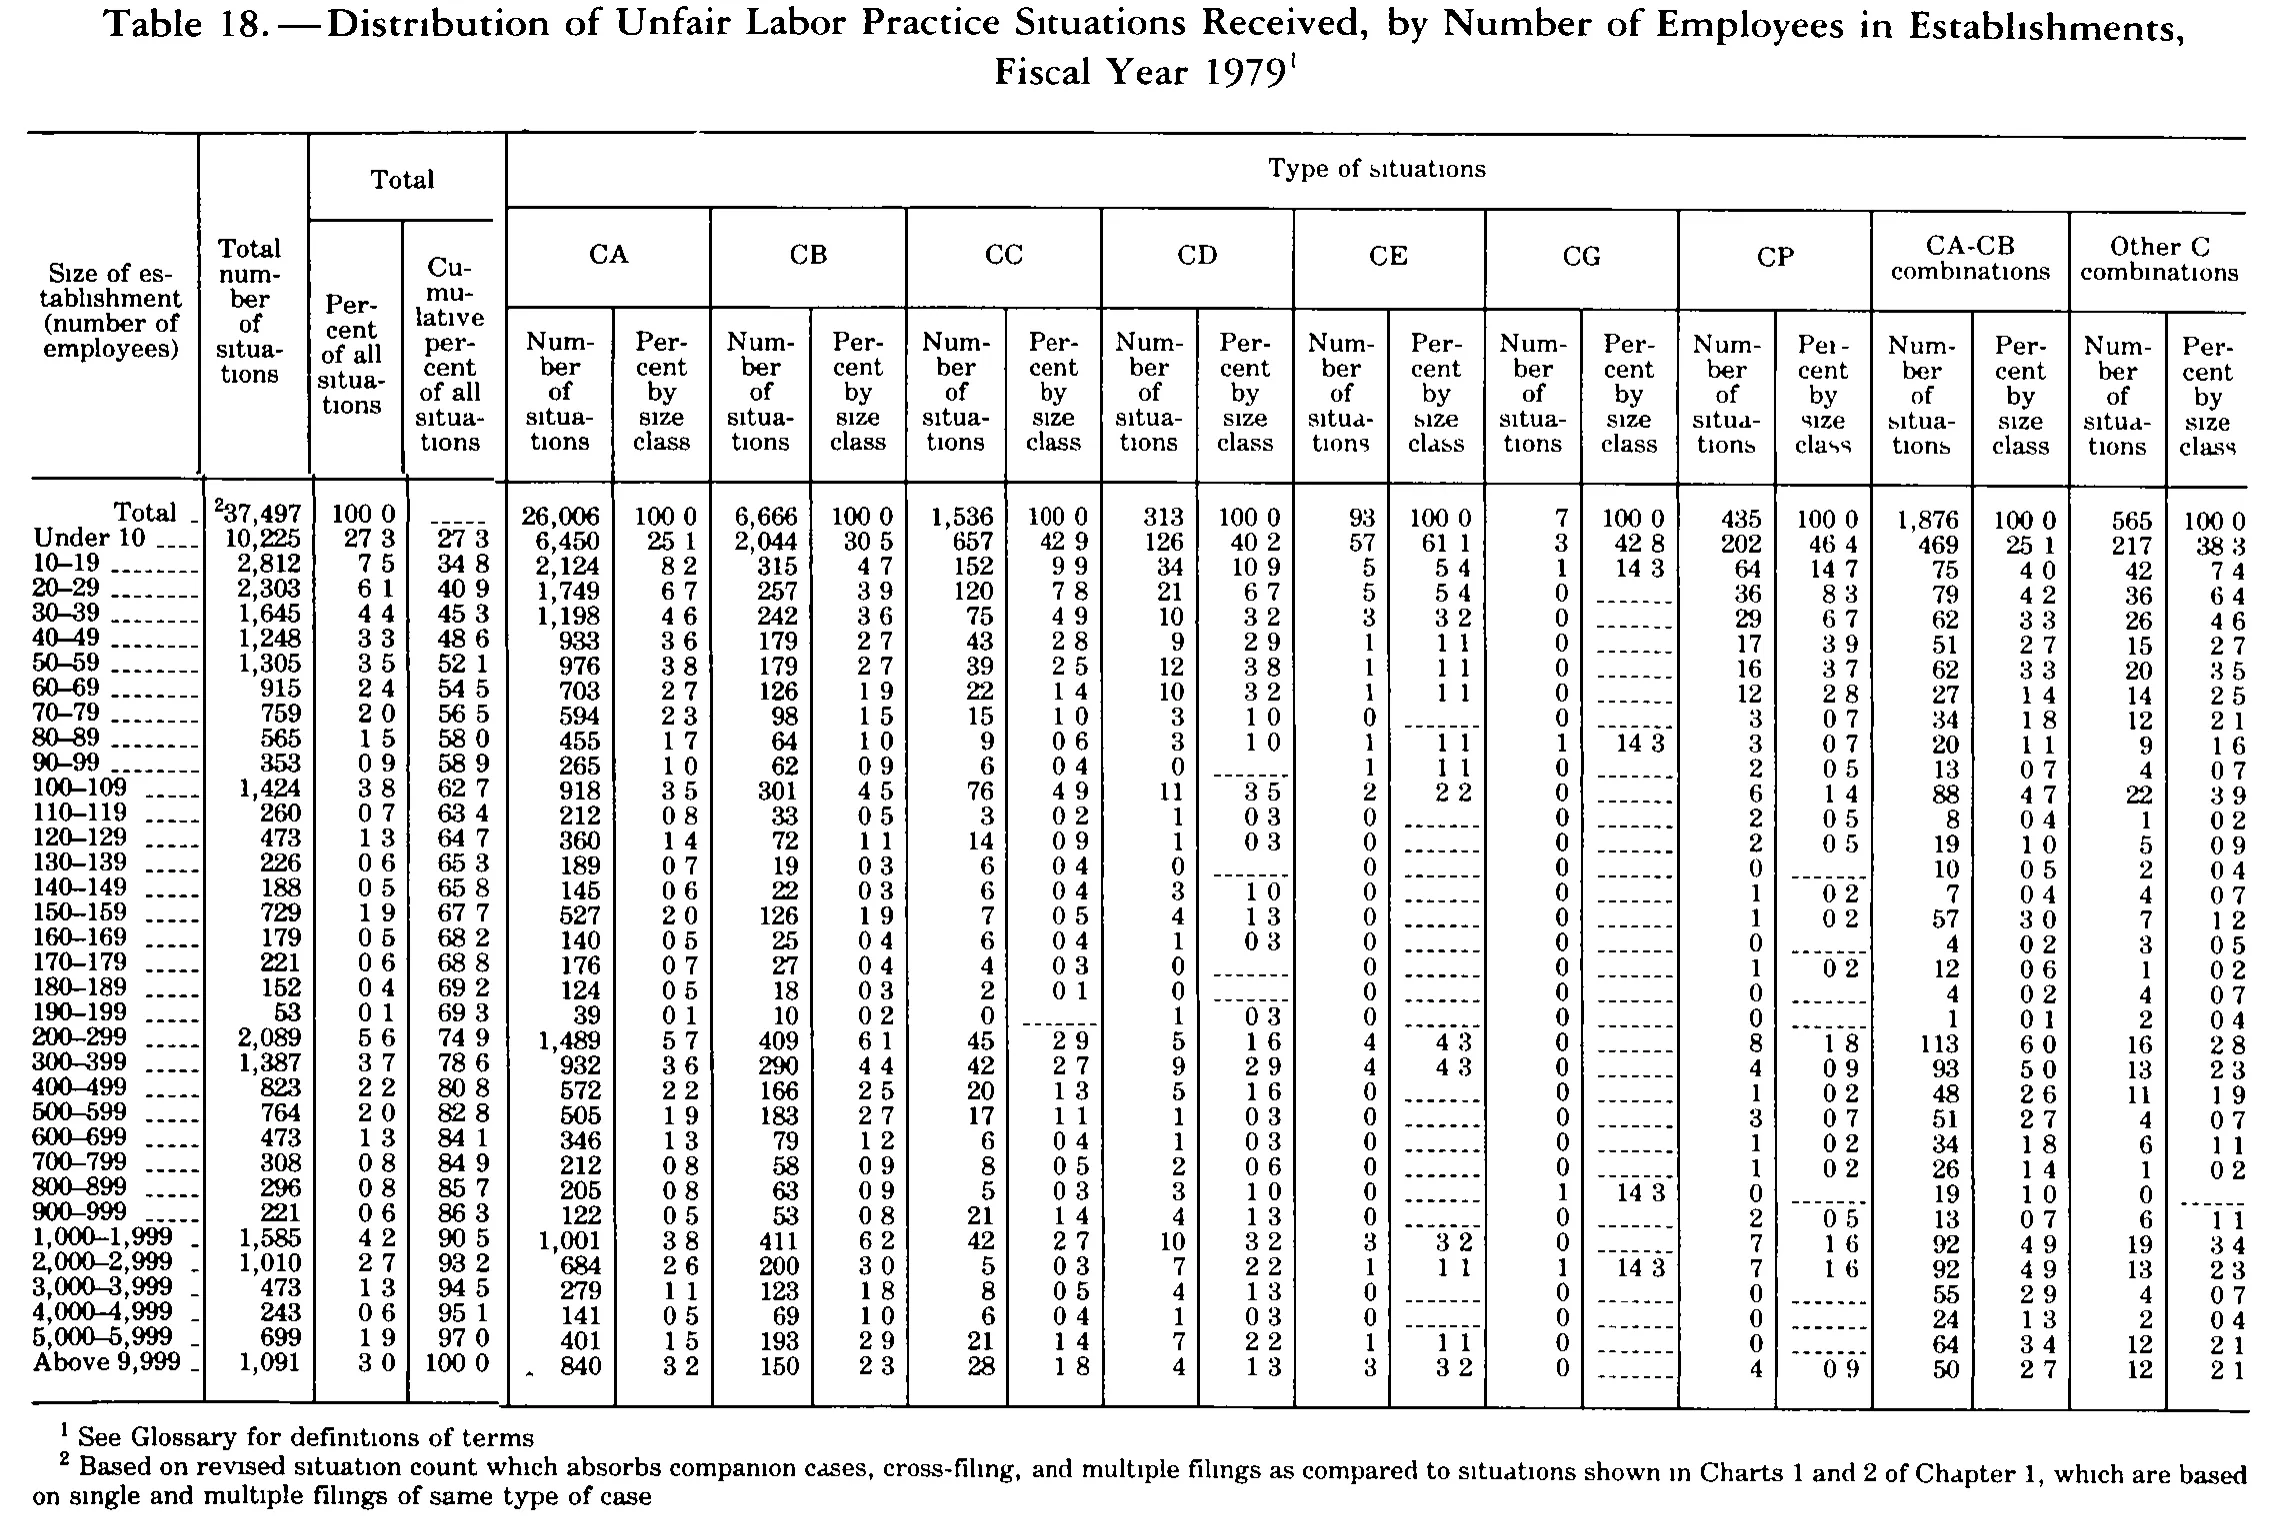
Distribution of Unfair Labor Practice Situations Received, by Number of Employees in Establishments, Fiscal Year 1979
| Size of establishment (number of employees) | Total number of situations | Total | Type of situations | ||||||||||||||||||
|---|---|---|---|---|---|---|---|---|---|---|---|---|---|---|---|---|---|---|---|---|---|
| Size of establishment (number of employees) | Total number of situations | Percent of all situations | Cumulative percent of all situations | CA | CB | CC | CD | CE | CG | CP | CA-CB combinations | Other C combinations | |||||||||
| Size of establishment (number of employees) | Total number of situations | Percent of all situations | Cumulative percent of all situations | Number of situations | Percent by size class | Number of situations | Percent by size class | Number of situations | Percent by size class | Number of situations | Percent by size class | Number of situations | Percent by size class | Number of situations | Percent by size class | Number of situations | Percent by size class | Number of situations | Percent by size class | Number of situations | Percent by size class |
| Total | 37,497 | 100.0 | 26,006 | 100.0 | 6,666 | 100.0 | 1,536 | 100.0 | 313 | 100.0 | 93 | 100.0 | 7 | 100.0 | 435 | 100.0 | 1,876 | 100.0 | 565 | 100.0 | |
| Under 10 | 10,225 | 27.3 | 27.3 | 6,450 | 25.1 | 2,044 | 30.5 | 657 | 42.9 | 126 | 40.2 | 57 | 61.1 | 3 | 42.8 | 202 | 46.4 | 469 | 25.1 | 217 | 38.3 |
| 10–19 | 2,812 | 7.5 | 34.8 | 2,124 | 8.2 | 315 | 4.7 | 152 | 9.9 | 34 | 10.9 | 5 | 5.4 | 1 | 14.3 | 64 | 14.7 | 75 | 4.0 | 42 | 7.4 |
| 20–29 | 2,303 | 6.1 | 40.9 | 1,749 | 6.7 | 257 | 3.9 | 120 | 7.8 | 21 | 6.7 | 5 | 5.4 | 0 | 36 | 8.3 | 79 | 4.2 | 36 | 6.4 | |
| 30–39 | 1,645 | 4.4 | 45.3 | 1,198 | 4.6 | 242 | 3.6 | 75 | 4.9 | 10 | 3.2 | 3 | 3.2 | 0 | 29 | 6.7 | 62 | 3.3 | 26 | 4.6 | |
| 40–49 | 1,248 | 3.3 | 48.6 | 933 | 3.6 | 179 | 2.7 | 43 | 2.8 | 9 | 2.9 | 1 | 1.1 | 0 | 17 | 3.9 | 51 | 2.7 | 15 | 2.7 | |
| 50–59 | 1,305 | 3.5 | 52.1 | 976 | 3.8 | 179 | 2.7 | 39 | 2.5 | 12 | 3.8 | 1 | 1.1 | 0 | 16 | 3.7 | 62 | 3.3 | 20 | 3.5 | |
| 60–69 | 915 | 2.4 | 54.5 | 703 | 2.7 | 126 | 1.9 | 22 | 1.4 | 10 | 3.2 | 1 | 1.1 | 0 | 12 | 2.8 | 27 | 1.4 | 14 | 2.5 | |
| 70–79 | 759 | 2.0 | 56.5 | 594 | 2.3 | 98 | 1.5 | 15 | 1.0 | 3 | 1.0 | 0 | 0 | 3 | 0.7 | 34 | 1.8 | 12 | 2.1 | ||
| 80–89 | 565 | 1.5 | 58.0 | 455 | 1.7 | 64 | 1.0 | 9 | 0.6 | 3 | 1.0 | 1 | 1.1 | 1 | 14.3 | 3 | 0.7 | 20 | 1.1 | 9 | 1.6 |
| 90–99 | 353 | 0.9 | 58.9 | 265 | 1.0 | 62 | 0.9 | 6 | 0.4 | 0 | 1 | 1.1 | 0 | 2 | 0.5 | 13 | 0.7 | 4 | 0.7 | ||
| 100–109 | 1,424 | 3.8 | 62.7 | 918 | 3.5 | 301 | 4.5 | 76 | 4.9 | 11 | 3.5 | 2 | 2.2 | 0 | 6 | 1.4 | 88 | 4.7 | 22 | 3.9 | |
| 110–119 | 260 | 0.7 | 63.4 | 212 | 0.8 | 33 | 0.5 | 3 | 0.2 | 1 | 0.3 | 0 | 0 | 2 | 0.5 | 8 | 0.4 | 1 | 0.2 | ||
| 120–129 | 473 | 1.3 | 64.7 | 360 | 1.4 | 72 | 1.1 | 14 | 0.9 | 1 | 0.3 | 0 | 0 | 2 | 0.5 | 19 | 1.0 | 5 | 0.9 | ||
| 130–139 | 226 | 0.6 | 65.3 | 189 | 0.7 | 19 | 0.3 | 6 | 0.4 | 0 | 0 | 0 | 0 | 10 | 0.5 | 2 | 0.4 | ||||
| 140–149 | 188 | 0.5 | 65.8 | 145 | 0.6 | 22 | 0.3 | 6 | 0.4 | 3 | 1.0 | 0 | 0 | 1 | 0.2 | 7 | 0.4 | 4 | 0.7 | ||
| 150–159 | 729 | 1.9 | 67.7 | 527 | 2.0 | 126 | 1.9 | 7 | 0.5 | 4 | 1.3 | 0 | 0 | 1 | 0.2 | 57 | 3.0 | 7 | 1.2 | ||
| 160–169 | 179 | 0.5 | 68.2 | 140 | 0.5 | 25 | 0.4 | 6 | 0.4 | 1 | 0.3 | 0 | 0 | 0 | 4 | 0.2 | 3 | 0.5 | |||
| 170–179 | 221 | 0.6 | 68.8 | 176 | 0.7 | 27 | 0.4 | 4 | 0.3 | 0 | 0 | 0 | 1 | 0.2 | 12 | 0.6 | 1 | 0.2 | |||
| 180–189 | 152 | 0.4 | 69.2 | 124 | 0.5 | 18 | 0.3 | 2 | 0.1 | 0 | 0 | 0 | 0 | 4 | 0.2 | 4 | 0.7 | ||||
| 190–199 | 53 | 0.1 | 69.3 | 39 | 0.1 | 10 | 0.2 | 0 | 1 | 0.3 | 0 | 0 | 0 | 1 | 0.1 | 2 | 0.4 | ||||
| 200–299 | 2,089 | 5.6 | 74.9 | 1,489 | 5.7 | 409 | 6.1 | 45 | 2.9 | 5 | 1.6 | 4 | 4.3 | 0 | 8 | 1.8 | 113 | 6.0 | 16 | 2.8 | |
| 300–399 | 1,387 | 3.7 | 78.6 | 932 | 3.6 | 290 | 4.4 | 42 | 2.7 | 9 | 2.9 | 4 | 4.3 | 0 | 4 | 0.9 | 93 | 5.0 | 13 | 2.3 | |
| 400–499 | 823 | 2.2 | 80.8 | 572 | 2.2 | 166 | 2.5 | 20 | 1.3 | 5 | 1.6 | 0 | 0 | 1 | 0.2 | 48 | 2.6 | 11 | 1.9 | ||
| 500–599 | 764 | 2.0 | 82.8 | 505 | 1.9 | 183 | 2.7 | 17 | 1.1 | 1 | 0.3 | 0 | 0 | 3 | 0.7 | 51 | 2.7 | 4 | 0.7 | ||
| 600–699 | 473 | 1.3 | 84.1 | 346 | 1.3 | 79 | 1.2 | 6 | 0.4 | 1 | 0.3 | 0 | 0 | 1 | 0.2 | 34 | 1.8 | 6 | 1.1 | ||
| 700–799 | 308 | 0.8 | 84.9 | 212 | 0.8 | 58 | 0.9 | 8 | 0.5 | 2 | 0.6 | 0 | 0 | 1 | 0.2 | 26 | 1.4 | 1 | 0.2 | ||
| 800–899 | 296 | 0.8 | 85.7 | 205 | 0.8 | 63 | 0.9 | 5 | 0.3 | 3 | 1.0 | 0 | 1 | 14.3 | 0 | 19 | 1.0 | 0 | |||
| 900–999 | 221 | 0.6 | 86.3 | 122 | 0.5 | 53 | 0.8 | 21 | 1.4 | 4 | 1.3 | 0 | 0 | 2 | 0.5 | 13 | 0.7 | 6 | 1.1 | ||
| 1,000–1,999 | 1,585 | 4.2 | 90.5 | 1,001 | 3.8 | 411 | 6.2 | 42 | 2.7 | 10 | 3.2 | 3 | 3.2 | 0 | 7 | 1.6 | 92 | 4.9 | 19 | 3.4 | |
| 2,000–2,999 | 1,010 | 2.7 | 93.2 | 684 | 2.6 | 200 | 3.0 | 5 | 0.3 | 7 | 2.2 | 1 | 1.1 | 1 | 14.3 | 7 | 1.6 | 92 | 4.9 | 13 | 2.3 |
| 3,000–3,999 | 473 | 1.3 | 94.5 | 279 | 1.1 | 123 | 1.8 | 8 | 0.5 | 4 | 1.3 | 0 | 0 | 0 | 55 | 2.9 | 4 | 0.7 | |||
| 4,000–4,999 | 243 | 0.6 | 95.1 | 141 | 0.5 | 69 | 1.0 | 6 | 0.4 | 1 | 0.3 | 0 | 0 | 0 | 24 | 1.3 | 2 | 0.4 | |||
| 5,000–5,999 | 699 | 1.9 | 97.0 | 401 | 1.5 | 193 | 2.9 | 21 | 1.4 | 7 | 2.2 | 1 | 1.1 | 0 | 0 | 64 | 3.4 | 12 | 2.1 | ||
| Above 9,999 | 1,091 | 3.0 | 100.0 | 840 | 3.2 | 150 | 2.3 | 28 | 1.8 | 4 | 1.3 | 3 | 3.2 | 0 | 4 | 0.9 | 50 | 2.7 | 12 | 2.1 | |
- 1 See Glossary for definitions of terms.
- 2 Based on revised situation count which absorbs companion cases, cross-filing, and multiple filings as compared to situations shown in Charts 1 and 2 of Chapter 1, which are based on single and multiple filings of same type of case.
289 of 289 figures sit in a row or column sum that works out.
Reader’s notes
p. 325. 22 columns: stub, Total number of situations, Total (Percent of all situations; Cumulative percent of all situations), then paired Number/Percent columns for CA, CB, CC, CD, CE, CG, CP, CA-CB combinations, Other C combinations. Decimal points: every percentage in this 1-bit scan prints as a digit, a gap, then a digit ("100 0", "27 3"). These are decimal fractions whose period glyph has dropped out of the scan, so they are transcribed with the decimal point restored (100.0, 27.3). No other alteration was made. The restoration is self-consistent: the Percent-of-all-situations column read this way accumulates exactly to the printed Cumulative-percent column at every row and reaches 100.0 at the last row. Arithmetic check (reported, not used to alter any cell): every one of the ten count columns sums over the 34 size-class rows to exactly the figure printed in the Total row (37,497; 26,006; 6,666; 1,536; 313; 93; 7; 435; 1,876; 565), and spot-checked rows sum across to their printed row totals. No misprint detected. Size-class sequence: the row before the last is printed "5,000–5,999" and the last is "Above 9,999", leaving 6,000–9,999 unrepresented, yet the cumulative percents run 95.1 → 97.0 → 100.0 with no gap. The printed label is likely a misprint for "5,000–9,999" (the usual class in this series); it is transcribed exactly as printed. The glyph is small and I read it the same way on two passes, but this cell is the one I am least sure of. The Total row's first value carries a raised 2 printed immediately before the figure; transcribed as 37,497^2. The caption's raised 1 (on "Fiscal Year 1979") belongs to the omitted caption. Empty cells: the Total row's Cumulative-percent cell and many zero-count rows' percent cells are printed as a dash rule or left blank; all are given as "". Printed zeros in count columns are kept as 0. Footnote periods: as with the decimal points, no sentence-final period survives in the footnote type; terminal periods are written for both footnotes.
Source image
Source data: U.S. NLRB Annual Reports (public domain). Reconstruction by NLRB Stats Archive. Read by claude-opus-5 (effort max, prompt extract_v1) from the 300-dpi scan; stitched by page. Updated October 2026.