NLRB Stats Archive › Annual Reports › FY1979 › Representation elections held in cases closed, by industry
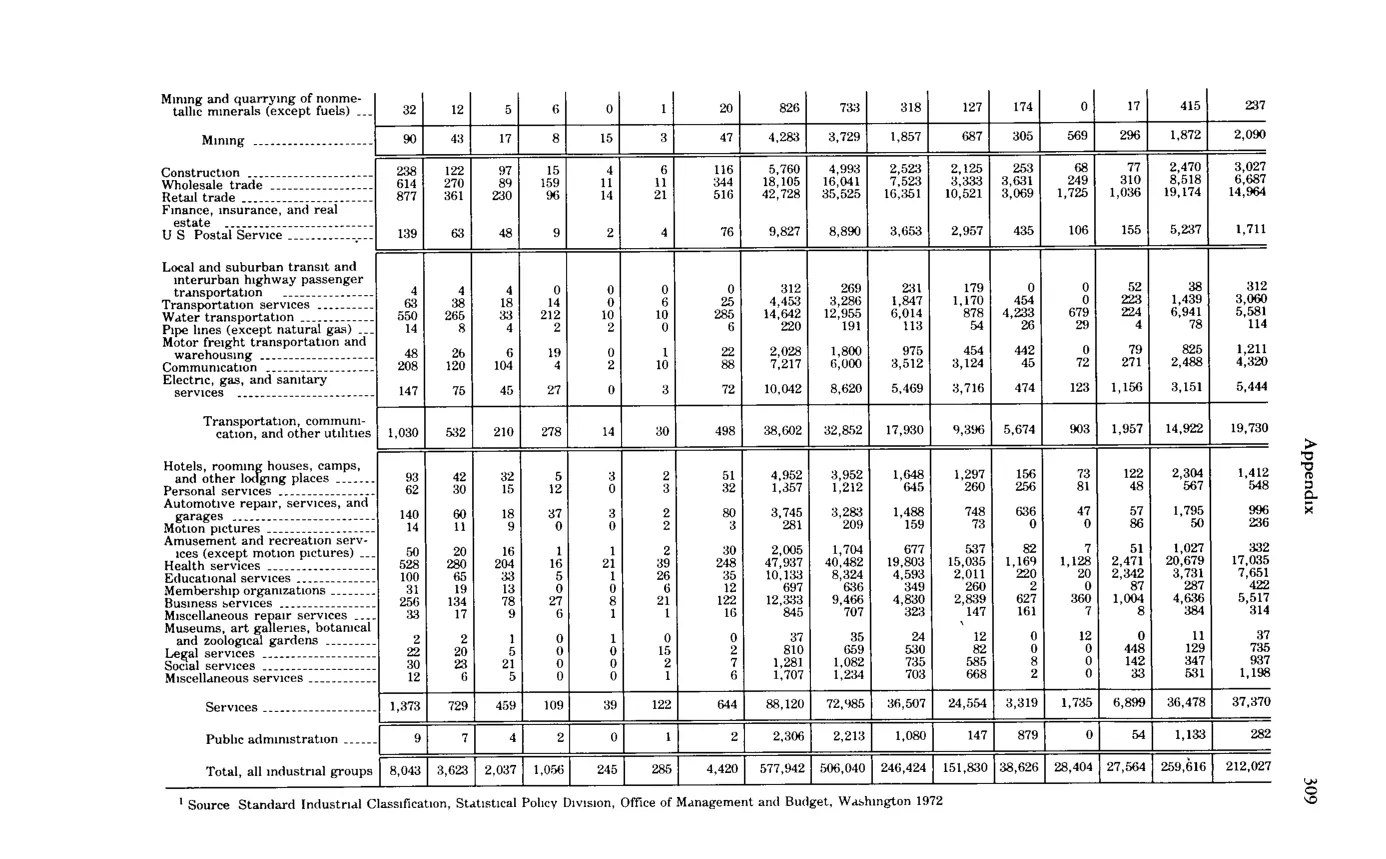
Representation elections held in cases closed, by industry
| Total elections | Won by unions — Total | Won by unions — AFL-CIO | Won by unions — Teamsters | Won by unions — Other national | Won by unions — Other local | Number of elections no representative chosen | Number of employees eligible to vote | Total valid votes cast for unions | Valid votes cast for unions — AFL-CIO | Valid votes cast for unions — Teamsters | Valid votes cast for unions — Other national | Valid votes cast for unions — Other local | Total valid votes cast against unions | Eligible employees in units choosing union representation | ||
|---|---|---|---|---|---|---|---|---|---|---|---|---|---|---|---|---|
| Mining (subtotal) | 90 | 43 | 17 | 8 | 16 | 3 | 47 | 4,283 | 3,729 | 1,557 | 854 | 305 | 569 | 1,872 | 2,090 | |
| Construction | 238 | 122 | 97 | 11 | 8 | 6 | 116 | 5,769 | 4,993 | 2,523 | 2,123 | 253 | 68 | 2,103 | 3,027 | |
| Wholesale trade | 614 | 220 | 39 | 109 | 7 | 7 | 394 | 35,148 | 18,005 | 16,041 | 7,523 | 3,335 | 5,431 | 19,174 | 14,964 | |
| Services (subtotal) | 1,375 | 729 | 459 | 109 | 112 | 82 | 644 | 88,120 | 72,985 | 36,507 | 24,564 | 3,019 | 1,755 | 6,899 | 37,170 | |
| Public administration | 2 | 1 | 1 | 2,396 | 2,219 | 1,080 | 1,139 | |||||||||
| Total, all industrial groups | 8,043 | 3,623 | 2,037 | 1,066 | 295 | 225 | 4,420 | 577,542 | 506,040 | 246,424 | 151,830 | 38,626 | 28,404 | 27,564 | 259,616 | 212,927 |
Source image
Source data: U.S. NLRB Annual Reports (public domain). Reconstruction by NLRB Stats Archive. Updated June 2026.