NLRB Stats Archive › Annual Reports › FY1979 › Geographic distribution of representation elections, by state
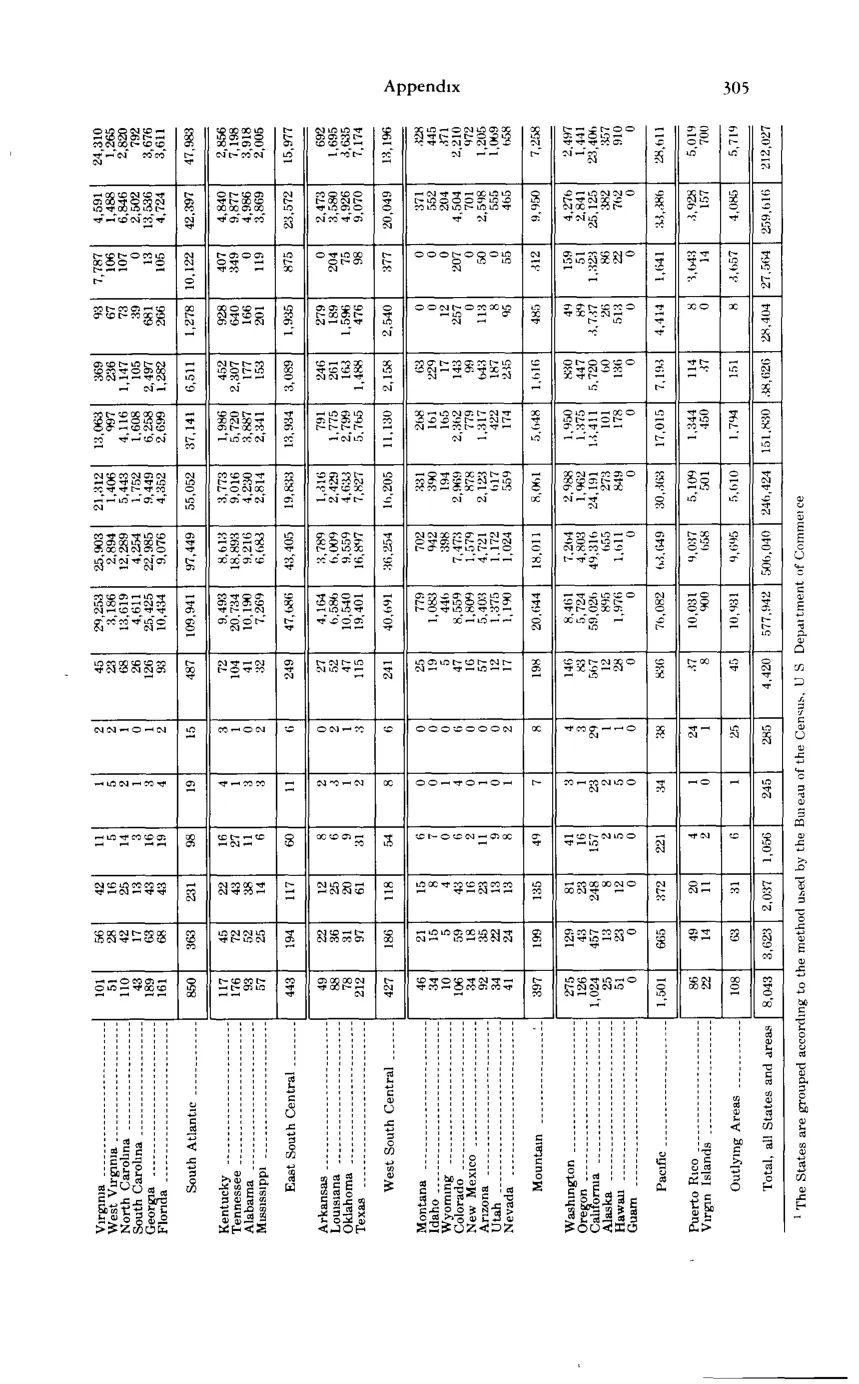
Geographic distribution of representation elections, by state
| Total elections | Won by unions — Total | Won by unions — AFL-CIO | Won by unions — Teamsters | Won by unions — Other national | Won by unions — Other local | Number of elections no representative chosen | Number of employees eligible to vote | Total valid votes cast for unions | Valid votes cast for unions — AFL-CIO | Valid votes cast for unions — Teamsters | Valid votes cast for unions — Other national | Valid votes cast for unions — Other local | Total valid votes cast against unions | Eligible employees in units showing representation results | |
|---|---|---|---|---|---|---|---|---|---|---|---|---|---|---|---|
| South Atlantic / East South Central / West South Central / Mountain / Pacific / Outlying Areas — division rows | |||||||||||||||
| Total, all States and areas | 8,043 | 3,623 | 2,037 | 1,066 | 295 | 225 | 4,420 | 577,542 | 501,500 | 234,021 | 151,930 | 26,820 | 29,041 | 259,431 | 212,627 |
Source image
Source data: U.S. NLRB Annual Reports (public domain). Reconstruction by NLRB Stats Archive. Updated June 2026.