NLRB Stats Archive › Annual Reports › FY1979 › Standard Federal Administrative Regional Distribution of Cases Received, Fiscal Year 1979
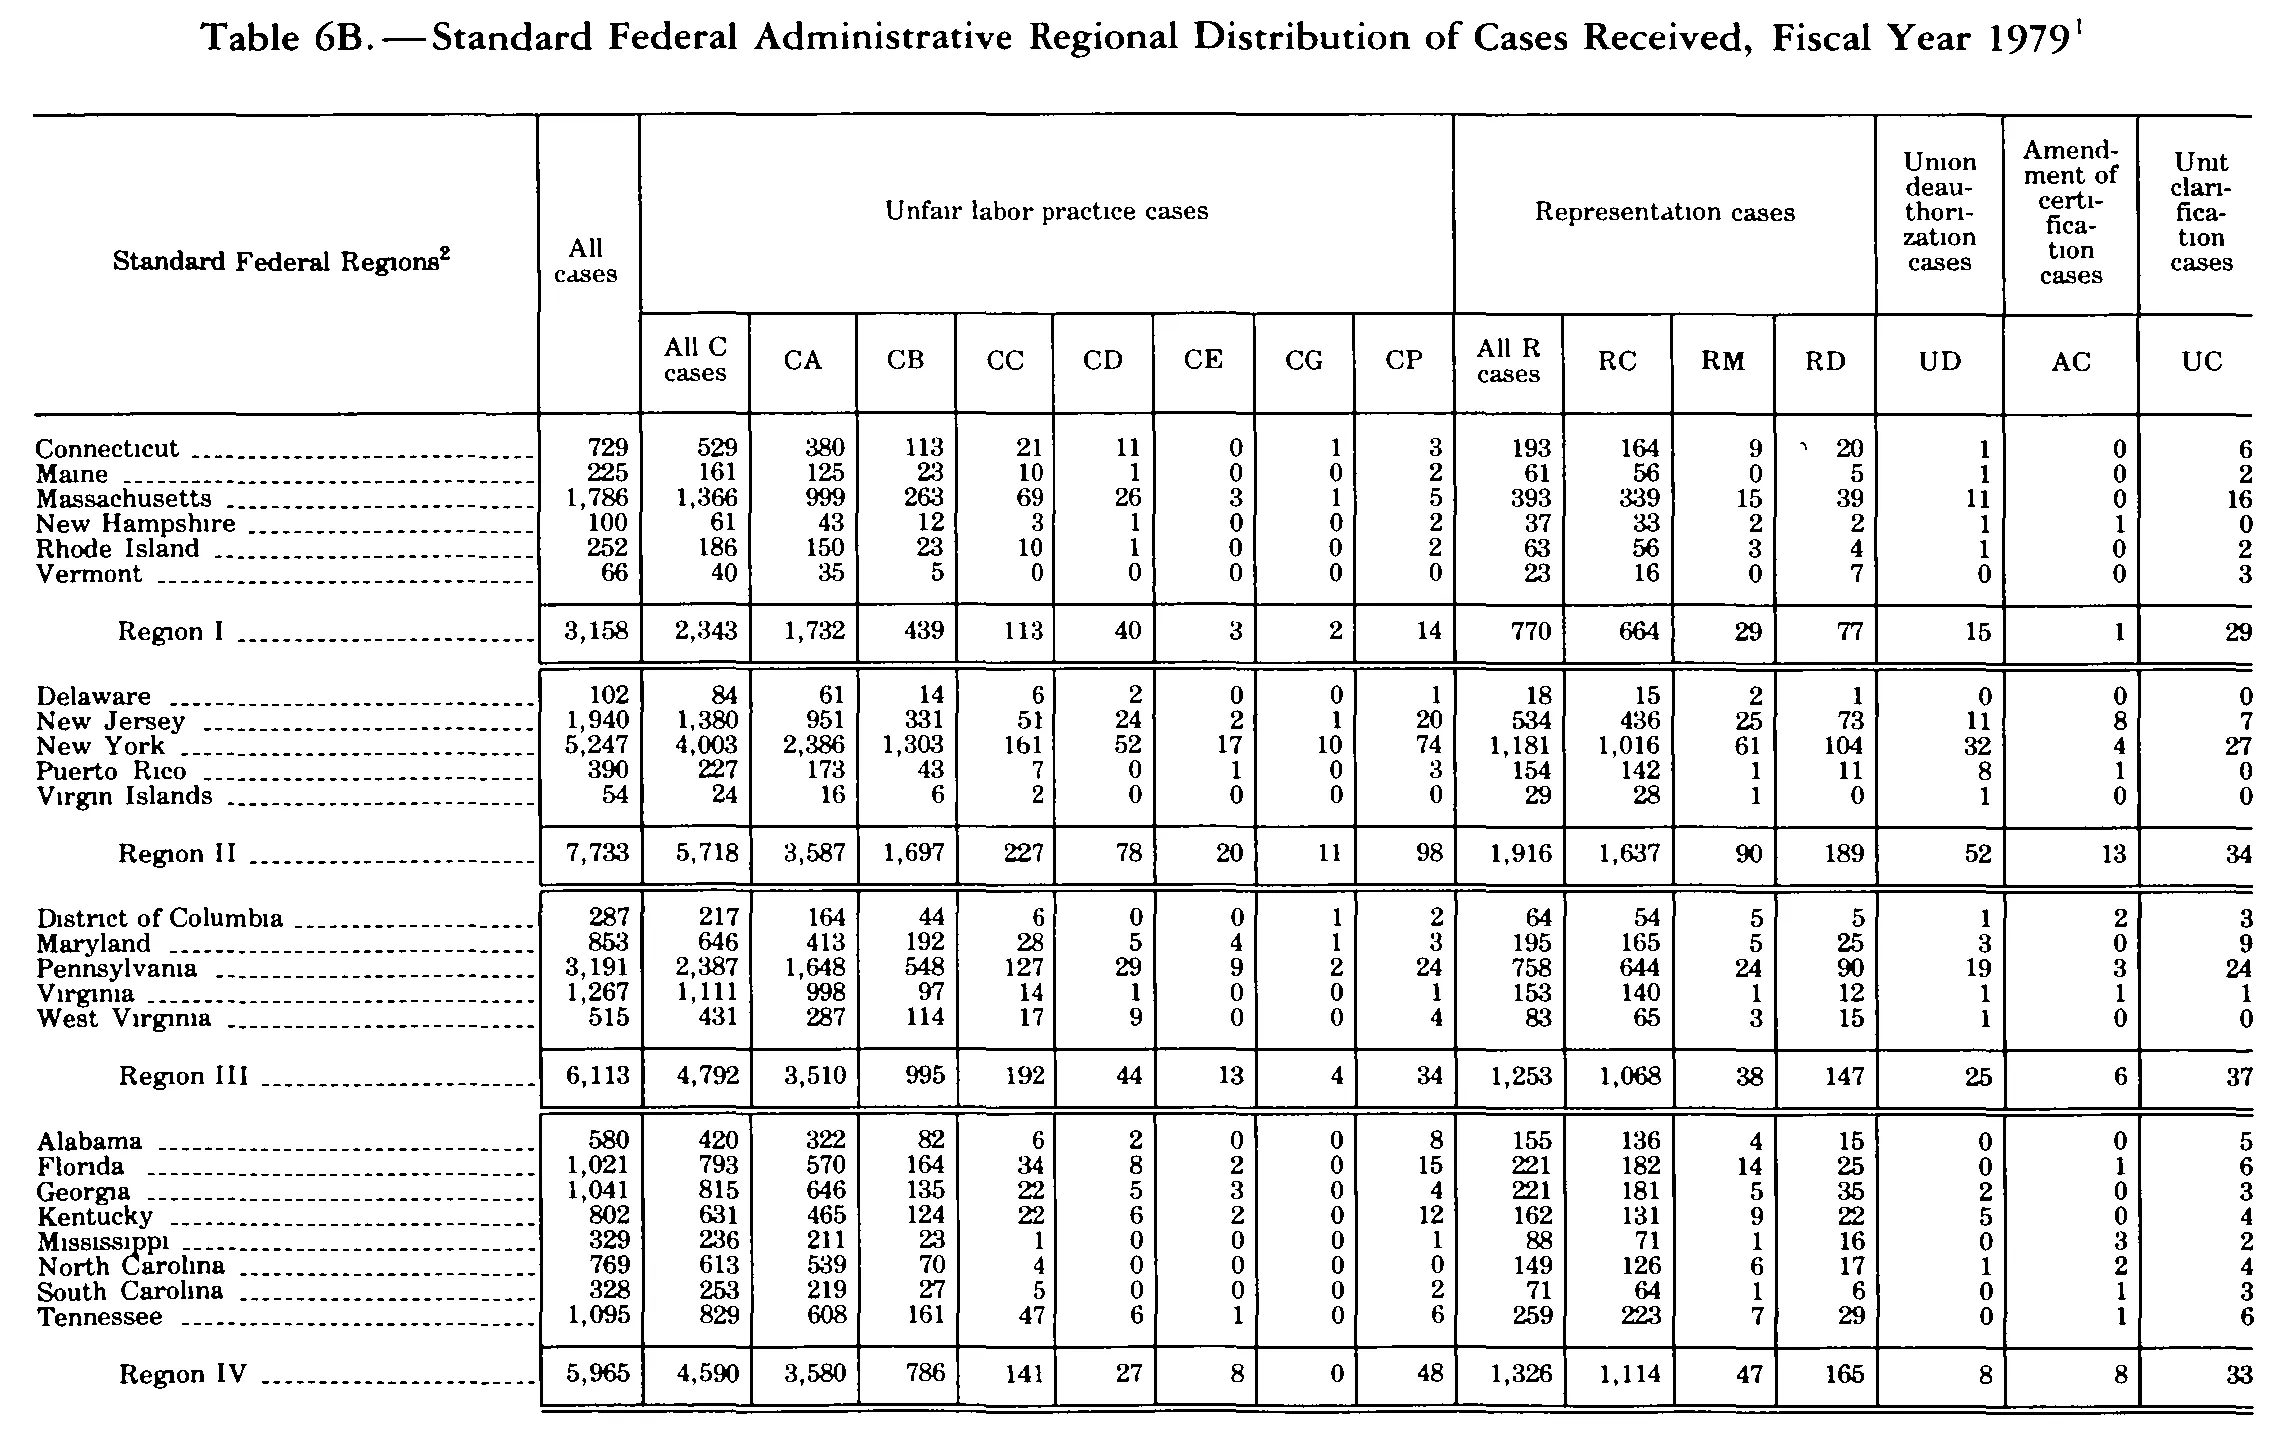
Standard Federal Administrative Regional Distribution of Cases Received, Fiscal Year 1979
Stitched from pp. 293–294.
| Standard Federal Regions | All cases | Unfair labor practice cases | Representation cases | Union deauthorization cases | Amendment of certification cases | Unit clarification cases | ||||||||||
|---|---|---|---|---|---|---|---|---|---|---|---|---|---|---|---|---|
| Standard Federal Regions | All cases | All C cases | CA | CB | CC | CD | CE | CG | CP | All R cases | RC | RM | RD | UD | AC | UC |
| Connecticut | 729 | 529 | 380 | 113 | 21 | 11 | 0 | 1 | 3 | 193 | 164 | 9 | 20 | 1 | 0 | 6 |
| Maine | 225 | 161 | 125 | 23 | 10 | 1 | 0 | 0 | 2 | 61 | 56 | 0 | 5 | 1 | 0 | 2 |
| Massachusetts | 1,786 | 1,366 | 999 | 263 | 69 | 26 | 3 | 1 | 5 | 393 | 339 | 15 | 39 | 11 | 0 | 16 |
| New Hampshire | 100 | 61 | 43 | 12 | 3 | 1 | 0 | 0 | 2 | 37 | 33 | 2 | 2 | 1 | 1 | 0 |
| Rhode Island | 252 | 186 | 150 | 23 | 10 | 1 | 0 | 0 | 2 | 63 | 56 | 3 | 4 | 1 | 0 | 2 |
| Vermont | 66 | 40 | 35 | 5 | 0 | 0 | 0 | 0 | 0 | 23 | 16 | 0 | 7 | 0 | 0 | 3 |
| Region I | 3,158 | 2,343 | 1,732 | 439 | 113 | 40 | 3 | 2 | 14 | 770 | 664 | 29 | 77 | 15 | 1 | 29 |
| Delaware | 102 | 84 | 61 | 14 | 6 | 2 | 0 | 0 | 1 | 18 | 15 | 2 | 1 | 0 | 0 | 0 |
| New Jersey | 1,940 | 1,380 | 951 | 331 | 51 | 24 | 2 | 1 | 20 | 534 | 436 | 25 | 73 | 11 | 8 | 7 |
| New York | 5,247 | 4,003 | 2,386 | 1,303 | 161 | 52 | 17 | 10 | 74 | 1,181 | 1,016 | 61 | 104 | 32 | 4 | 27 |
| Puerto Rico | 390 | 227 | 173 | 43 | 7 | 0 | 1 | 0 | 3 | 154 | 142 | 1 | 11 | 8 | 1 | 0 |
| Virgin Islands | 54 | 24 | 16 | 6 | 2 | 0 | 0 | 0 | 0 | 29 | 28 | 1 | 0 | 1 | 0 | 0 |
| Region II | 7,733 | 5,718 | 3,587 | 1,697 | 227 | 78 | 20 | 11 | 98 | 1,916 | 1,637 | 90 | 189 | 52 | 13 | 34 |
| District of Columbia | 287 | 217 | 164 | 44 | 6 | 0 | 0 | 1 | 2 | 64 | 54 | 5 | 5 | 1 | 2 | 3 |
| Maryland | 853 | 646 | 413 | 192 | 28 | 5 | 4 | 1 | 3 | 195 | 165 | 5 | 25 | 3 | 0 | 9 |
| Pennsylvania | 3,191 | 2,387 | 1,648 | 548 | 127 | 29 | 9 | 2 | 24 | 758 | 644 | 24 | 90 | 19 | 3 | 24 |
| Virginia | 1,267 | 1,111 | 998 | 97 | 14 | 1 | 0 | 0 | 1 | 153 | 140 | 1 | 12 | 1 | 1 | 1 |
| West Virginia | 515 | 431 | 287 | 114 | 17 | 9 | 0 | 0 | 4 | 83 | 65 | 3 | 15 | 1 | 0 | 0 |
| Region III | 6,113 | 4,792 | 3,510 | 995 | 192 | 44 | 13 | 4 | 34 | 1,253 | 1,068 | 38 | 147 | 25 | 6 | 37 |
| Alabama | 580 | 420 | 322 | 82 | 6 | 2 | 0 | 0 | 8 | 155 | 136 | 4 | 15 | 0 | 0 | 5 |
| Florida | 1,021 | 793 | 570 | 164 | 34 | 8 | 2 | 0 | 15 | 221 | 182 | 14 | 25 | 0 | 1 | 6 |
| Georgia | 1,041 | 815 | 646 | 135 | 22 | 5 | 3 | 0 | 4 | 221 | 181 | 5 | 35 | 2 | 0 | 3 |
| Kentucky | 802 | 631 | 465 | 124 | 22 | 6 | 2 | 0 | 12 | 162 | 131 | 9 | 22 | 5 | 0 | 4 |
| Mississippi | 329 | 236 | 211 | 23 | 1 | 0 | 0 | 0 | 1 | 88 | 71 | 1 | 16 | 0 | 3 | 2 |
| North Carolina | 769 | 613 | 539 | 70 | 4 | 0 | 0 | 0 | 0 | 149 | 126 | 6 | 17 | 1 | 2 | 4 |
| South Carolina | 328 | 253 | 219 | 27 | 5 | 0 | 0 | 0 | 2 | 71 | 64 | 1 | 6 | 0 | 1 | 3 |
| Tennessee | 1,095 | 829 | 608 | 161 | 47 | 6 | 1 | 0 | 6 | 259 | 223 | 7 | 29 | 0 | 1 | 6 |
| Region IV | 5,965 | 4,590 | 3,580 | 786 | 141 | 27 | 8 | 0 | 48 | 1,326 | 1,114 | 47 | 165 | 8 | 8 | 33 |
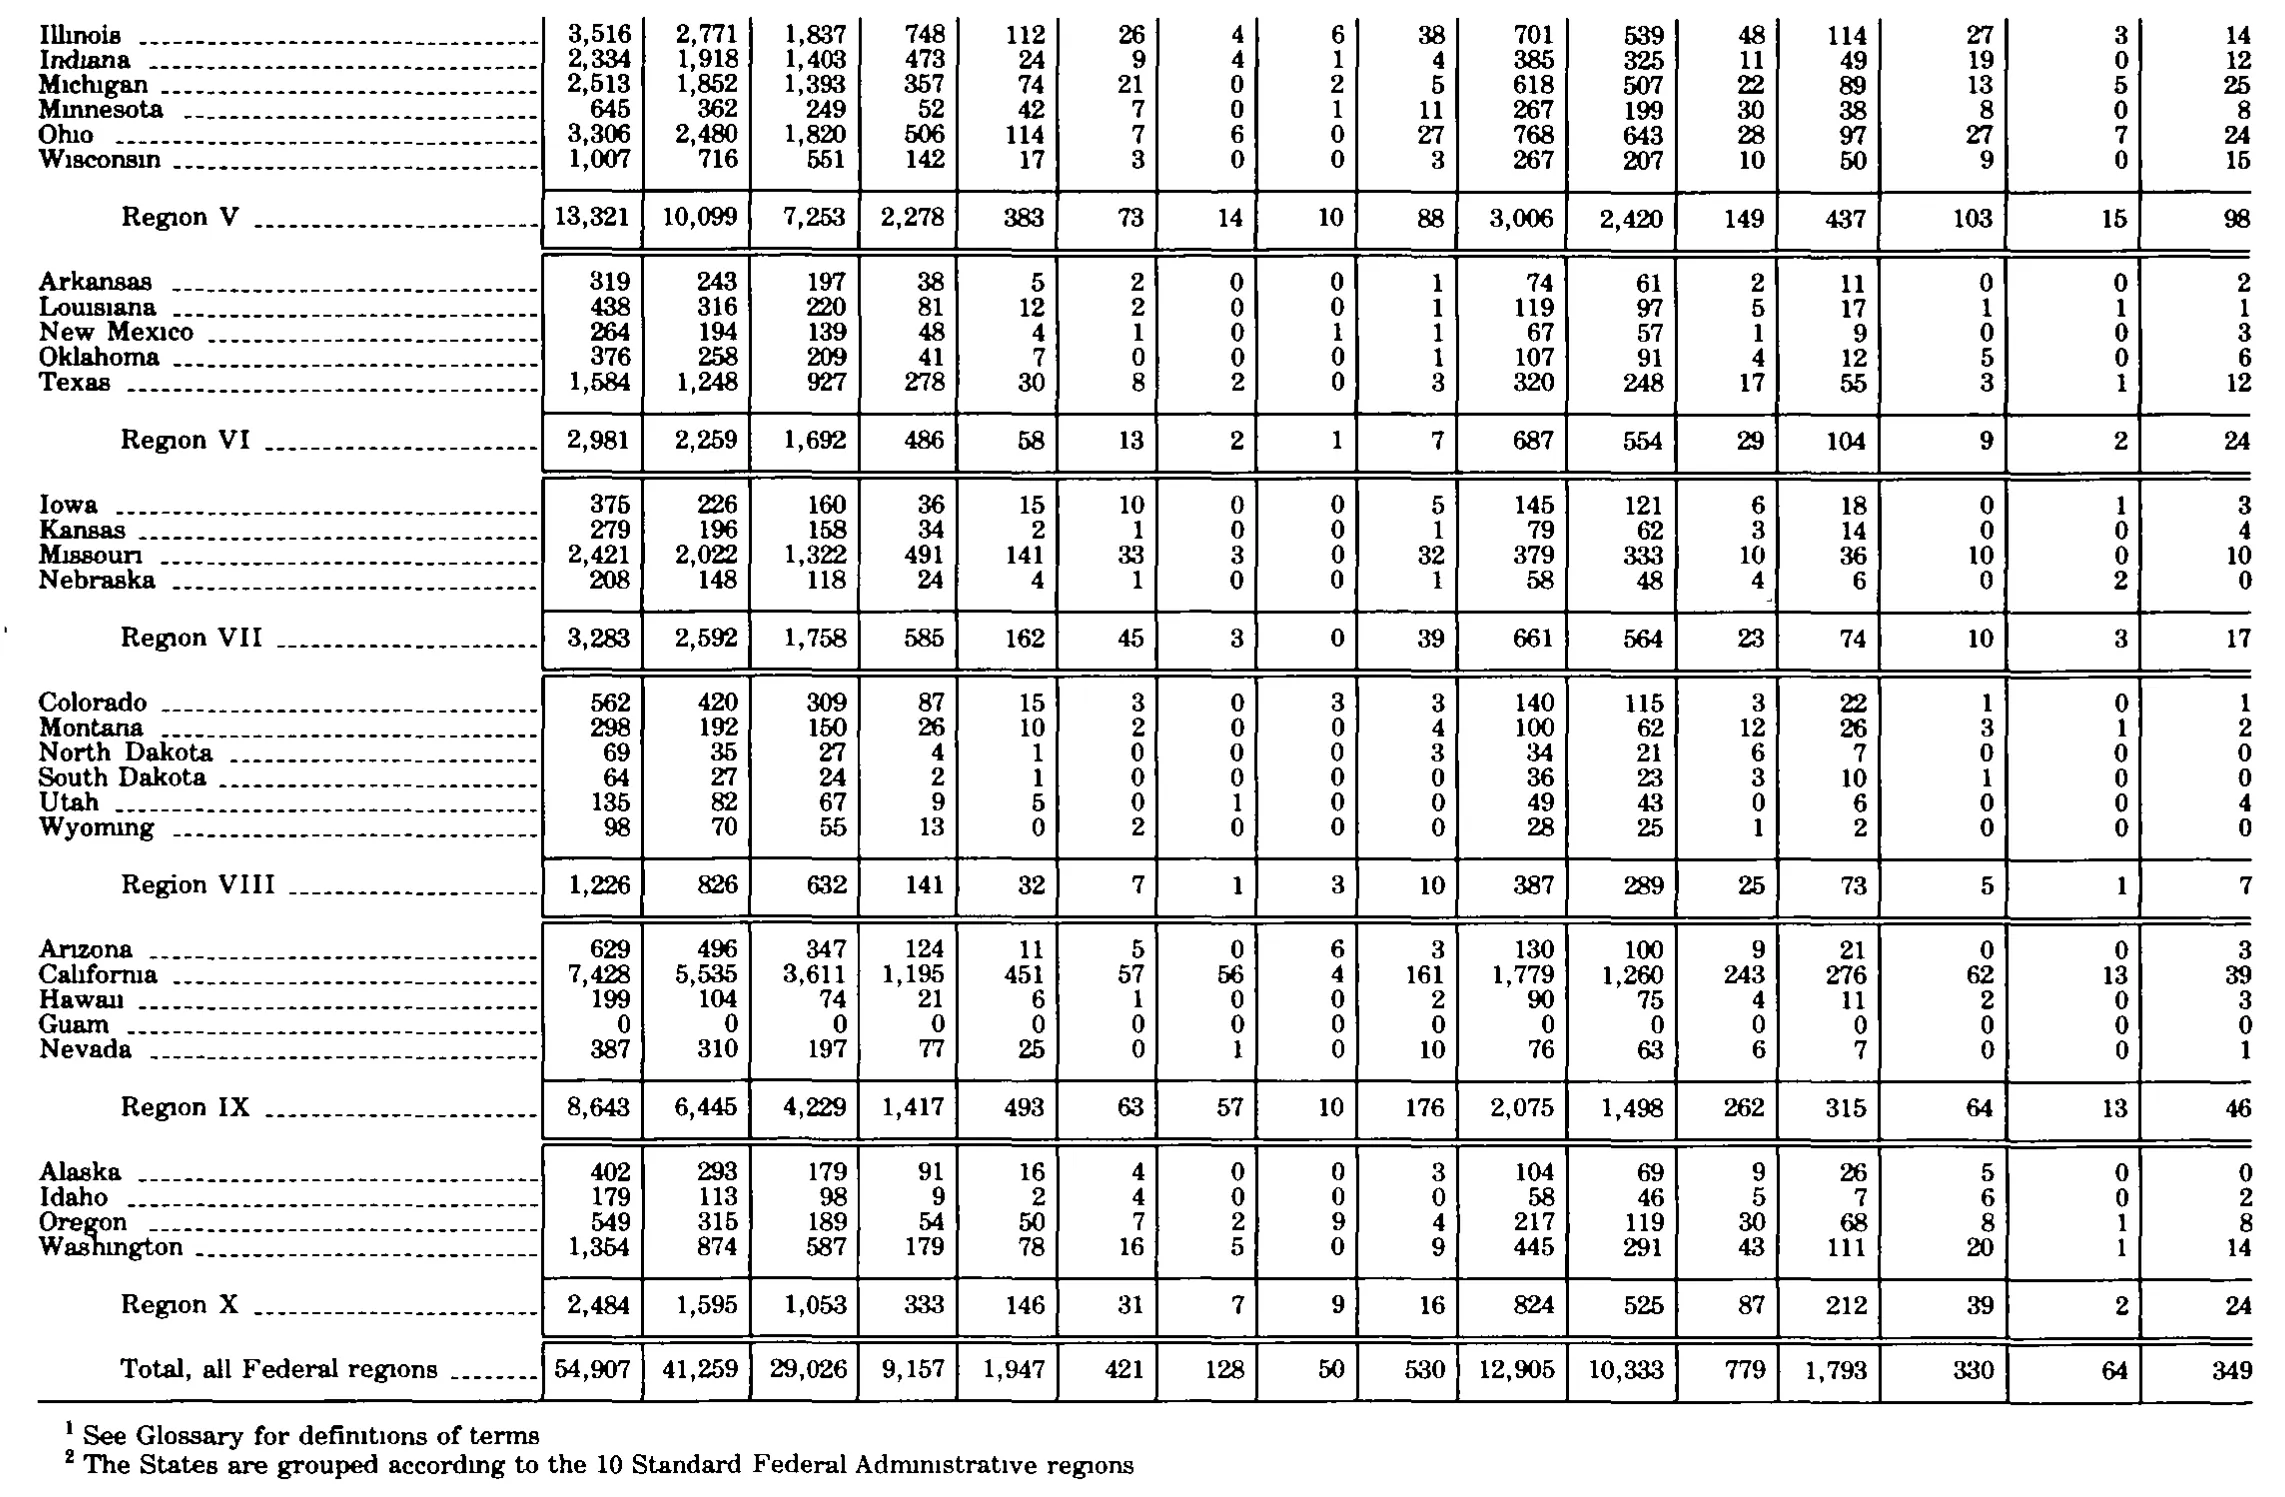
| Illinois | 3,516 | 2,771 | 1,837 | 748 | 112 | 26 | 4 | 6 | 38 | 701 | 539 | 48 | 114 | 27 | 3 | 14 |
| Indiana | 2,334 | 1,918 | 1,403 | 473 | 24 | 9 | 4 | 1 | 4 | 385 | 325 | 11 | 49 | 19 | 0 | 12 |
| Michigan | 2,513 | 1,852 | 1,393 | 357 | 74 | 21 | 0 | 2 | 5 | 618 | 507 | 22 | 89 | 13 | 5 | 25 |
| Minnesota | 645 | 362 | 249 | 52 | 42 | 7 | 0 | 1 | 11 | 267 | 199 | 30 | 38 | 8 | 0 | 8 |
| Ohio | 3,306 | 2,480 | 1,820 | 506 | 114 | 7 | 6 | 0 | 27 | 768 | 643 | 28 | 97 | 27 | 7 | 24 |
| Wisconsin | 1,007 | 716 | 551 | 142 | 17 | 3 | 0 | 0 | 3 | 267 | 207 | 10 | 50 | 9 | 0 | 15 |
| Region V | 13,321 | 10,099 | 7,253 | 2,278 | 383 | 73 | 14 | 10 | 88 | 3,006 | 2,420 | 149 | 437 | 103 | 15 | 98 |
| Arkansas | 319 | 243 | 197 | 38 | 5 | 2 | 0 | 0 | 1 | 74 | 61 | 2 | 11 | 0 | 0 | 2 |
| Louisiana | 438 | 316 | 220 | 81 | 12 | 2 | 0 | 0 | 1 | 119 | 97 | 5 | 17 | 1 | 1 | 1 |
| New Mexico | 264 | 194 | 139 | 48 | 4 | 1 | 0 | 1 | 1 | 67 | 57 | 1 | 9 | 0 | 0 | 3 |
| Oklahoma | 376 | 258 | 209 | 41 | 7 | 0 | 0 | 0 | 1 | 107 | 91 | 4 | 12 | 5 | 0 | 6 |
| Texas | 1,584 | 1,248 | 927 | 278 | 30 | 8 | 2 | 0 | 3 | 320 | 248 | 17 | 55 | 3 | 1 | 12 |
| Region VI | 2,981 | 2,259 | 1,692 | 486 | 58 | 13 | 2 | 1 | 7 | 687 | 554 | 29 | 104 | 9 | 2 | 24 |
| Iowa | 375 | 226 | 160 | 36 | 15 | 10 | 0 | 0 | 5 | 145 | 121 | 6 | 18 | 0 | 1 | 3 |
| Kansas | 279 | 196 | 158 | 34 | 2 | 1 | 0 | 0 | 1 | 79 | 62 | 3 | 14 | 0 | 0 | 4 |
| Missouri | 2,421 | 2,022 | 1,322 | 491 | 141 | 33 | 3 | 0 | 32 | 379 | 333 | 10 | 36 | 10 | 0 | 10 |
| Nebraska | 208 | 148 | 118 | 24 | 4 | 1 | 0 | 0 | 1 | 58 | 48 | 4 | 6 | 0 | 2 | 0 |
| Region VII | 3,283 | 2,592 | 1,758 | 585 | 162 | 45 | 3 | 0 | 39 | 661 | 564 | 23 | 74 | 10 | 3 | 17 |
| Colorado | 562 | 420 | 309 | 87 | 15 | 3 | 0 | 3 | 3 | 140 | 115 | 3 | 22 | 1 | 0 | 1 |
| Montana | 298 | 192 | 150 | 26 | 10 | 2 | 0 | 0 | 4 | 100 | 62 | 12 | 26 | 3 | 1 | 2 |
| North Dakota | 69 | 35 | 27 | 4 | 1 | 0 | 0 | 0 | 3 | 34 | 21 | 6 | 7 | 0 | 0 | 0 |
| South Dakota | 64 | 27 | 24 | 2 | 1 | 0 | 0 | 0 | 0 | 36 | 23 | 3 | 10 | 1 | 0 | 0 |
| Utah | 135 | 82 | 67 | 9 | 5 | 0 | 1 | 0 | 0 | 49 | 43 | 0 | 6 | 0 | 0 | 4 |
| Wyoming | 98 | 70 | 55 | 13 | 0 | 2 | 0 | 0 | 0 | 28 | 25 | 1 | 2 | 0 | 0 | 0 |
| Region VIII | 1,226 | 826 | 632 | 141 | 32 | 7 | 1 | 3 | 10 | 387 | 289 | 25 | 73 | 5 | 1 | 7 |
| Arizona | 629 | 496 | 347 | 124 | 11 | 5 | 0 | 6 | 3 | 130 | 100 | 9 | 21 | 0 | 0 | 3 |
| California | 7,428 | 5,535 | 3,611 | 1,195 | 451 | 57 | 56 | 4 | 161 | 1,779 | 1,260 | 243 | 276 | 62 | 13 | 39 |
| Hawaii | 199 | 104 | 74 | 21 | 6 | 1 | 0 | 0 | 2 | 90 | 75 | 4 | 11 | 2 | 0 | 3 |
| Guam | 0 | 0 | 0 | 0 | 0 | 0 | 0 | 0 | 0 | 0 | 0 | 0 | 0 | 0 | 0 | 0 |
| Nevada | 387 | 310 | 197 | 77 | 25 | 0 | 1 | 0 | 10 | 76 | 63 | 6 | 7 | 0 | 0 | 1 |
| Region IX | 8,643 | 6,445 | 4,229 | 1,417 | 493 | 63 | 57 | 10 | 176 | 2,075 | 1,498 | 262 | 315 | 64 | 13 | 46 |
| Alaska | 402 | 293 | 179 | 91 | 16 | 4 | 0 | 0 | 3 | 104 | 69 | 9 | 26 | 5 | 0 | 0 |
| Idaho | 179 | 113 | 98 | 9 | 2 | 4 | 0 | 0 | 0 | 58 | 46 | 5 | 7 | 6 | 0 | 2 |
| Oregon | 549 | 315 | 189 | 54 | 50 | 7 | 2 | 9 | 4 | 217 | 119 | 30 | 68 | 8 | 1 | 8 |
| Washington | 1,354 | 874 | 587 | 179 | 78 | 16 | 5 | 0 | 9 | 445 | 291 | 43 | 111 | 20 | 1 | 14 |
| Region X | 2,484 | 1,595 | 1,053 | 333 | 146 | 31 | 7 | 9 | 16 | 824 | 525 | 87 | 212 | 39 | 2 | 24 |
| Total, all Federal regions | 54,907 | 41,259 | 29,026 | 9,157 | 1,947 | 421 | 128 | 50 | 530 | 12,905 | 10,333 | 779 | 1,793 | 330 | 64 | 349 |
- 1 See Glossary for definitions of terms
- 2 The States are grouped according to the 10 Standard Federal Administrative regions
870 of 870 figures sit in a row or column sum that works out.
Reader’s notes
p. 293. The crop ends after the Region IV subtotal; the table continues (Regions V onward) on the following page, and no footnote texts are printed on this image even though markers appear in the caption ("Fiscal Year 1979^1") and in the stub heading ("Standard Federal Regions^2") — the footnote for marker 2 is recorded in the stub heading cell, marker 1 belongs to the omitted caption. Spanner headings read as printed with end-of-line hyphens repaired: "Union deau-thori-zation cases" = "Union deauthorization cases"; "Amend-ment of certi-fica-tion cases" = "Amendment of certification cases"; "Unit clari-fica-tion cases" = "Unit clarification cases". Doubtful glyphs, all resolved by arithmetic: (a) New Jersey, CC column, printed with a damaged second digit that looks like "5l" — read as 51, which is what the Region II CC subtotal (227) requires; (b) Connecticut, RD column, has a stray ink tick to the left of the figure (not a footnote marker or a digit) — read as 20, consistent with Connecticut's All R cases 193 and the Region I RD subtotal 77. Every printed figure reconciles: for each state row the C-type columns sum to "All C cases", the R-type columns sum to "All R cases", and All C + All R + UD + AC + UC equals "All cases"; each of the four region rows equals the column sum of its member states. No misprints found.
p. 294. This crop is the continuation (second) page of the table: no column headings are printed on it, so header_rows is empty. The grid has 17 columns (stub plus 16 numeric columns), counted from the column rules and confirmed on every body row. The crop begins mid-table with the member States of Region V; Regions I-IV and the caption/headings are on the preceding page, which is not shown. Verification: for each of the six region subtotal rows shown (Region V, VI, VII, VIII, IX, X), the member-State values sum exactly to the printed subtotal in all 16 numeric columns, so the column assignment and the digits are internally consistent. The grand total row cannot be checked here because Regions I-IV fall outside the crop. No footnote markers appear on any row label or value in this crop; the two footnotes refer to text on the preceding page. A small stray ink mark sits in the left margin beside the Region VII subtotal row; it is not a footnote marker and is not transcribed. Footnote 1 and footnote 2 are printed without terminal periods, as transcribed. The Guam row is printed as all zeros, which is as shown and not a blank row.
Source image
Source data: U.S. NLRB Annual Reports (public domain). Reconstruction by NLRB Stats Archive. Read by claude-opus-5 (effort max, prompt extract_v1) from the 300-dpi scan; stitched by page. Updated October 2026.