NLRB Stats Archive › Annual Reports › FY1979 › Geographic Distribution of Cases Received, Fiscal Year 1979
Geographic Distribution of Cases Received, Fiscal Year 1979
Stitched from pp. 291–292.
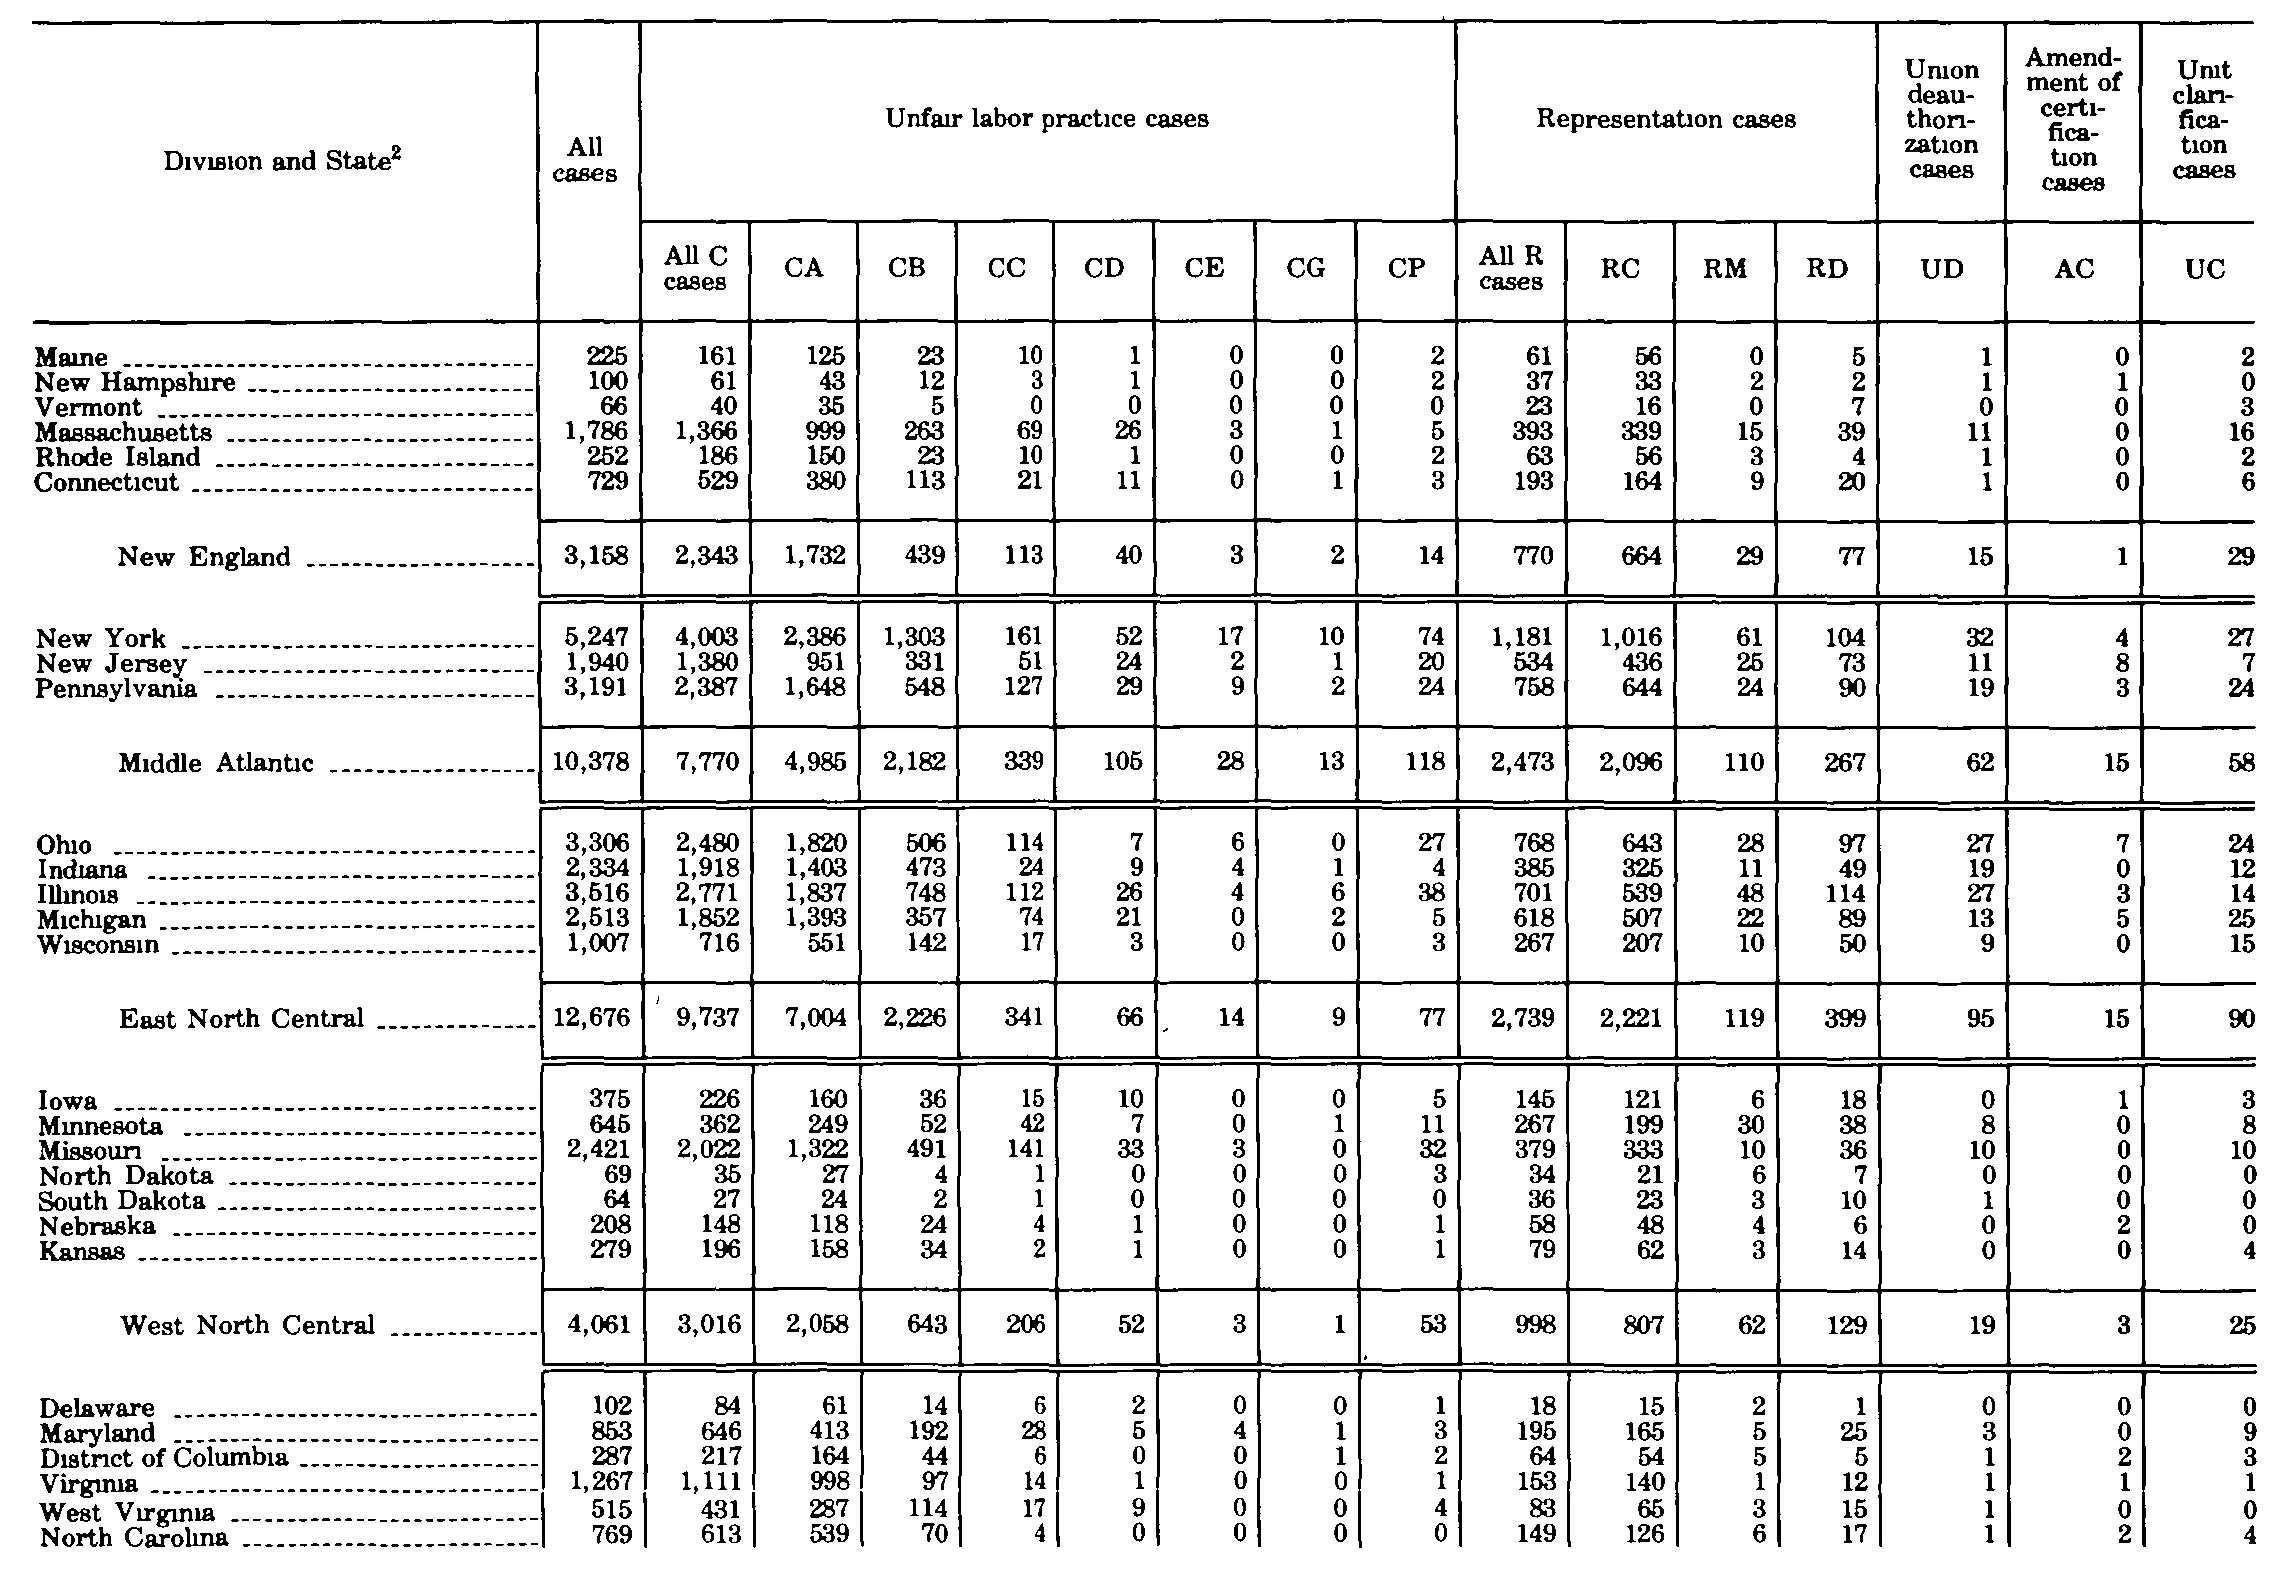
| Division and State | All cases | Unfair labor practice cases | Representation cases | Union deauthorization cases | Amendment of certification cases | Unit clarification cases | ||||||||||
|---|---|---|---|---|---|---|---|---|---|---|---|---|---|---|---|---|
| Division and State | All cases | All C cases | CA | CB | CC | CD | CE | CG | CP | All R cases | RC | RM | RD | UD | AC | UC |
| Maine | 225 | 161 | 125 | 23 | 10 | 1 | 0 | 0 | 2 | 61 | 56 | 0 | 5 | 1 | 0 | 2 |
| New Hampshire | 100 | 61 | 43 | 12 | 3 | 1 | 0 | 0 | 2 | 37 | 33 | 2 | 2 | 1 | 1 | 0 |
| Vermont | 66 | 40 | 35 | 5 | 0 | 0 | 0 | 0 | 0 | 23 | 16 | 0 | 7 | 0 | 0 | 3 |
| Massachusetts | 1,786 | 1,366 | 999 | 263 | 69 | 26 | 3 | 1 | 5 | 393 | 339 | 15 | 39 | 11 | 0 | 16 |
| Rhode Island | 252 | 186 | 150 | 23 | 10 | 1 | 0 | 0 | 2 | 63 | 56 | 3 | 4 | 1 | 0 | 2 |
| Connecticut | 729 | 529 | 380 | 113 | 21 | 11 | 0 | 1 | 3 | 193 | 164 | 9 | 20 | 1 | 0 | 6 |
| New England | 3,158 | 2,343 | 1,732 | 439 | 113 | 40 | 3 | 2 | 14 | 770 | 664 | 29 | 77 | 15 | 1 | 29 |
| New York | 5,247 | 4,003 | 2,386 | 1,303 | 161 | 52 | 17 | 10 | 74 | 1,181 | 1,016 | 61 | 104 | 32 | 4 | 27 |
| New Jersey | 1,940 | 1,380 | 951 | 331 | 51 | 24 | 2 | 1 | 20 | 534 | 436 | 25 | 73 | 11 | 8 | 7 |
| Pennsylvania | 3,191 | 2,387 | 1,648 | 548 | 127 | 29 | 9 | 2 | 24 | 758 | 644 | 24 | 90 | 19 | 3 | 24 |
| Middle Atlantic | 10,378 | 7,770 | 4,985 | 2,182 | 339 | 105 | 28 | 13 | 118 | 2,473 | 2,096 | 110 | 267 | 62 | 15 | 58 |
| Ohio | 3,306 | 2,480 | 1,820 | 506 | 114 | 7 | 6 | 0 | 27 | 768 | 643 | 28 | 97 | 27 | 7 | 24 |
| Indiana | 2,334 | 1,918 | 1,403 | 473 | 24 | 9 | 4 | 1 | 4 | 385 | 325 | 11 | 49 | 19 | 0 | 12 |
| Illinois | 3,516 | 2,771 | 1,837 | 748 | 112 | 26 | 4 | 6 | 38 | 701 | 539 | 48 | 114 | 27 | 3 | 14 |
| Michigan | 2,513 | 1,852 | 1,393 | 357 | 74 | 21 | 0 | 2 | 5 | 618 | 507 | 22 | 89 | 13 | 5 | 25 |
| Wisconsin | 1,007 | 716 | 551 | 142 | 17 | 3 | 0 | 0 | 3 | 267 | 207 | 10 | 50 | 9 | 0 | 15 |
| East North Central | 12,676 | 9,737 | 7,004 | 2,226 | 341 | 66 | 14 | 9 | 77 | 2,739 | 2,221 | 119 | 399 | 95 | 15 | 90 |
| Iowa | 375 | 226 | 160 | 36 | 15 | 10 | 0 | 0 | 5 | 145 | 121 | 6 | 18 | 0 | 1 | 3 |
| Minnesota | 645 | 362 | 249 | 52 | 42 | 7 | 0 | 1 | 11 | 267 | 199 | 30 | 38 | 8 | 0 | 8 |
| Missouri | 2,421 | 2,022 | 1,322 | 491 | 141 | 33 | 3 | 0 | 32 | 379 | 333 | 10 | 36 | 10 | 0 | 10 |
| North Dakota | 69 | 35 | 27 | 4 | 1 | 0 | 0 | 0 | 3 | 34 | 21 | 6 | 7 | 0 | 0 | 0 |
| South Dakota | 64 | 27 | 24 | 2 | 1 | 0 | 0 | 0 | 0 | 36 | 23 | 3 | 10 | 1 | 0 | 0 |
| Nebraska | 208 | 148 | 118 | 24 | 4 | 1 | 0 | 0 | 1 | 58 | 48 | 4 | 6 | 0 | 2 | 0 |
| Kansas | 279 | 196 | 158 | 34 | 2 | 1 | 0 | 0 | 1 | 79 | 62 | 3 | 14 | 0 | 0 | 4 |
| West North Central | 4,061 | 3,016 | 2,058 | 643 | 206 | 52 | 3 | 1 | 53 | 998 | 807 | 62 | 129 | 19 | 3 | 25 |
| Delaware | 102 | 84 | 61 | 14 | 6 | 2 | 0 | 0 | 1 | 18 | 15 | 2 | 1 | 0 | 0 | 0 |
| Maryland | 853 | 646 | 413 | 192 | 28 | 5 | 4 | 1 | 3 | 195 | 165 | 5 | 25 | 3 | 0 | 9 |
| District of Columbia | 287 | 217 | 164 | 44 | 6 | 0 | 0 | 1 | 2 | 64 | 54 | 5 | 5 | 1 | 2 | 3 |
| Virginia | 1,267 | 1,111 | 998 | 97 | 14 | 1 | 0 | 0 | 1 | 153 | 140 | 1 | 12 | 1 | 1 | 1 |
| West Virginia | 515 | 431 | 287 | 114 | 17 | 9 | 0 | 0 | 4 | 83 | 65 | 3 | 15 | 1 | 0 | 0 |
| North Carolina | 769 | 613 | 539 | 70 | 4 | 0 | 0 | 0 | 0 | 149 | 126 | 6 | 17 | 1 | 2 | 4 |
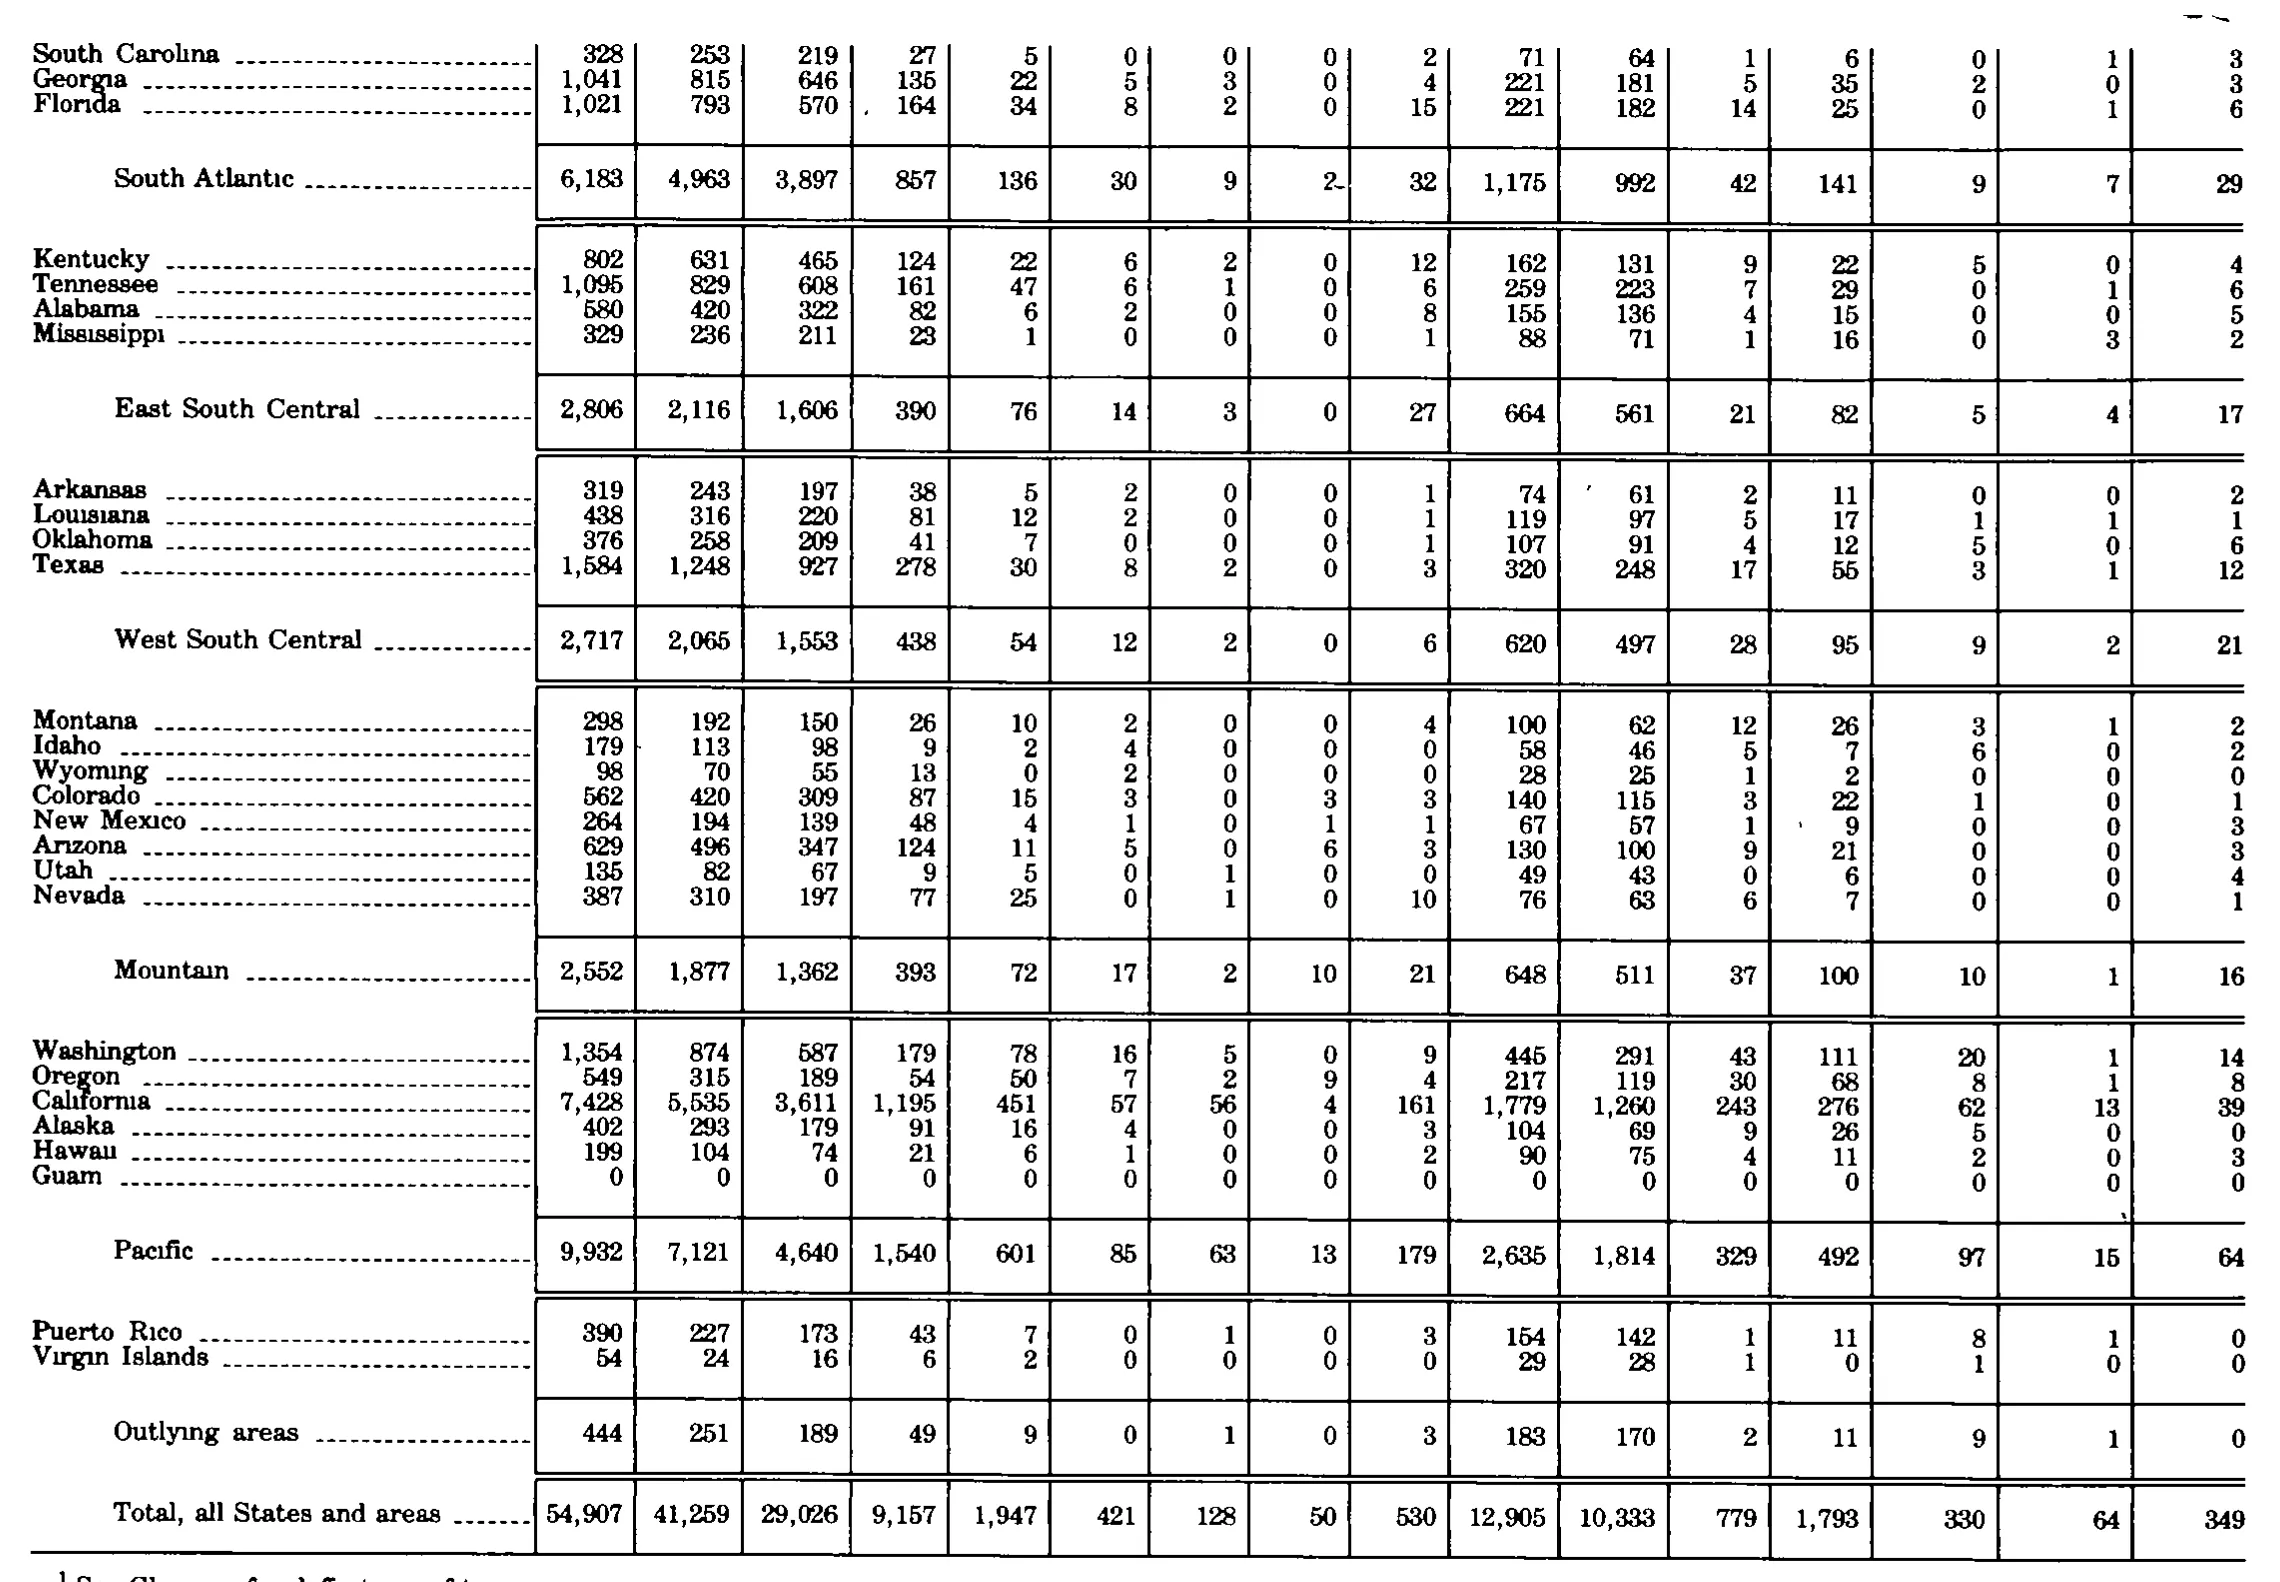
| South Carolina | 328 | 253 | 219 | 27 | 5 | 0 | 0 | 0 | 2 | 71 | 64 | 1 | 6 | 0 | 1 | 3 |
| Georgia | 1,041 | 815 | 646 | 135 | 22 | 5 | 3 | 0 | 4 | 221 | 181 | 5 | 35 | 2 | 0 | 3 |
| Florida | 1,021 | 793 | 570 | 164 | 34 | 8 | 2 | 0 | 15 | 221 | 182 | 14 | 25 | 0 | 1 | 6 |
| South Atlantic | 6,183 | 4,963 | 3,897 | 857 | 136 | 30 | 9 | 2 | 32 | 1,175 | 992 | 42 | 141 | 9 | 7 | 29 |
| Kentucky | 802 | 631 | 465 | 124 | 22 | 6 | 2 | 0 | 12 | 162 | 131 | 9 | 22 | 5 | 0 | 4 |
| Tennessee | 1,095 | 829 | 608 | 161 | 47 | 6 | 1 | 0 | 6 | 259 | 223 | 7 | 29 | 5 | 1 | 6 |
| Alabama | 580 | 420 | 322 | 82 | 6 | 2 | 0 | 0 | 8 | 155 | 136 | 4 | 15 | 0 | 0 | 5 |
| Mississippi | 329 | 236 | 211 | 23 | 1 | 0 | 0 | 0 | 1 | 88 | 71 | 1 | 16 | 0 | 3 | 2 |
| East South Central | 2,806 | 2,116 | 1,606 | 390 | 76 | 14 | 3 | 0 | 27 | 664 | 561 | 21 | 82 | 5 | 4 | 17 |
| Arkansas | 319 | 243 | 197 | 38 | 5 | 2 | 0 | 0 | 1 | 74 | 61 | 2 | 11 | 0 | 0 | 2 |
| Louisiana | 438 | 316 | 220 | 81 | 12 | 2 | 0 | 0 | 1 | 119 | 97 | 5 | 17 | 1 | 1 | 1 |
| Oklahoma | 376 | 258 | 209 | 41 | 7 | 0 | 0 | 0 | 1 | 107 | 91 | 4 | 12 | 5 | 0 | 6 |
| Texas | 1,584 | 1,248 | 927 | 278 | 30 | 8 | 2 | 0 | 3 | 320 | 248 | 17 | 55 | 3 | 1 | 12 |
| West South Central | 2,717 | 2,065 | 1,553 | 438 | 54 | 12 | 2 | 0 | 6 | 620 | 497 | 28 | 95 | 9 | 2 | 21 |
| Montana | 298 | 192 | 150 | 26 | 10 | 2 | 0 | 0 | 4 | 100 | 62 | 12 | 26 | 3 | 1 | 2 |
| Idaho | 179 | 113 | 98 | 9 | 2 | 4 | 0 | 0 | 0 | 58 | 46 | 5 | 7 | 6 | 0 | 2 |
| Wyoming | 98 | 70 | 55 | 13 | 0 | 2 | 0 | 0 | 0 | 28 | 25 | 1 | 2 | 0 | 0 | 0 |
| Colorado | 562 | 420 | 309 | 87 | 15 | 3 | 0 | 3 | 3 | 140 | 115 | 3 | 22 | 1 | 0 | 1 |
| New Mexico | 264 | 194 | 139 | 48 | 4 | 1 | 0 | 1 | 1 | 67 | 57 | 1 | 9 | 0 | 0 | 3 |
| Arizona | 629 | 496 | 347 | 124 | 11 | 5 | 0 | 6 | 3 | 130 | 100 | 9 | 21 | 0 | 0 | 3 |
| Utah | 135 | 82 | 67 | 9 | 5 | 0 | 1 | 0 | 0 | 49 | 43 | 0 | 6 | 0 | 0 | 4 |
| Nevada | 387 | 310 | 197 | 77 | 25 | 0 | 1 | 0 | 10 | 76 | 63 | 6 | 7 | 0 | 0 | 1 |
| Mountain | 2,552 | 1,877 | 1,362 | 393 | 72 | 17 | 2 | 10 | 21 | 648 | 511 | 37 | 100 | 10 | 1 | 16 |
| Washington | 1,354 | 874 | 587 | 179 | 78 | 16 | 5 | 0 | 9 | 445 | 291 | 43 | 111 | 20 | 1 | 14 |
| Oregon | 549 | 315 | 189 | 54 | 50 | 7 | 2 | 9 | 4 | 217 | 119 | 30 | 68 | 8 | 1 | 8 |
| California | 7,428 | 5,535 | 3,611 | 1,195 | 451 | 57 | 56 | 4 | 161 | 1,779 | 1,260 | 243 | 276 | 62 | 13 | 39 |
| Alaska | 402 | 293 | 179 | 91 | 16 | 4 | 0 | 0 | 3 | 104 | 69 | 9 | 26 | 5 | 0 | 0 |
| Hawaii | 199 | 104 | 74 | 21 | 6 | 1 | 0 | 0 | 2 | 90 | 75 | 4 | 11 | 2 | 0 | 3 |
| Guam | 0 | 0 | 0 | 0 | 0 | 0 | 0 | 0 | 0 | 0 | 0 | 0 | 0 | 0 | 0 | 0 |
| Pacific | 9,932 | 7,121 | 4,640 | 1,540 | 601 | 85 | 63 | 13 | 179 | 2,635 | 1,814 | 329 | 492 | 97 | 15 | 64 |
| Puerto Rico | 390 | 227 | 173 | 43 | 7 | 0 | 1 | 0 | 3 | 154 | 142 | 1 | 11 | 8 | 1 | 0 |
| Virgin Islands | 54 | 24 | 16 | 6 | 2 | 0 | 0 | 0 | 0 | 29 | 28 | 1 | 0 | 1 | 0 | 0 |
| Outlying areas | 444 | 251 | 189 | 49 | 9 | 0 | 1 | 0 | 3 | 183 | 170 | 2 | 11 | 9 | 1 | 0 |
| Total, all States and areas | 54,907 | 41,259 | 29,026 | 9,157 | 1,947 | 421 | 128 | 50 | 530 | 12,905 | 10,333 | 779 | 1,793 | 330 | 64 | 349 |
- 1 See Glossary for definitions of terms.
867 of 868 figures sit in a row or column sum that works out. 2 cells break a sum: 'Tennessee', column 2: prints 1,095, the subtotals in columns 3 to 17 add to 1,100; 'East South Central', column 15: prints 5, rows 'Kentucky' to 'Mississippi' add to 10.
Reader’s notes
p. 291. The crop is cut off at the bottom: the table continues past "North Carolina" (the South Atlantic group has no total row on this image, and later divisions are absent). No footnote texts appear on this crop, although the stub heading carries a raised "2" marker ("Division and State^2") whose text must be printed elsewhere. The regional total lines (New England, Middle Atlantic, East North Central, West North Central) are printed indented and set off by rules; they are transcribed as ordinary rows in place. Blank spacing bands between groups are not transcribed as rows. Arithmetic cross-checks all pass as printed, which supports the column assignments: for every state and every regional total, CA+CB+CC+CD+CE+CG+CP equals "All C cases", RC+RM+RD equals "All R cases", and All C + All R + UD + AC + UC equals "All cases"; the four regional totals also equal the sums of their member states in every column. No misprints detected. Minor scan artifacts: the dotted "i" in several labels (Maine, Virginia, Michigan, Missouri, Illinois, Wisconsin, Connecticut, Union, Middle Atlantic) is faint in the scan; spellings are transcribed conventionally. A small stray ink mark sits in the "All C cases" cell of the East North Central row (before 9,737) and another between the CD and CE columns of that same row; both are read as speckle, not as footnote markers or digits.
p. 292. This crop is a continuation page: no column headings are printed on it, so header_rows is empty. The grid has 17 columns (stub + 16 data columns); column count was taken from the vertical rules, which run the full height of the page. Arithmetic cross-check: I summed every data column within each regional block against its printed subtotal. South Atlantic cannot be checked here (its first states are on the previous page). East South Central, West South Central, Mountain, Pacific and Outlying areas all reconcile exactly in every column EXCEPT one: in column 14, Kentucky 5 + Tennessee 5 + Alabama 0 + Mississippi 0 = 10, but the printed East South Central subtotal in that column is 5. Column 15 of the same block (0 + 1 + 0 + 3 = 4) and column 16 (4 + 6 + 5 + 2 = 17) both match their printed subtotals, so the column alignment in that block is not in doubt. I read both Kentucky and Tennessee as 5 in column 14 and have transcribed them as printed; either one of those two single digits is a scan misread or the printed subtotal is a misprint. This is the single cell group I would re-check against a higher-resolution scan. Scan artifacts treated as speckle, not as characters or footnote markers: South Atlantic column 8 shows a short dash-like mark immediately after the digit, printing as "2-"; I transcribed it as 2, consistent with it being a stray mark. A small apostrophe-like speck sits just left of Arkansas column 11 (61), and another just left of New Mexico column 13 (9); a stray comma-like mark sits left of Florida column 4 (164). None are transcribed. A stray pen-like mark appears in the blank top-right margin above the table, outside the grid. Row labels are given in standard spelling; the scan drops the dots on many i's (rendering e.g. "Hawau", "Mississippi", "Flonda", "Louisiana", "Anzona", "Mountam", "Pacific", "Puerto Rico", "Virgm Islands"), which I read as ordinary i's rather than as different letters. The footnote line is clipped by the bottom edge of the crop: only the upper half of the letterforms survives. It is legible as "1 See Glossary for definitions of terms." but the final word is partly cut, so the trailing text is a reading of truncated glyphs rather than a fully visible line. There may be additional footnotes below the crop.
Source image
Source data: U.S. NLRB Annual Reports (public domain). Reconstruction by NLRB Stats Archive. Read by claude-opus-5 (effort max, prompt extract_v1) from the 300-dpi scan; stitched by page. Updated October 2026.