NLRB Stats Archive › Annual Reports › FY1978 › Distribution of Unfair Labor Practice Situations Received, by Number of Employees in Establishments, Fiscal Year 1978
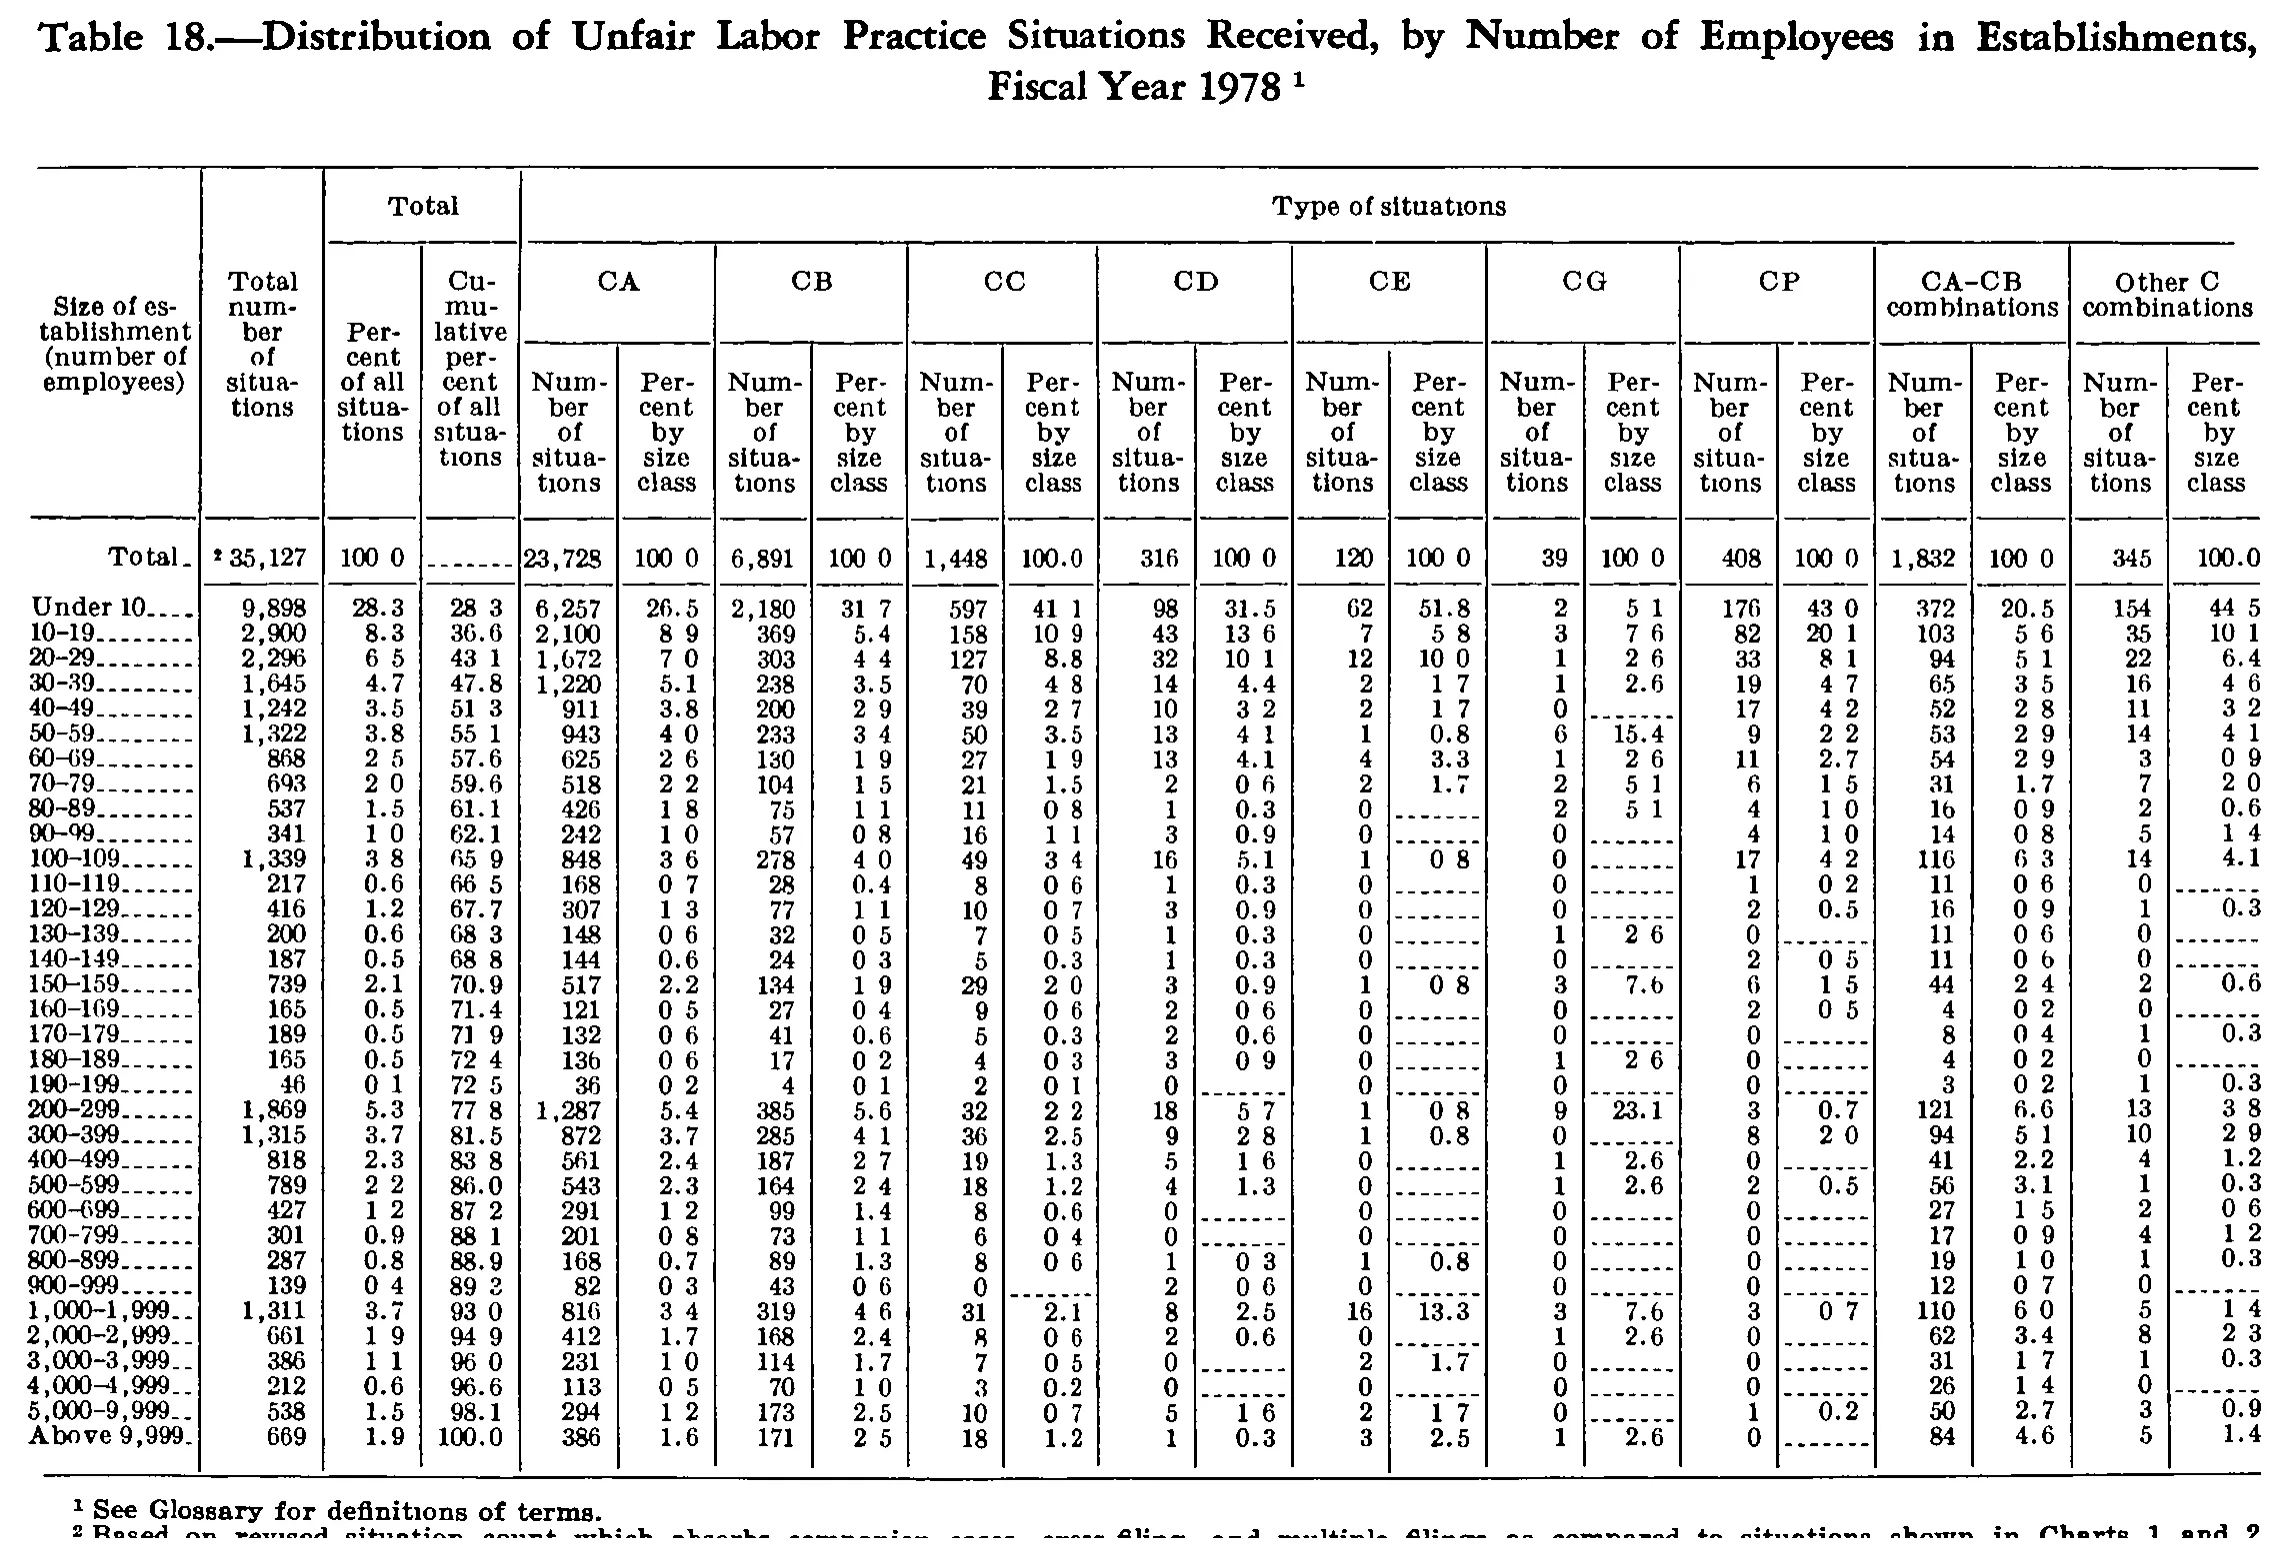
Distribution of Unfair Labor Practice Situations Received, by Number of Employees in Establishments, Fiscal Year 1978
| Size of establishment (number of employees) | Total number of situations | Total | Type of situations | ||||||||||||||||||
|---|---|---|---|---|---|---|---|---|---|---|---|---|---|---|---|---|---|---|---|---|---|
| Size of establishment (number of employees) | Total number of situations | Percent of all situations | Cumulative percent of all situations | CA | CB | CC | CD | CE | CG | CP | CA-CB combinations | Other C combinations | |||||||||
| Size of establishment (number of employees) | Total number of situations | Percent of all situations | Cumulative percent of all situations | Number of situations | Percent by size class | Number of situations | Percent by size class | Number of situations | Percent by size class | Number of situations | Percent by size class | Number of situations | Percent by size class | Number of situations | Percent by size class | Number of situations | Percent by size class | Number of situations | Percent by size class | Number of situations | Percent by size class |
| Total | 35,127 | 100.0 | 23,728 | 100.0 | 6,891 | 100.0 | 1,448 | 100.0 | 316 | 100.0 | 120 | 100.0 | 39 | 100.0 | 408 | 100.0 | 1,832 | 100.0 | 345 | 100.0 | |
| Under 10 | 9,898 | 28.3 | 28.3 | 6,257 | 26.5 | 2,180 | 31.7 | 597 | 41.1 | 98 | 31.5 | 62 | 51.8 | 2 | 5.1 | 176 | 43.0 | 372 | 20.5 | 154 | 44.5 |
| 10-19 | 2,900 | 8.3 | 36.6 | 2,100 | 8.9 | 369 | 5.4 | 158 | 10.9 | 43 | 13.6 | 7 | 5.8 | 3 | 7.6 | 82 | 20.1 | 103 | 5.6 | 35 | 10.1 |
| 20-29 | 2,296 | 6.5 | 43.1 | 1,672 | 7.0 | 303 | 4.4 | 127 | 8.8 | 32 | 10.1 | 12 | 10.0 | 1 | 2.6 | 33 | 8.1 | 94 | 5.1 | 22 | 6.4 |
| 30-39 | 1,645 | 4.7 | 47.8 | 1,220 | 5.1 | 238 | 3.5 | 70 | 4.8 | 14 | 4.4 | 2 | 1.7 | 1 | 2.6 | 19 | 4.7 | 65 | 3.5 | 16 | 4.6 |
| 40-49 | 1,242 | 3.5 | 51.3 | 911 | 3.8 | 200 | 2.9 | 39 | 2.7 | 10 | 3.2 | 2 | 1.7 | 0 | 17 | 4.2 | 52 | 2.8 | 11 | 3.2 | |
| 50-59 | 1,322 | 3.8 | 55.1 | 943 | 4.0 | 233 | 3.4 | 50 | 3.5 | 13 | 4.1 | 1 | 0.8 | 6 | 15.4 | 9 | 2.2 | 53 | 2.9 | 14 | 4.1 |
| 60-69 | 868 | 2.5 | 57.6 | 625 | 2.6 | 130 | 1.9 | 27 | 1.9 | 13 | 4.1 | 4 | 3.3 | 1 | 2.6 | 11 | 2.7 | 54 | 2.9 | 3 | 0.9 |
| 70-79 | 693 | 2.0 | 59.6 | 518 | 2.2 | 104 | 1.5 | 21 | 1.5 | 2 | 0.6 | 2 | 1.7 | 2 | 5.1 | 6 | 1.5 | 31 | 1.7 | 7 | 2.0 |
| 80-89 | 537 | 1.5 | 61.1 | 426 | 1.8 | 75 | 1.1 | 11 | 0.8 | 1 | 0.3 | 0 | 2 | 5.1 | 4 | 1.0 | 16 | 0.9 | 2 | 0.6 | |
| 90-99 | 341 | 1.0 | 62.1 | 242 | 1.0 | 57 | 0.8 | 16 | 1.1 | 3 | 0.9 | 0 | 0 | 4 | 1.0 | 14 | 0.8 | 5 | 1.4 | ||
| 100-109 | 1,339 | 3.8 | 65.9 | 848 | 3.6 | 278 | 4.0 | 49 | 3.4 | 16 | 5.1 | 1 | 0.8 | 0 | 17 | 4.2 | 116 | 6.3 | 14 | 4.1 | |
| 110-119 | 217 | 0.6 | 66.5 | 168 | 0.7 | 28 | 0.4 | 8 | 0.6 | 1 | 0.3 | 0 | 0 | 1 | 0.2 | 11 | 0.6 | 0 | |||
| 120-129 | 416 | 1.2 | 67.7 | 307 | 1.3 | 77 | 1.1 | 10 | 0.7 | 3 | 0.9 | 0 | 0 | 2 | 0.5 | 16 | 0.9 | 1 | 0.3 | ||
| 130-139 | 200 | 0.6 | 68.3 | 148 | 0.6 | 32 | 0.5 | 7 | 0.5 | 1 | 0.3 | 0 | 1 | 2.6 | 0 | 11 | 0.6 | 0 | |||
| 140-149 | 187 | 0.5 | 68.8 | 144 | 0.6 | 24 | 0.3 | 5 | 0.3 | 1 | 0.3 | 0 | 0 | 2 | 0.5 | 11 | 0.6 | 0 | |||
| 150-159 | 739 | 2.1 | 70.9 | 517 | 2.2 | 134 | 1.9 | 29 | 2.0 | 3 | 0.9 | 1 | 0.8 | 3 | 7.6 | 6 | 1.5 | 44 | 2.4 | 2 | 0.6 |
| 160-169 | 165 | 0.5 | 71.4 | 121 | 0.5 | 27 | 0.4 | 9 | 0.6 | 2 | 0.6 | 0 | 0 | 2 | 0.5 | 4 | 0.2 | 0 | |||
| 170-179 | 189 | 0.5 | 71.9 | 132 | 0.6 | 41 | 0.6 | 5 | 0.3 | 2 | 0.6 | 0 | 0 | 0 | 8 | 0.4 | 1 | 0.3 | |||
| 180-189 | 165 | 0.5 | 72.4 | 136 | 0.6 | 17 | 0.2 | 4 | 0.3 | 3 | 0.9 | 0 | 1 | 2.6 | 0 | 4 | 0.2 | 0 | |||
| 190-199 | 46 | 0.1 | 72.5 | 36 | 0.2 | 4 | 0.1 | 2 | 0.1 | 0 | 0 | 0 | 0 | 3 | 0.2 | 1 | 0.3 | ||||
| 200-299 | 1,869 | 5.3 | 77.8 | 1,287 | 5.4 | 385 | 5.6 | 32 | 2.2 | 18 | 5.7 | 1 | 0.8 | 9 | 23.1 | 3 | 0.7 | 121 | 6.6 | 13 | 3.8 |
| 300-399 | 1,315 | 3.7 | 81.5 | 872 | 3.7 | 285 | 4.1 | 36 | 2.5 | 9 | 2.8 | 1 | 0.8 | 0 | 8 | 2.0 | 94 | 5.1 | 10 | 2.9 | |
| 400-499 | 818 | 2.3 | 83.8 | 561 | 2.4 | 187 | 2.7 | 19 | 1.3 | 5 | 1.6 | 0 | 1 | 2.6 | 0 | 41 | 2.2 | 4 | 1.2 | ||
| 500-599 | 789 | 2.2 | 86.0 | 543 | 2.3 | 164 | 2.4 | 18 | 1.2 | 4 | 1.3 | 0 | 1 | 2.6 | 2 | 0.5 | 56 | 3.1 | 1 | 0.3 | |
| 600-699 | 427 | 1.2 | 87.2 | 291 | 1.2 | 99 | 1.4 | 8 | 0.6 | 0 | 0 | 0 | 0 | 27 | 1.5 | 2 | 0.6 | ||||
| 700-799 | 301 | 0.9 | 88.1 | 201 | 0.8 | 73 | 1.1 | 6 | 0.4 | 0 | 0 | 0 | 0 | 17 | 0.9 | 4 | 1.2 | ||||
| 800-899 | 287 | 0.8 | 88.9 | 168 | 0.7 | 89 | 1.3 | 8 | 0.6 | 1 | 0.3 | 1 | 0.8 | 0 | 0 | 19 | 1.0 | 1 | 0.3 | ||
| 900-999 | 139 | 0.4 | 89.2 | 82 | 0.3 | 43 | 0.6 | 0 | 2 | 0.6 | 0 | 0 | 0 | 12 | 0.7 | 0 | |||||
| 1,000-1,999 | 1,311 | 3.7 | 93.0 | 816 | 3.4 | 319 | 4.6 | 31 | 2.1 | 8 | 2.5 | 16 | 13.3 | 3 | 7.6 | 3 | 0.7 | 110 | 6.0 | 5 | 1.4 |
| 2,000-2,999 | 661 | 1.9 | 94.9 | 412 | 1.7 | 168 | 2.4 | 8 | 0.6 | 2 | 0.6 | 0 | 1 | 2.6 | 0 | 62 | 3.4 | 8 | 2.3 | ||
| 3,000-3,999 | 386 | 1.1 | 96.0 | 231 | 1.0 | 114 | 1.7 | 7 | 0.5 | 0 | 2 | 1.7 | 0 | 0 | 31 | 1.7 | 1 | 0.3 | |||
| 4,000-4,999 | 212 | 0.6 | 96.6 | 113 | 0.5 | 70 | 1.0 | 3 | 0.2 | 0 | 0 | 0 | 0 | 26 | 1.4 | 0 | |||||
| 5,000-9,999 | 538 | 1.5 | 98.1 | 294 | 1.2 | 173 | 2.5 | 10 | 0.7 | 5 | 1.6 | 2 | 1.7 | 0 | 1 | 0.2 | 50 | 2.7 | 3 | 0.9 | |
| Above 9,999 | 669 | 1.9 | 100.0 | 386 | 1.6 | 171 | 2.5 | 18 | 1.2 | 1 | 0.3 | 3 | 2.5 | 1 | 2.6 | 0 | 84 | 4.6 | 5 | 1.4 | |
- 1 See Glossary for definitions of terms.
- 2 Based on revised situation count which absorbs companion cases, cross filing, and multiple filings as compared to situations shown in Charts 1 and 2
290 of 290 figures sit in a row or column sum that works out.
Reader’s notes
p. 293. 22 columns: stub, Total number of situations, then Total (Percent / Cumulative percent), then nine two-column type-of-situation blocks (CA, CB, CC, CD, CE, CG, CP, CA-CB combinations, Other C combinations). Decimal points: in this scan the decimal point in most one-decimal values is very faint and often images as a blank (the Total row prints as "100 0" in seven of the nine type columns and as "100.0" in the other two; body cells show the same mixture, e.g. "28 3", "51 3", "43 0"). Every one of these columns is a one-decimal percent series, so I have transcribed them all with an explicit decimal point. No digits were changed. Column-assignment check: each of the nine type columns and the Total-number column sums exactly to its printed Total-row figure (CA 23,728; CB 6,891; CC 1,448; CD 316; CE 120; CG 39; CP 408; CA-CB 1,832; Other C 345; total 35,127), and the nine type totals sum to 35,127. This makes the column placement of every count reliable. Doubtful cells (transcribed exactly as I read them, not corrected): - "Under 10", CA / Percent by size class: read 26.5; 6,257/23,728 recomputes to 26.4, so the final digit may be a 4. - "Under 10", CC / Percent by size class: read 41.1; 597/1,448 recomputes to 41.2. - "Under 10", CE / Percent by size class: read 51.8; 62/120 recomputes to 51.7. - "900-999", Cumulative percent of all situations: read 89.2; the running sum of the Percent column gives 89.3, and the next row's printed 93.0 is consistent with 89.3 + 3.7. Every other cumulative value in the column matches the running sum exactly. - "Under 10", Percent of all situations: printed 28.3 although 9,898/35,127 = 28.18; the printed cumulative column confirms 28.3 was the figure actually used, so this is the report's own rounding, not a misreading. Empty percent cells: in the type columns a count of 0 is usually followed by a dash rule ("------") in the matching percent cell; a few (e.g. "40-49" CG, "90-99" CG) appear simply blank. All such cells are "". The footnote-2 line sits on the bottom edge of the crop and its lower half is sheared off, so its wording is a best read and I cannot see whether a terminal period or further text follows "Charts 1 and 2". The caption's own footnote marker 1 (on "Fiscal Year 1978") belongs to the omitted caption line.
Source image
Source data: U.S. NLRB Annual Reports (public domain). Reconstruction by NLRB Stats Archive. Read by claude-opus-5 (effort max, prompt extract_v1) from the 300-dpi scan; stitched by page. Updated October 2026.