NLRB Stats Archive › Annual Reports › FY1978 › Geographic Distribution of Cases Received, Fiscal Year 1978
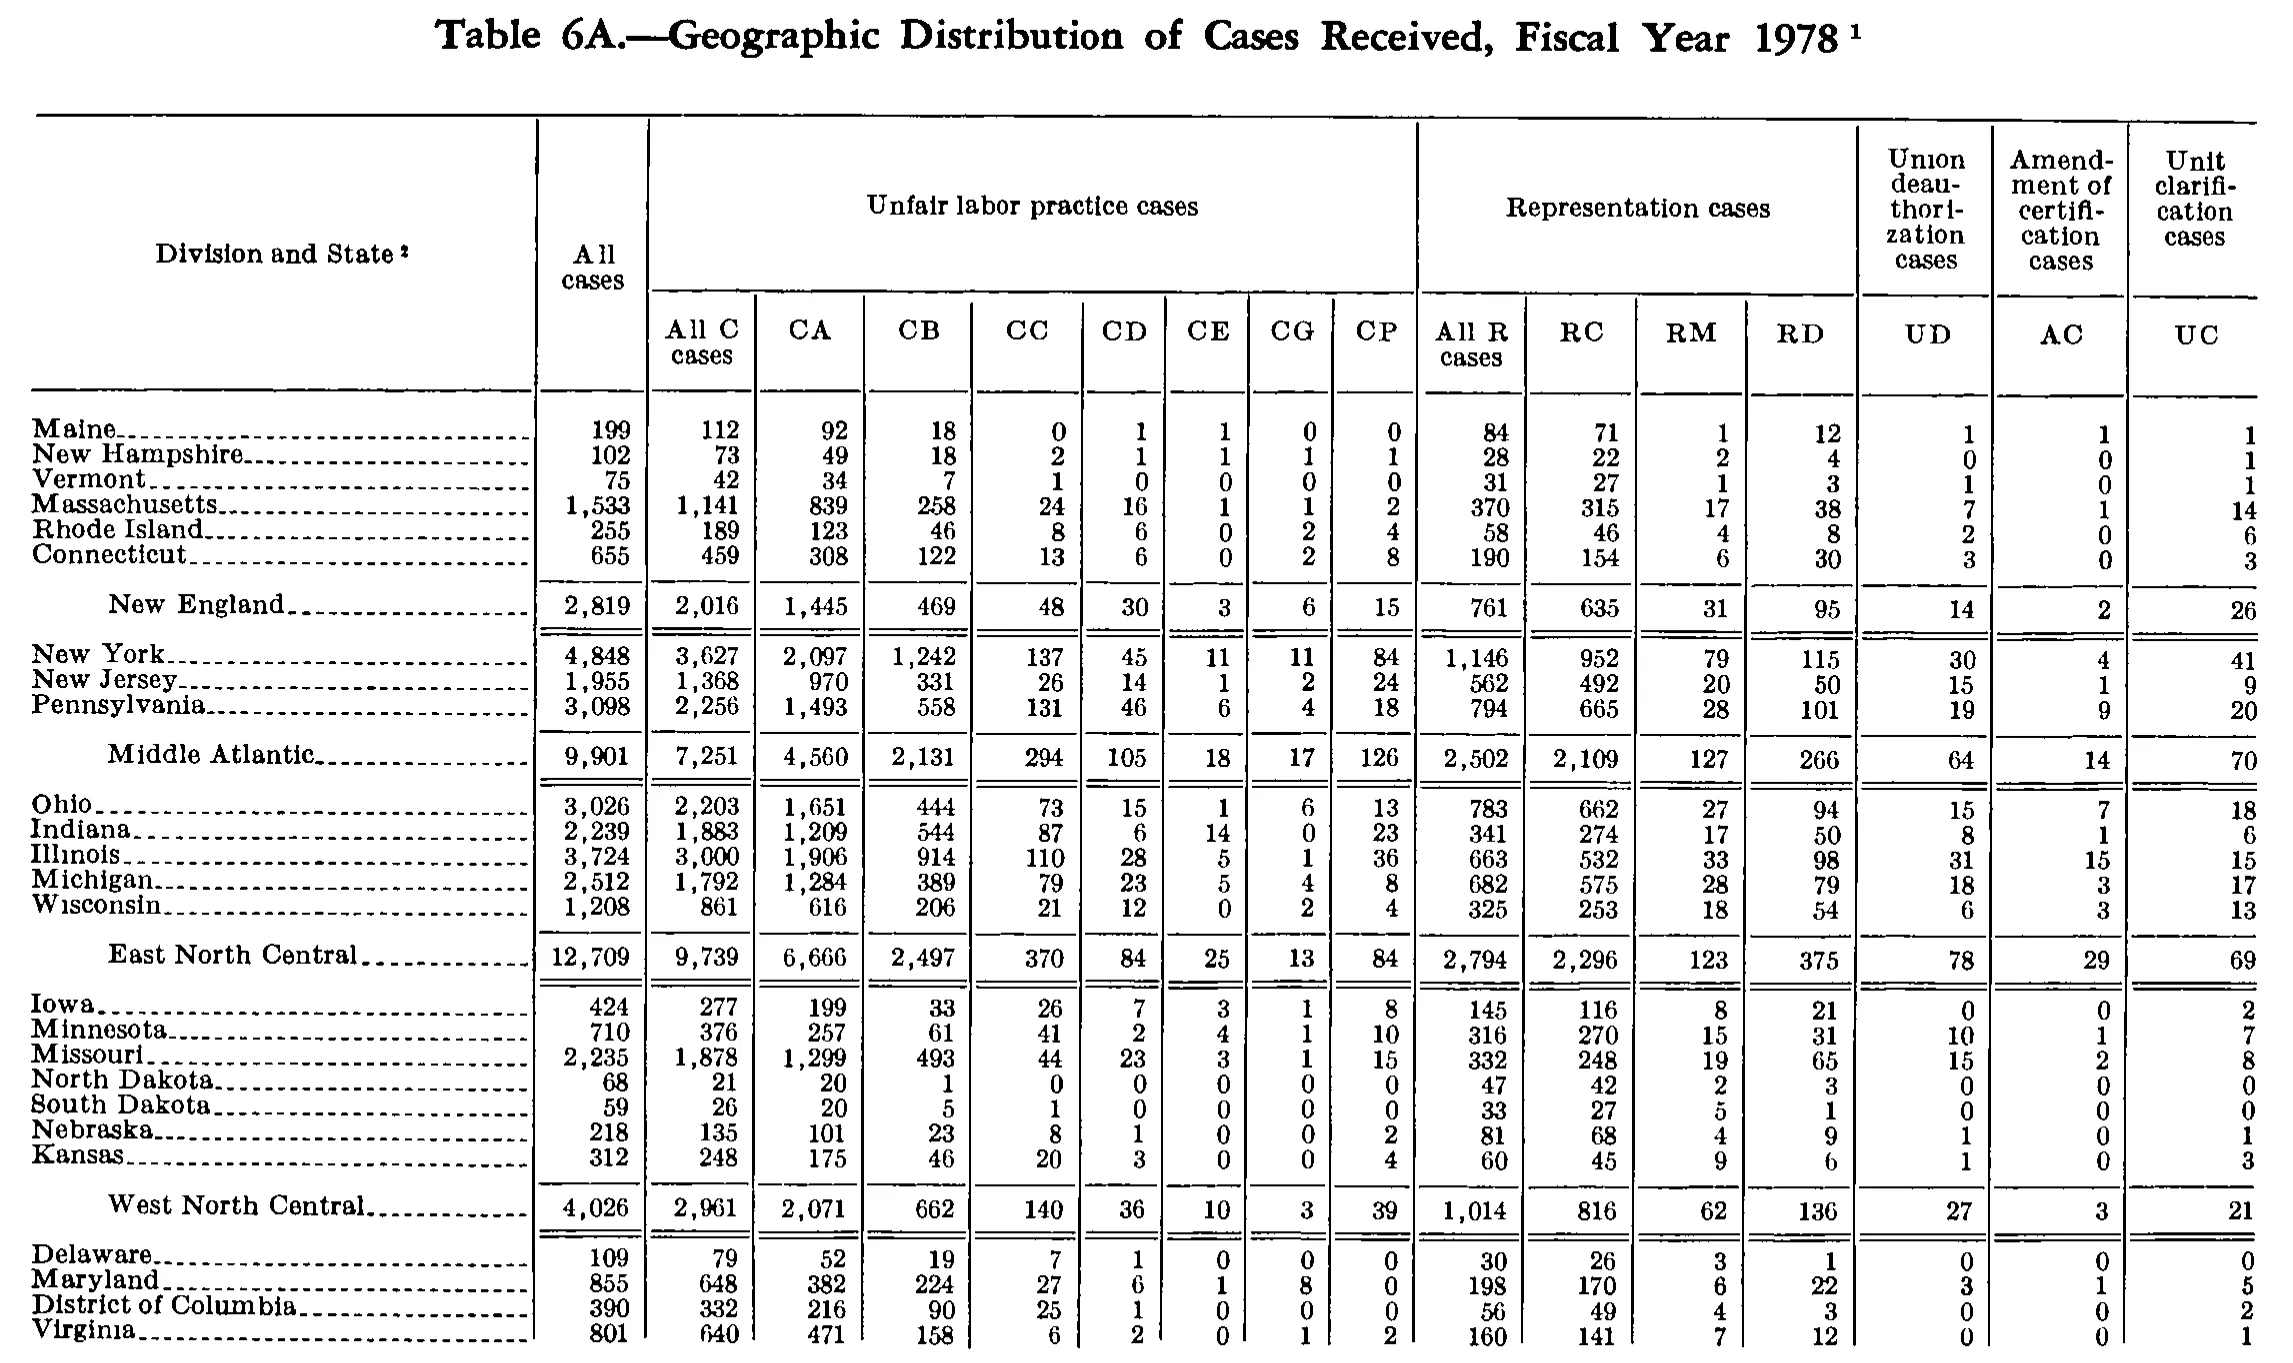
Geographic Distribution of Cases Received, Fiscal Year 1978
Stitched from pp. 263–264.
| Division and State | All cases | Unfair labor practice cases | Representation cases | Union deauthorization cases | Amendment of certification cases | Unit clarification cases | ||||||||||
|---|---|---|---|---|---|---|---|---|---|---|---|---|---|---|---|---|
| Division and State | All cases | All C cases | CA | CB | CC | CD | CE | CG | CP | All R cases | RC | RM | RD | UD | AC | UC |
| Maine | 199 | 112 | 92 | 18 | 0 | 1 | 1 | 0 | 0 | 84 | 71 | 1 | 12 | 1 | 1 | 1 |
| New Hampshire | 102 | 73 | 49 | 18 | 2 | 1 | 1 | 1 | 1 | 28 | 22 | 2 | 4 | 0 | 0 | 1 |
| Vermont | 75 | 42 | 34 | 7 | 1 | 0 | 0 | 0 | 0 | 31 | 27 | 1 | 3 | 1 | 0 | 1 |
| Massachusetts | 1,533 | 1,141 | 839 | 258 | 24 | 16 | 1 | 1 | 2 | 370 | 315 | 17 | 38 | 7 | 1 | 14 |
| Rhode Island | 255 | 189 | 123 | 46 | 8 | 6 | 0 | 2 | 4 | 58 | 46 | 4 | 8 | 2 | 0 | 6 |
| Connecticut | 655 | 459 | 308 | 122 | 13 | 6 | 0 | 2 | 8 | 190 | 154 | 6 | 30 | 3 | 0 | 3 |
| New England | 2,819 | 2,016 | 1,445 | 469 | 48 | 30 | 3 | 6 | 15 | 761 | 635 | 31 | 95 | 14 | 2 | 26 |
| New York | 4,848 | 3,627 | 2,097 | 1,242 | 137 | 45 | 11 | 11 | 84 | 1,146 | 952 | 79 | 115 | 30 | 4 | 41 |
| New Jersey | 1,955 | 1,368 | 970 | 331 | 26 | 14 | 1 | 2 | 24 | 562 | 492 | 20 | 50 | 15 | 1 | 9 |
| Pennsylvania | 3,098 | 2,256 | 1,493 | 558 | 131 | 46 | 6 | 4 | 18 | 794 | 665 | 28 | 101 | 19 | 9 | 20 |
| Middle Atlantic | 9,901 | 7,251 | 4,560 | 2,131 | 294 | 105 | 18 | 17 | 126 | 2,502 | 2,109 | 127 | 266 | 64 | 14 | 70 |
| Ohio | 3,026 | 2,203 | 1,651 | 444 | 73 | 15 | 1 | 6 | 13 | 783 | 662 | 27 | 94 | 15 | 7 | 18 |
| Indiana | 2,239 | 1,883 | 1,209 | 544 | 87 | 6 | 14 | 0 | 23 | 341 | 274 | 17 | 50 | 8 | 1 | 6 |
| Illinois | 3,724 | 3,000 | 1,906 | 914 | 110 | 28 | 5 | 1 | 36 | 663 | 532 | 33 | 98 | 31 | 15 | 15 |
| Michigan | 2,512 | 1,792 | 1,284 | 389 | 79 | 23 | 5 | 4 | 8 | 682 | 575 | 28 | 79 | 18 | 3 | 17 |
| Wisconsin | 1,208 | 861 | 616 | 206 | 21 | 12 | 0 | 2 | 4 | 325 | 253 | 18 | 54 | 6 | 3 | 13 |
| East North Central | 12,709 | 9,739 | 6,666 | 2,497 | 370 | 84 | 25 | 13 | 84 | 2,794 | 2,296 | 123 | 375 | 78 | 29 | 69 |
| Iowa | 424 | 277 | 199 | 33 | 26 | 7 | 3 | 1 | 8 | 145 | 116 | 8 | 21 | 0 | 0 | 2 |
| Minnesota | 710 | 376 | 257 | 61 | 41 | 2 | 4 | 1 | 10 | 316 | 270 | 15 | 31 | 10 | 1 | 7 |
| Missouri | 2,235 | 1,878 | 1,299 | 493 | 44 | 23 | 3 | 1 | 15 | 332 | 248 | 19 | 65 | 15 | 2 | 8 |
| North Dakota | 68 | 21 | 20 | 1 | 0 | 0 | 0 | 0 | 0 | 47 | 42 | 2 | 3 | 0 | 0 | 0 |
| South Dakota | 59 | 26 | 20 | 5 | 1 | 0 | 0 | 0 | 0 | 33 | 27 | 5 | 1 | 0 | 0 | 0 |
| Nebraska | 218 | 135 | 101 | 23 | 8 | 1 | 0 | 0 | 2 | 81 | 68 | 4 | 9 | 1 | 0 | 1 |
| Kansas | 312 | 248 | 175 | 46 | 20 | 3 | 0 | 0 | 4 | 60 | 45 | 9 | 6 | 1 | 0 | 3 |
| West North Central | 4,026 | 2,961 | 2,071 | 662 | 140 | 36 | 10 | 3 | 39 | 1,014 | 816 | 62 | 136 | 27 | 3 | 21 |
| Delaware | 109 | 79 | 52 | 19 | 7 | 1 | 0 | 0 | 0 | 30 | 26 | 3 | 1 | 0 | 0 | 0 |
| Maryland | 855 | 648 | 382 | 224 | 27 | 6 | 1 | 8 | 0 | 198 | 170 | 6 | 22 | 3 | 1 | 5 |
| District of Columbia | 390 | 332 | 216 | 90 | 25 | 1 | 0 | 0 | 0 | 56 | 49 | 4 | 3 | 0 | 0 | 2 |
| Virginia | 801 | 640 | 471 | 158 | 6 | 2 | 0 | 1 | 2 | 160 | 141 | 7 | 12 | 0 | 0 | 1 |
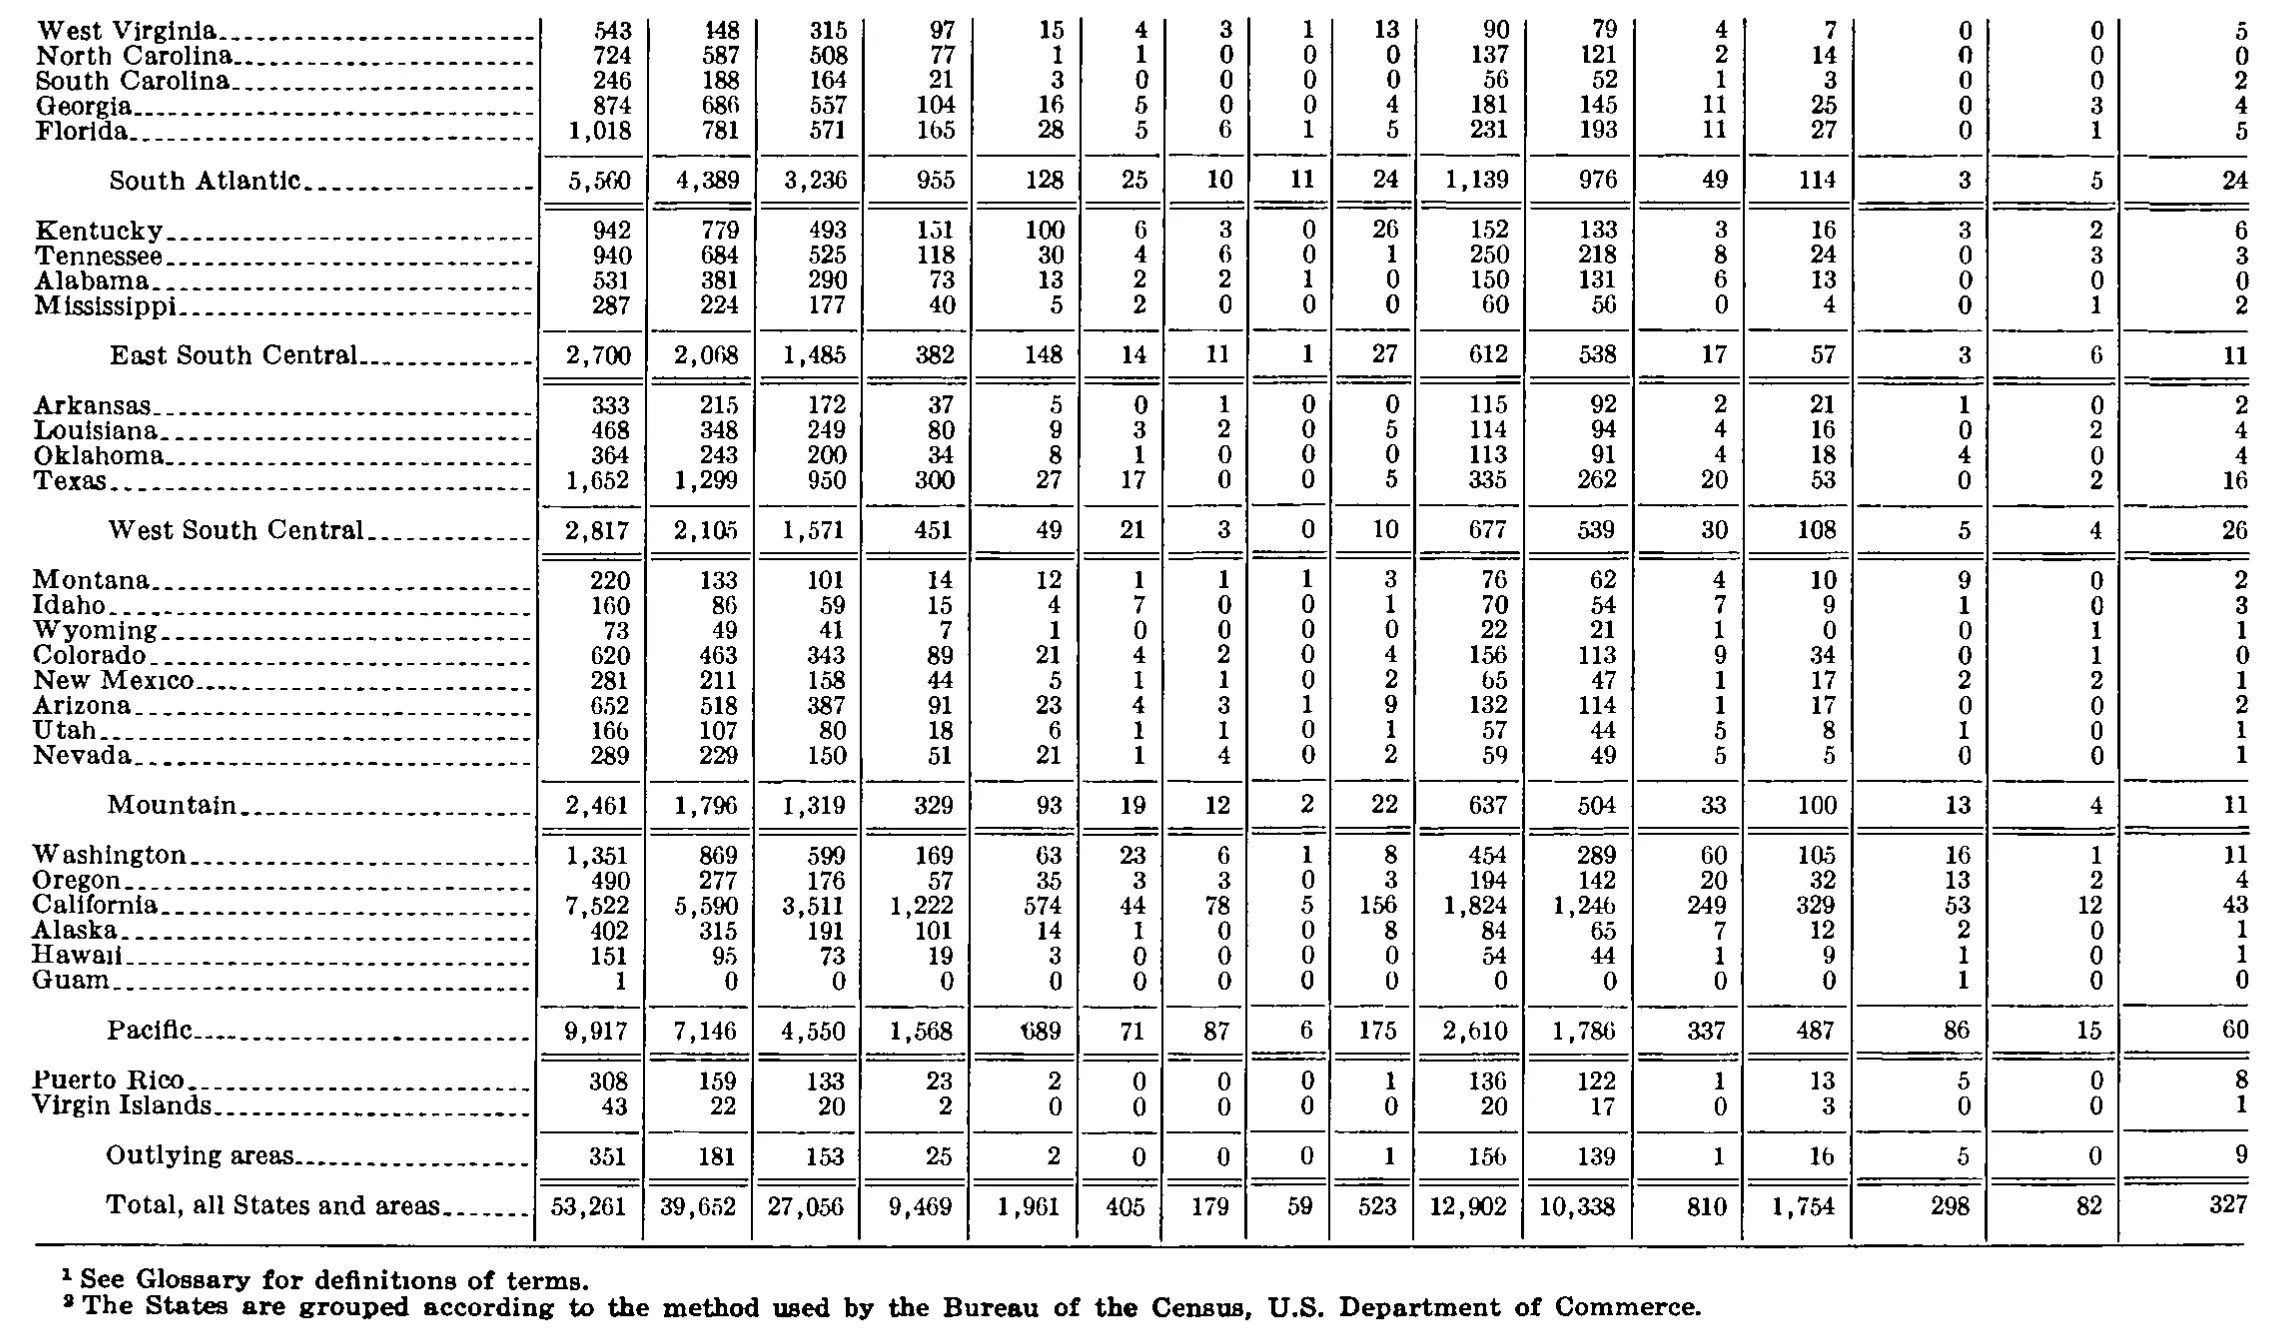
| West Virginia | 543 | 148 | 315 | 97 | 15 | 4 | 3 | 1 | 13 | 90 | 79 | 4 | 7 | 0 | 0 | 5 |
| North Carolina | 724 | 587 | 508 | 77 | 1 | 1 | 0 | 0 | 0 | 137 | 121 | 2 | 14 | 0 | 0 | 0 |
| South Carolina | 246 | 188 | 164 | 21 | 3 | 0 | 0 | 0 | 0 | 56 | 52 | 1 | 3 | 0 | 0 | 2 |
| Georgia | 874 | 686 | 557 | 104 | 16 | 5 | 0 | 0 | 4 | 181 | 145 | 11 | 25 | 0 | 3 | 4 |
| Florida | 1,018 | 781 | 571 | 165 | 28 | 5 | 6 | 1 | 5 | 231 | 193 | 11 | 27 | 0 | 1 | 5 |
| South Atlantic | 5,560 | 4,389 | 3,236 | 955 | 128 | 25 | 10 | 11 | 24 | 1,139 | 976 | 49 | 114 | 3 | 5 | 24 |
| Kentucky | 942 | 779 | 493 | 151 | 100 | 6 | 3 | 0 | 26 | 152 | 133 | 3 | 16 | 3 | 2 | 6 |
| Tennessee | 940 | 684 | 525 | 118 | 30 | 4 | 6 | 0 | 1 | 250 | 218 | 8 | 24 | 0 | 3 | 3 |
| Alabama | 531 | 381 | 290 | 73 | 13 | 2 | 2 | 1 | 0 | 150 | 131 | 6 | 13 | 0 | 0 | 0 |
| Mississippi | 287 | 224 | 177 | 40 | 5 | 2 | 0 | 0 | 0 | 60 | 56 | 0 | 4 | 0 | 1 | 2 |
| East South Central | 2,700 | 2,068 | 1,485 | 382 | 148 | 14 | 11 | 1 | 27 | 612 | 538 | 17 | 57 | 3 | 6 | 11 |
| Arkansas | 333 | 215 | 172 | 37 | 5 | 0 | 1 | 0 | 0 | 115 | 92 | 2 | 21 | 1 | 0 | 2 |
| Louisiana | 468 | 348 | 249 | 80 | 9 | 3 | 2 | 0 | 5 | 114 | 94 | 4 | 16 | 0 | 2 | 4 |
| Oklahoma | 364 | 243 | 200 | 34 | 8 | 1 | 0 | 0 | 0 | 113 | 91 | 4 | 18 | 4 | 0 | 0 |
| Texas | 1,652 | 1,299 | 950 | 300 | 27 | 17 | 0 | 0 | 5 | 335 | 262 | 20 | 53 | 0 | 2 | 16 |
| West South Central | 2,817 | 2,105 | 1,571 | 451 | 49 | 21 | 3 | 0 | 10 | 677 | 539 | 30 | 108 | 5 | 4 | 26 |
| Montana | 220 | 133 | 101 | 14 | 12 | 1 | 1 | 1 | 3 | 76 | 62 | 4 | 10 | 9 | 0 | 2 |
| Idaho | 160 | 86 | 59 | 15 | 4 | 7 | 0 | 0 | 1 | 70 | 54 | 7 | 9 | 1 | 0 | 3 |
| Wyoming | 73 | 49 | 41 | 7 | 1 | 0 | 0 | 0 | 0 | 22 | 21 | 1 | 0 | 0 | 1 | 1 |
| Colorado | 620 | 463 | 343 | 89 | 21 | 4 | 2 | 0 | 4 | 156 | 113 | 9 | 34 | 0 | 1 | 0 |
| New Mexico | 281 | 211 | 158 | 44 | 5 | 1 | 1 | 0 | 2 | 65 | 47 | 1 | 17 | 2 | 2 | 1 |
| Arizona | 652 | 518 | 387 | 91 | 23 | 4 | 3 | 1 | 9 | 132 | 114 | 1 | 17 | 0 | 0 | 2 |
| Utah | 166 | 107 | 80 | 18 | 6 | 1 | 1 | 0 | 1 | 57 | 44 | 5 | 8 | 1 | 0 | 1 |
| Nevada | 289 | 229 | 150 | 51 | 21 | 1 | 4 | 0 | 2 | 59 | 49 | 5 | 5 | 0 | 0 | 1 |
| Mountain | 2,461 | 1,796 | 1,319 | 329 | 93 | 19 | 12 | 2 | 22 | 637 | 504 | 33 | 100 | 13 | 4 | 11 |
| Washington | 1,351 | 869 | 599 | 169 | 63 | 23 | 6 | 1 | 8 | 454 | 289 | 60 | 105 | 16 | 1 | 11 |
| Oregon | 490 | 277 | 176 | 57 | 35 | 3 | 3 | 0 | 3 | 194 | 142 | 20 | 32 | 13 | 2 | 4 |
| California | 7,522 | 5,590 | 3,511 | 1,222 | 574 | 44 | 78 | 5 | 156 | 1,824 | 1,246 | 249 | 329 | 53 | 12 | 43 |
| Alaska | 402 | 315 | 191 | 101 | 14 | 1 | 0 | 0 | 8 | 84 | 65 | 7 | 12 | 2 | 0 | 1 |
| Hawaii | 151 | 95 | 73 | 19 | 3 | 0 | 0 | 0 | 0 | 54 | 44 | 1 | 9 | 1 | 0 | 1 |
| Guam | 1 | 0 | 0 | 0 | 0 | 0 | 0 | 0 | 0 | 0 | 0 | 0 | 0 | 1 | 0 | 0 |
| Pacific | 9,917 | 7,146 | 4,550 | 1,568 | 689 | 71 | 87 | 6 | 175 | 2,610 | 1,786 | 337 | 487 | 86 | 15 | 60 |
| Puerto Rico | 308 | 159 | 133 | 23 | 2 | 0 | 0 | 0 | 1 | 136 | 122 | 1 | 13 | 5 | 0 | 8 |
| Virgin Islands | 43 | 22 | 20 | 2 | 0 | 0 | 0 | 0 | 0 | 20 | 17 | 0 | 3 | 0 | 0 | 1 |
| Outlying areas | 351 | 181 | 153 | 25 | 2 | 0 | 0 | 0 | 1 | 156 | 139 | 1 | 16 | 5 | 0 | 9 |
| Total, all States and areas | 53,261 | 39,652 | 27,056 | 9,469 | 1,961 | 405 | 179 | 59 | 523 | 12,902 | 10,338 | 810 | 1,754 | 298 | 82 | 327 |
- 1 See Glossary for definitions of terms.
- 2 The States are grouped according to the method used by the Bureau of the Census, U.S. Department of Commerce.
880 of 881 figures sit in a row or column sum that works out. 5 cells break a sum: 'West Virginia', column 3: prints 148, columns 4 to 10 add to 448; 'West Virginia', column 2: prints 543, the subtotals in columns 3 to 17 add to 243; 'Oklahoma', column 2: prints 364, the subtotals in columns 3 to 17 add to 360; 'West South Central', column 17: prints 26, rows 'Arkansas' to 'Texas' add to 22; 'South Atlantic', column 3: prints 4,389, rows 'Delaware' to 'Florida' add to 4,089.
Reader’s notes
p. 263. The crop is cut off at the bottom: "Virginia" is the last row fully printed on this image, and the table continues (the South Atlantic division subtotal and all remaining divisions/states are on the following portion). No footnote texts appear on this crop, although footnote markers are present (a raised 1 on the caption, which is excluded, and a raised 2 on the stub heading "Division and State"); the footnote texts must be on the continuation. Column structure: 17 columns — stub, "All cases", eight columns under "Unfair labor practice cases" (All C cases, CA, CB, CC, CD, CE, CG, CP), four under "Representation cases" (All R cases, RC, RM, RD), then UD, AC, UC. Scan quality is good and no cell was doubtful. As a cross-check, for every state row the C-case detail sums to the printed "All C cases" and All C + All R + UD + AC + UC equals the printed "All cases"; the division subtotal rows also equal the sums of their member states. No discrepancies found, so nothing was adjusted.
p. 264. This crop is a continuation page: no column headings are printed on it, so header_rows is empty. The grid has 17 columns (stub + 16 numeric columns), read off the vertical rules; the last numeric column is set wider than the others but is a single column (values 5, 0, 2, 4, 5, 24, ... 327). The crop begins mid-way through the South Atlantic group (Delaware through Virginia are on the preceding page), so that group's subtotal is larger than the sum of the five State rows shown here; all other groups are complete on this page. Two cells disagree with the table's internal arithmetic and are transcribed exactly as they appear: - West Virginia, column 2 (the total-C-cases column): printed as "148". Both internal checks require 448 here (315+97+15+4+3+1+13 = 448, and 448+90+0+0+5 = 543, the printed row total). The leading digit is ambiguous in this 1-bit scan; it is either a misprint for 448 or a "4" that scanned as a "1". Treat this cell as doubtful. - Oklahoma, last column: printed as "0". Both internal checks require 4 (243+113+4+0+4 = 364, the printed row total; and the West South Central subtotal of 26 = 2+4+4+16). Either a misprint or a doubtful glyph; transcribed as read. Every other cell on the page reconciles on all three internal relations (col 2 = sum of cols 3-9; col 10 = sum of cols 11-13; col 1 = col 2 + col 10 + cols 14+15+16; and each group subtotal = sum of its State rows), which supports the column assignment of the numbers. Row labels carry no footnote markers on this crop; the two footnote markers (1 and 2) belong to the caption/headings on the first page of the table. The second footnote's marker is printed as a raised 2 (it scans somewhat like a 3).
Source image
Source data: U.S. NLRB Annual Reports (public domain). Reconstruction by NLRB Stats Archive. Read by claude-opus-5 (effort max, prompt extract_v1) from the 300-dpi scan; stitched by page. Updated October 2026.